| Param | Original file | Final file |
|---|---|---|
| Filename | modeM0/AS1A12_018T01_9000005470_39371cztM0_level2.fits | modeM0/AS1A12_018T01_9000005470_39371cztM0_level2_quad_clean.evt |
| Size (bytes) | 358,125,120 | 88,724,160 |
| Size | 341.5 MB | 84.6 MB |
| Events in quadrant A | 2,705,416 | 599,699 |
| Events in quadrant B | 2,961,297 | 606,268 |
| Events in quadrant C | 2,540,981 | 587,514 |
| Events in quadrant D | 4,635,995 | 521,688 |
| Mode M9 | |||
|---|---|---|---|
| Quadrant | BADHDUFLAG | Total packets | Discarded packets |
| A | 0 | 17 | 0 |
| B | 0 | 17 | 0 |
| C | 0 | 17 | 0 |
| D | 0 | 18 | 0 |
| Mode SS | |||
|---|---|---|---|
| Quadrant | BADHDUFLAG | Total packets | Discarded packets |
| A | 0 | 108 | 0 |
| B | 0 | 108 | 0 |
| C | 0 | 108 | 0 |
| D | 0 | 108 | 0 |
| Mode M0 | |||
|---|---|---|---|
| Quadrant | BADHDUFLAG | Total packets | Discarded packets |
| A | 0 | 11497 | 3 |
| B | 0 | 12538 | 2 |
| C | 0 | 10938 | 2 |
| D | 0 | 17488 | 2 |
| Quadrant | Total seconds | Saturated seconds | Saturation percentage |
|---|---|---|---|
| A | 5305 | 13 | 0.245052% |
| B | 5305 | 120 | 2.262017% |
| C | 5305 | 9 | 0.169651% |
| D | 5305 | 313 | 5.900094% |
Noise dominated data is calculated using 1-second bins in cleaned event files. If a bin has >2000 counts, and if more than 50% of those come from <1% of pixels, then it is considered to be noise-dominated and hence unusable.
| Quadrant | # 1 sec bins | Bins with >0 counts | Bins with >2000 counts | High rate bins dominated by noise | Noise dominated (total time) | Noise dominated (detector-on time) | Marked lightcurve |
|---|---|---|---|---|---|---|---|
| A | 7038 | 5306 | 4 | 4 | 0.06% | 0.08% | 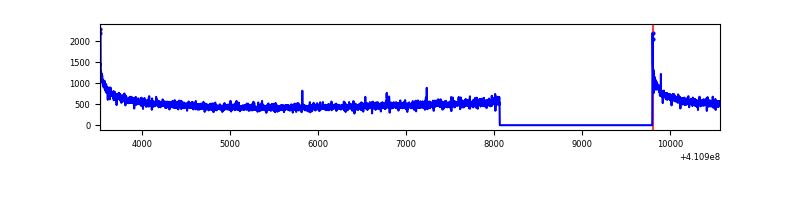 |
| B | 7038 | 5306 | 60 | 60 | 0.85% | 1.13% | 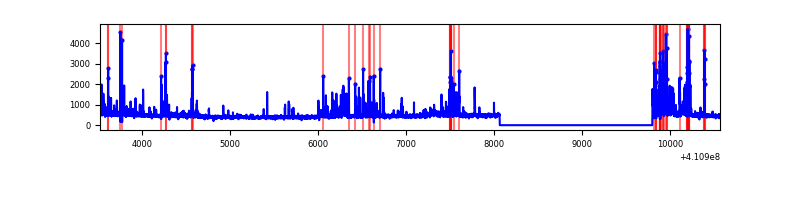 |
| C | 7038 | 5306 | 6 | 6 | 0.09% | 0.11% | 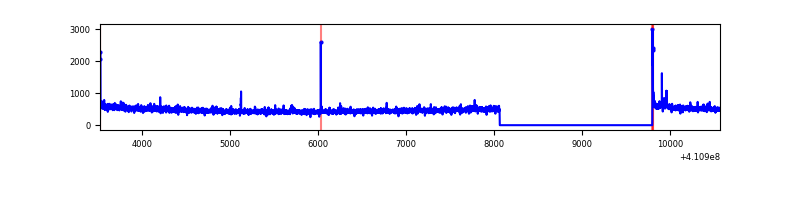 |
| D | 7038 | 5306 | 251 | 251 | 3.57% | 4.73% | 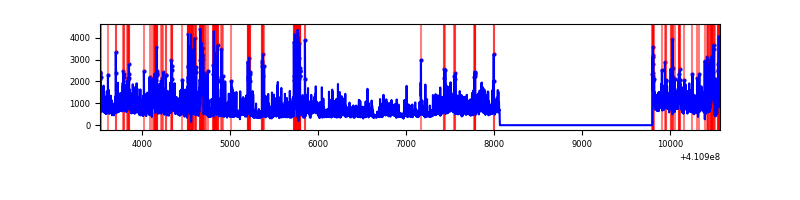 |
Top three noisy pixels from each quadrant. If the there are fewer than three noisy pixels in the level2.evt file, extra rows are filled as -1
| Pixel properties | Quadrant properties | ||||||
|---|---|---|---|---|---|---|---|
| Quadrant | DetID | PixID | Counts | Sigma | Mean | Median | Sigma |
| A | 10 | 83 | 421244 | 3540.83 | 583 | 571 | 118.8 |
| A | 3 | 1 | 16253 | 132.0 | 583 | 571 | 118.8 |
| A | 13 | 254 | 9562 | 75.68 | 583 | 571 | 118.8 |
| B | 5 | 172 | 533933 | 4702.25 | 579 | 563 | 113.4 |
| B | 5 | 255 | 125439 | 1100.92 | 579 | 563 | 113.4 |
| B | 0 | 230 | 15917 | 135.36 | 579 | 563 | 113.4 |
| C | 15 | 214 | 227246 | 1694.37 | 574 | 578 | 133.8 |
| C | 0 | 10 | 20312 | 147.51 | 574 | 578 | 133.8 |
| C | 3 | 233 | 17988 | 130.14 | 574 | 578 | 133.8 |
| D | 12 | 235 | 1584418 | 11591.05 | 558 | 543 | 136.6 |
| D | 13 | 249 | 743082 | 5434.02 | 558 | 543 | 136.6 |
| D | 2 | 249 | 62276 | 451.77 | 558 | 543 | 136.6 |
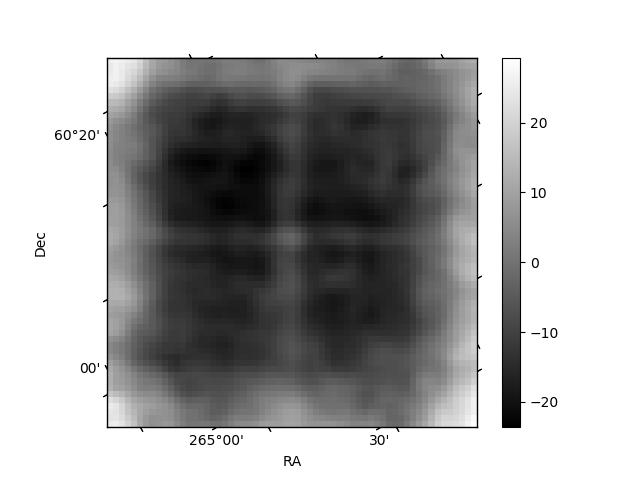
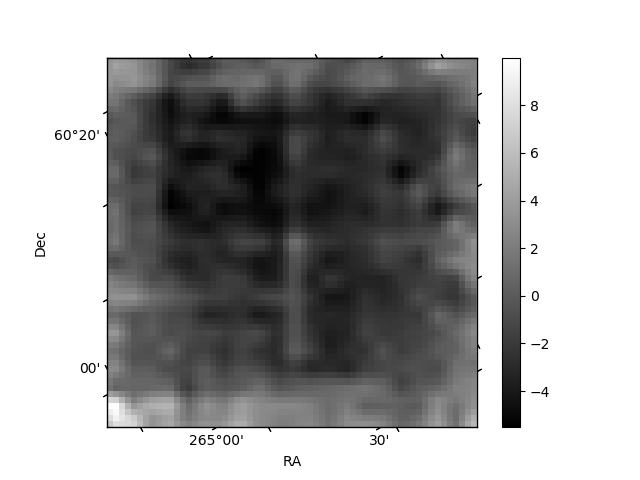
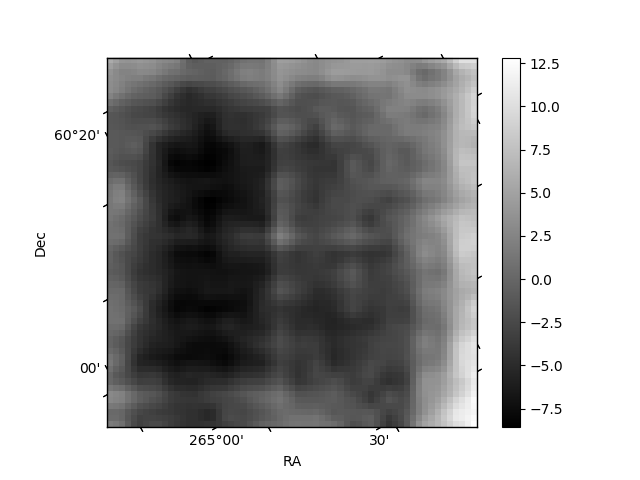
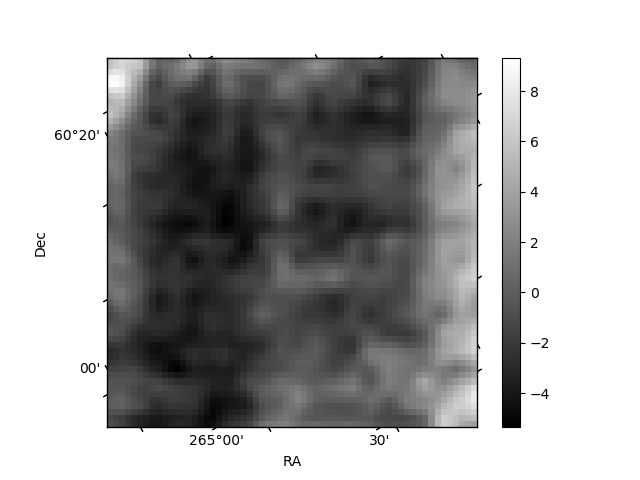
Histogram calculated using DETX and DETY for each event in the final _common_clean file
| Quadrant A | 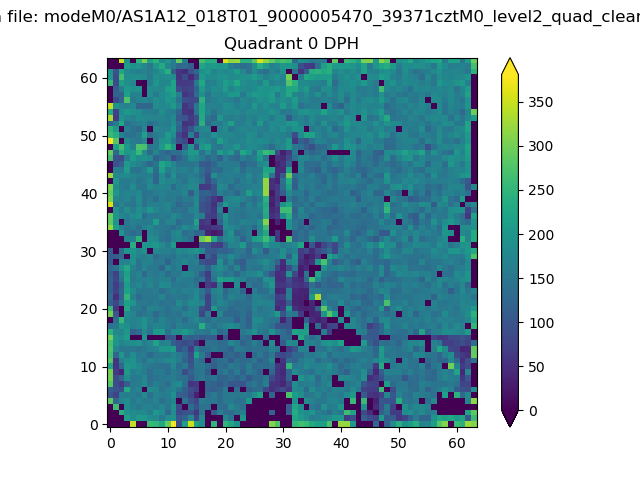 |
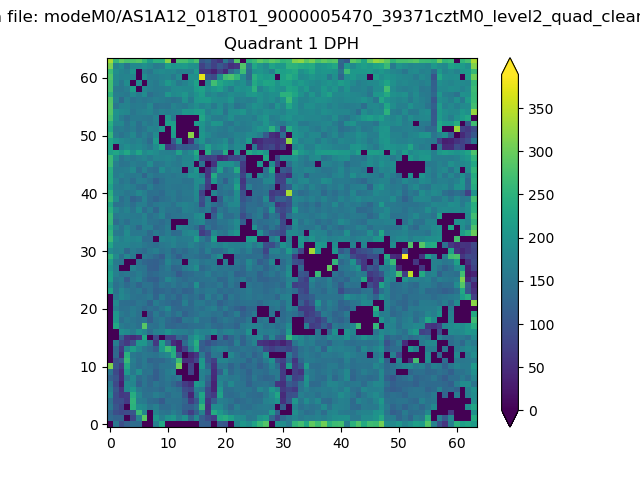 |
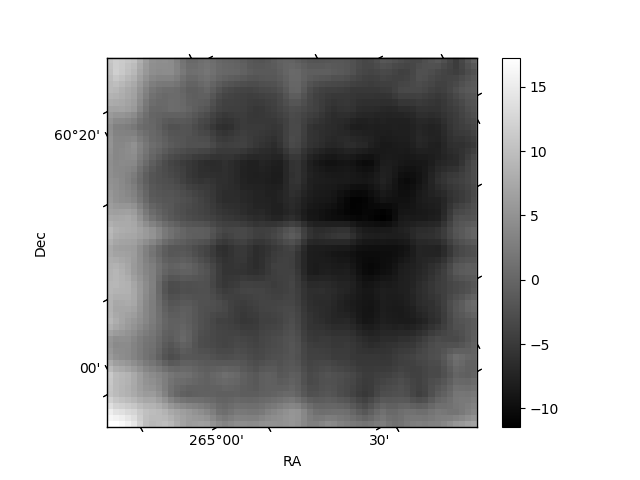
Quadrant B |
|---|---|---|---|
| Quadrant D | 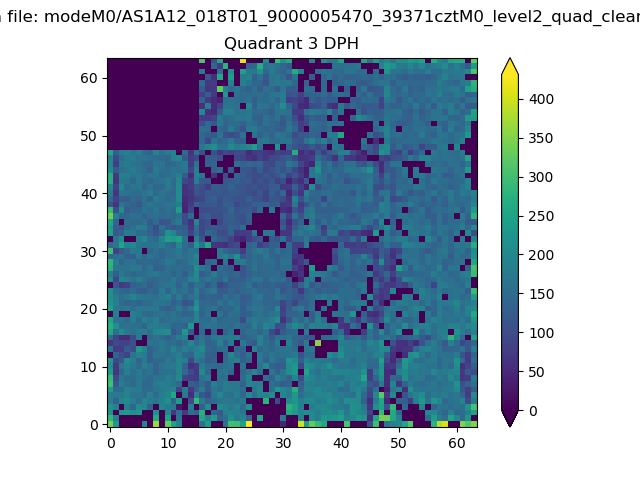 |
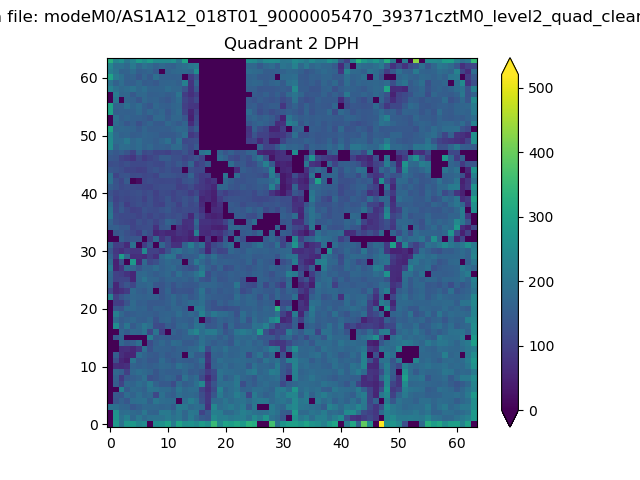 |
Quadrant C |
| Plot type | Count rate plots | Images |
|---|---|---|
| Comparison with Poisson distribution Blue bars denote a histogram of data divided into 1 sec bins. Red curve is a Poisson curve with rate = median count rate of data. |
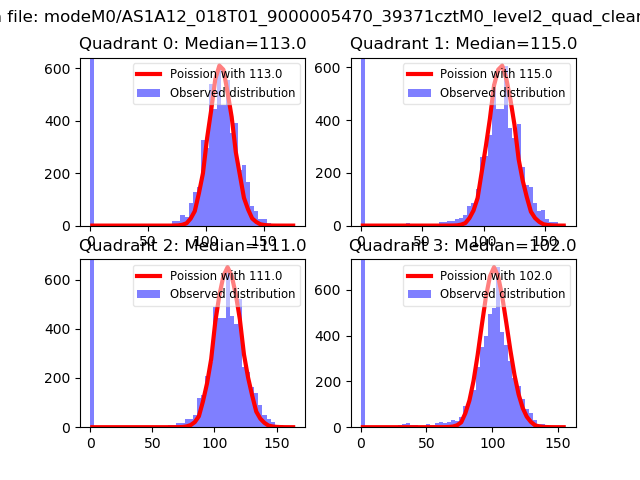 |
 |
| Quadrant-wise count rates Data is divided into 100 sec bins |
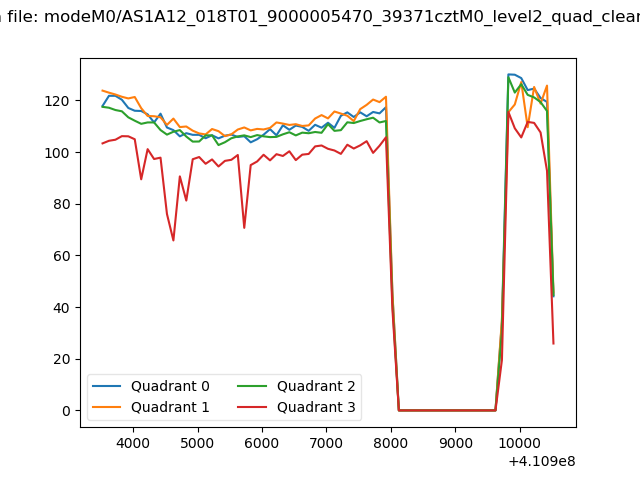 |
|
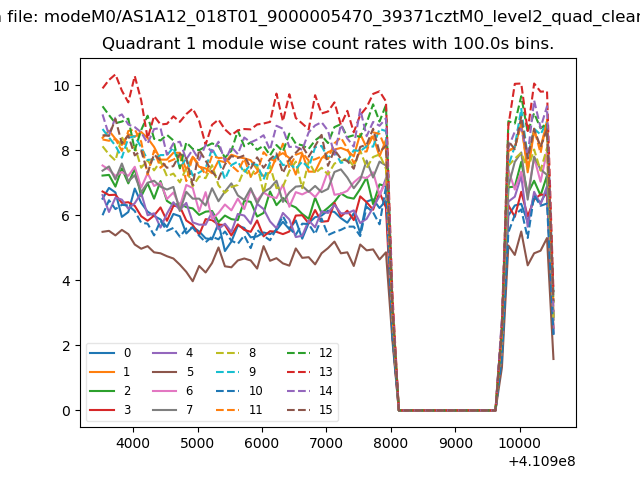
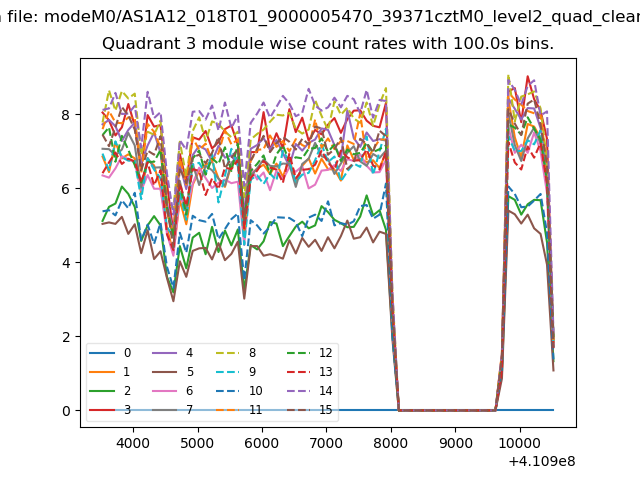
| Module-wise count rates for Quadrant A Data is divided into 100 sec bins |
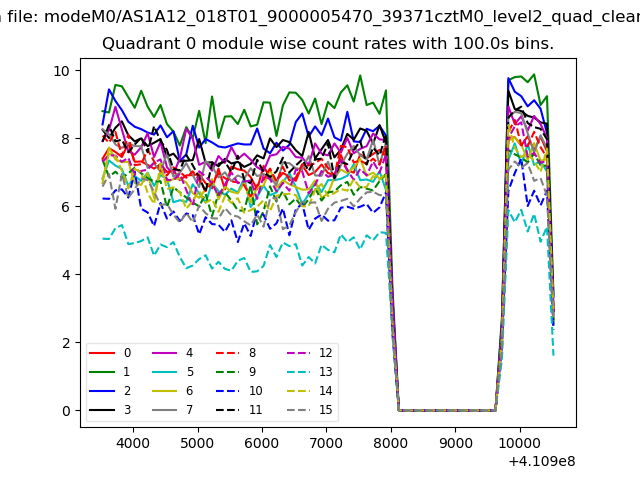 |
 |
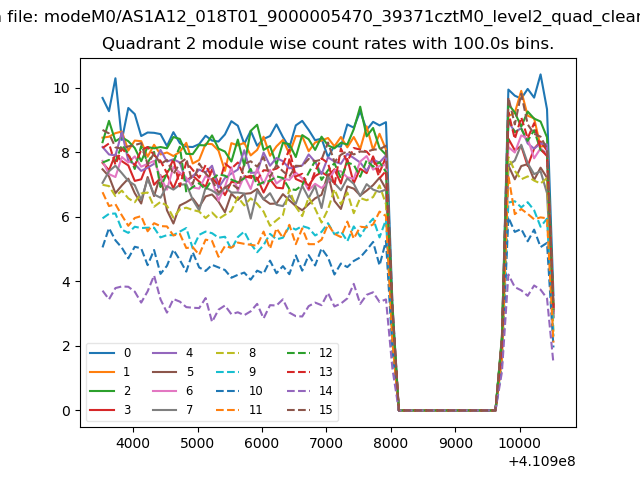
| Module-wise count rates for Quadrant B Data is divided into 100 sec bins |
 |
 |
| Module-wise count rates for Quadrant C Data is divided into 100 sec bins |
 |
 |
| Module-wise count rates for Quadrant D Data is divided into 100 sec bins |
 |
 |
| Parameter | Plot |
|---|---|
| CZT HV Monitor | 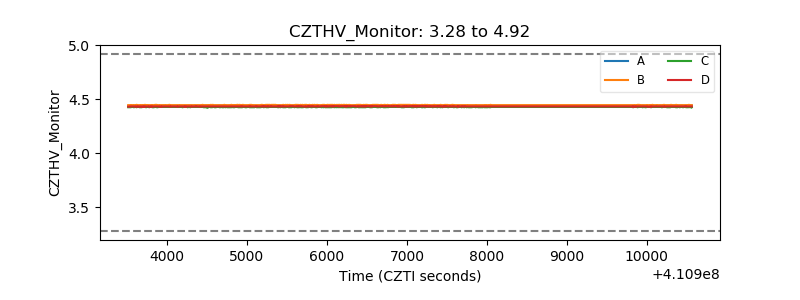 |
| D_VDD | 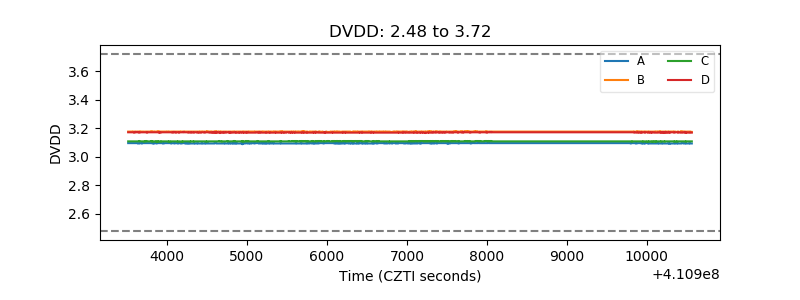 |
| Temperature 1 | 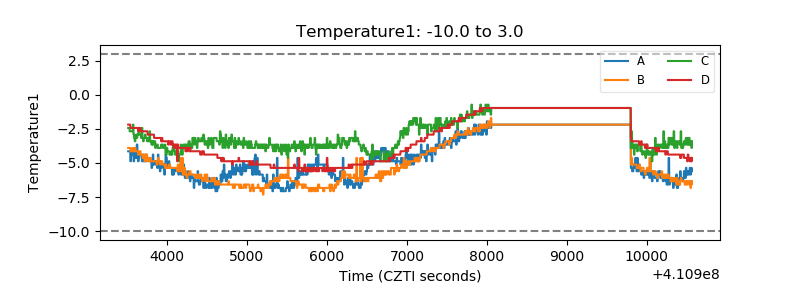 |
| Veto HV Monitor | 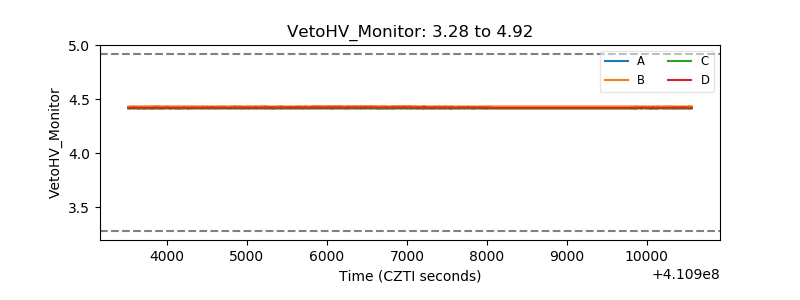 |
| Veto LLD | 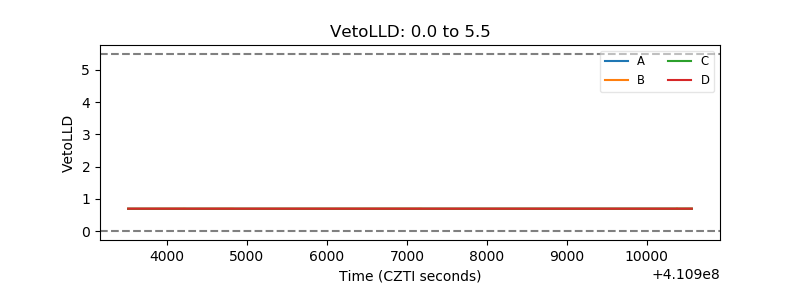 |
| Alpha Counter | 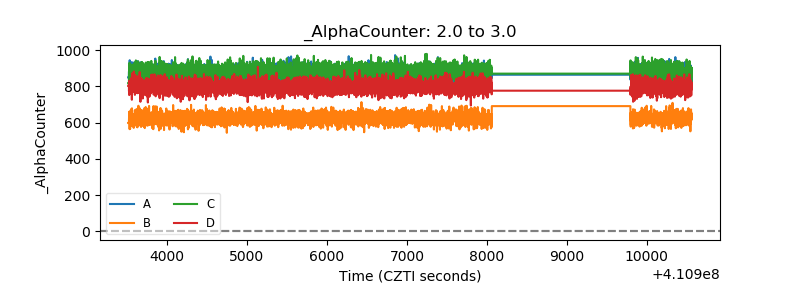 |
| _CPM_Rate | 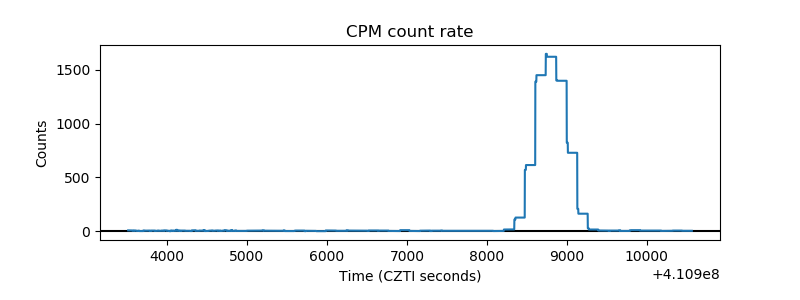 |
| CZT Counter | 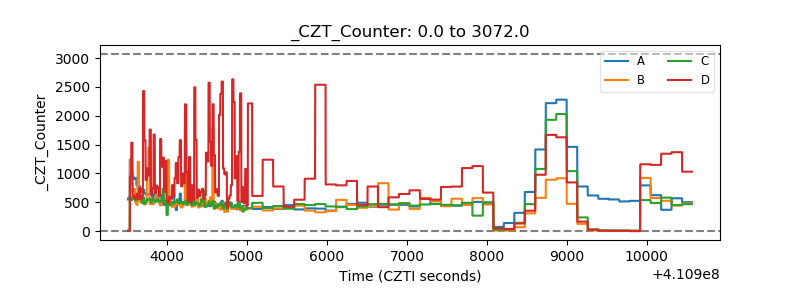 |
| +2.5 Volts monitor | 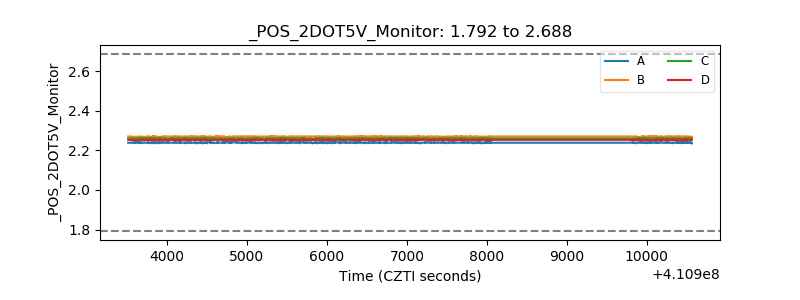 |
| +5 Volts monitor | 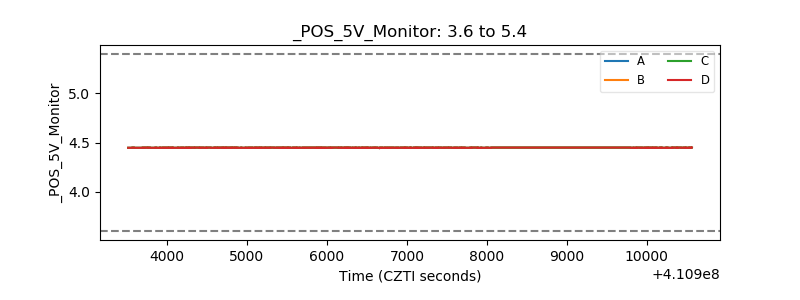 |
| _ROLL_ROT | 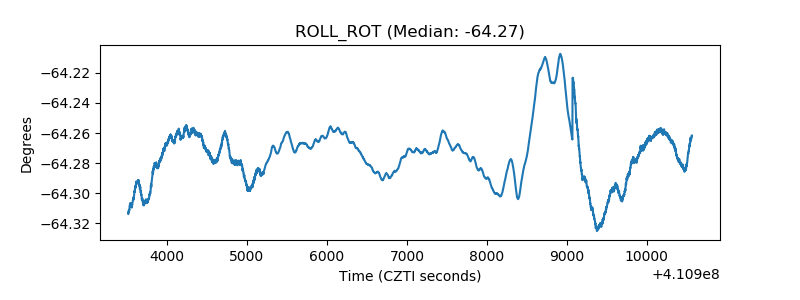 |
| _Roll_DEC | 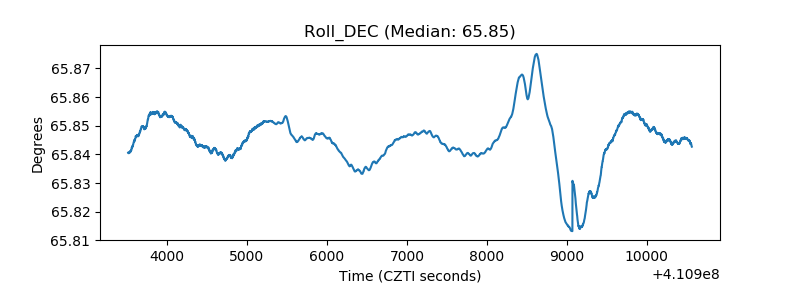 |
| _Roll_RA | 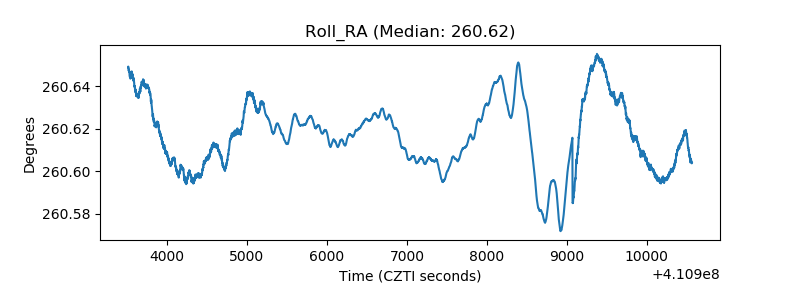 |
| Veto Counter | 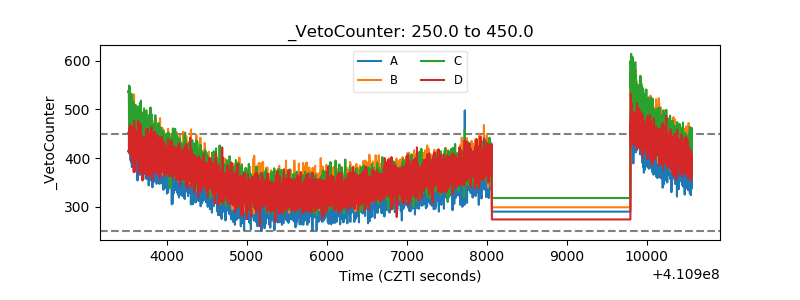 |