| Param | Original file | Final file |
|---|---|---|
| Filename | modeM0/AS1A12_018T01_9000005470_39372cztM0_level2.fits | modeM0/AS1A12_018T01_9000005470_39372cztM0_level2_quad_clean.evt |
| Size (bytes) | 369,460,800 | 94,821,120 |
| Size | 352.3 MB | 90.4 MB |
| Events in quadrant A | 2,804,309 | 640,484 |
| Events in quadrant B | 3,320,535 | 651,401 |
| Events in quadrant C | 2,807,564 | 632,572 |
| Events in quadrant D | 4,319,389 | 564,848 |
| Mode M9 | |||
|---|---|---|---|
| Quadrant | BADHDUFLAG | Total packets | Discarded packets |
| A | 0 | 28 | 0 |
| B | 0 | 28 | 0 |
| C | 0 | 28 | 0 |
| D | 0 | 29 | 0 |
| Mode SS | |||
|---|---|---|---|
| Quadrant | BADHDUFLAG | Total packets | Discarded packets |
| A | 0 | 112 | 0 |
| B | 0 | 112 | 0 |
| C | 0 | 112 | 0 |
| D | 0 | 112 | 0 |
| Mode M0 | |||
|---|---|---|---|
| Quadrant | BADHDUFLAG | Total packets | Discarded packets |
| A | 0 | 11800 | 3 |
| B | 0 | 13654 | 2 |
| C | 0 | 11793 | 2 |
| D | 0 | 16631 | 2 |
| Quadrant | Total seconds | Saturated seconds | Saturation percentage |
|---|---|---|---|
| A | 5455 | 10 | 0.183318% |
| B | 5455 | 138 | 2.529789% |
| C | 5455 | 25 | 0.458295% |
| D | 5455 | 202 | 3.703025% |
Noise dominated data is calculated using 1-second bins in cleaned event files. If a bin has >2000 counts, and if more than 50% of those come from <1% of pixels, then it is considered to be noise-dominated and hence unusable.
| Quadrant | # 1 sec bins | Bins with >0 counts | Bins with >2000 counts | High rate bins dominated by noise | Noise dominated (total time) | Noise dominated (detector-on time) | Marked lightcurve |
|---|---|---|---|---|---|---|---|
| A | 7339 | 5456 | 4 | 4 | 0.05% | 0.07% |  |
| B | 7339 | 5456 | 61 | 61 | 0.83% | 1.12% | 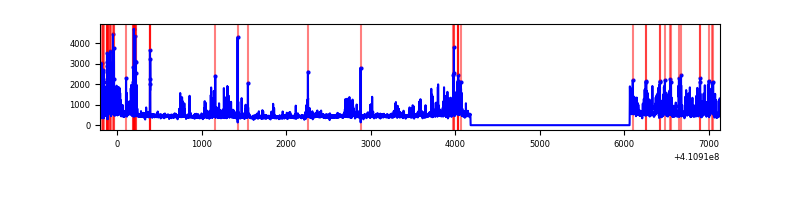 |
| C | 7339 | 5456 | 16 | 16 | 0.22% | 0.29% | 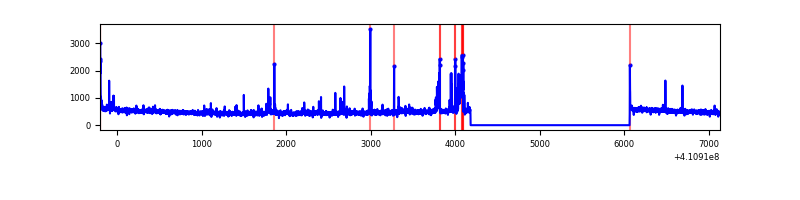 |
| D | 7339 | 5456 | 174 | 174 | 2.37% | 3.19% | 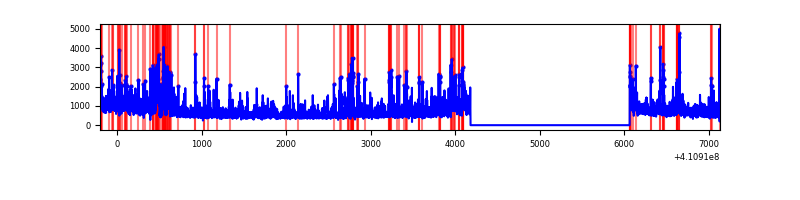 |
Top three noisy pixels from each quadrant. If the there are fewer than three noisy pixels in the level2.evt file, extra rows are filled as -1
| Pixel properties | Quadrant properties | ||||||
|---|---|---|---|---|---|---|---|
| Quadrant | DetID | PixID | Counts | Sigma | Mean | Median | Sigma |
| A | 10 | 83 | 420377 | 3412.07 | 607 | 596 | 123.0 |
| A | 13 | 248 | 18697 | 147.13 | 607 | 596 | 123.0 |
| A | 13 | 254 | 8544 | 64.6 | 607 | 596 | 123.0 |
| B | 5 | 172 | 875831 | 7544.55 | 604 | 588 | 116.0 |
| B | 5 | 255 | 43716 | 371.76 | 604 | 588 | 116.0 |
| B | 12 | 111 | 14691 | 121.57 | 604 | 588 | 116.0 |
| C | 15 | 214 | 230726 | 1656.03 | 596 | 600 | 139.0 |
| C | 14 | 254 | 152387 | 1092.29 | 596 | 600 | 139.0 |
| C | 3 | 110 | 39846 | 282.42 | 596 | 600 | 139.0 |
| D | 12 | 235 | 1552555 | 11020.95 | 582 | 564 | 140.8 |
| D | 13 | 249 | 368986 | 2616.23 | 582 | 564 | 140.8 |
| D | 2 | 249 | 141351 | 999.75 | 582 | 564 | 140.8 |
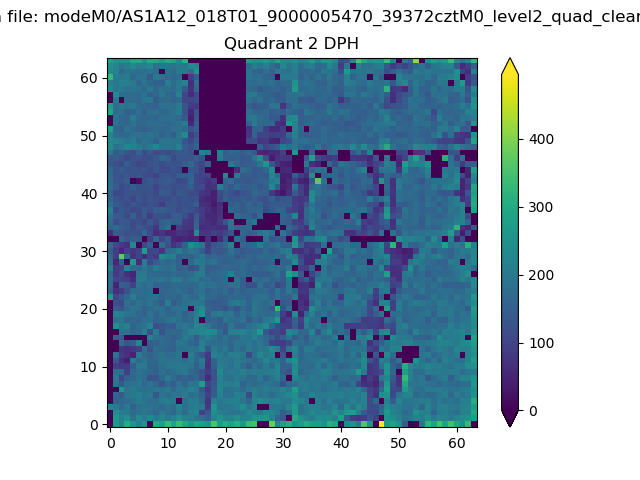
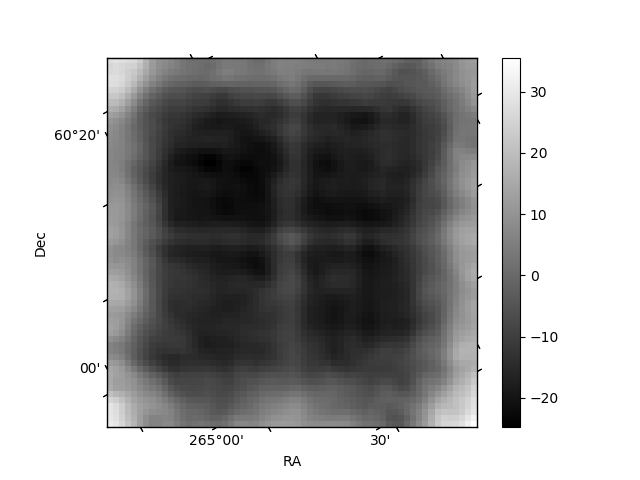
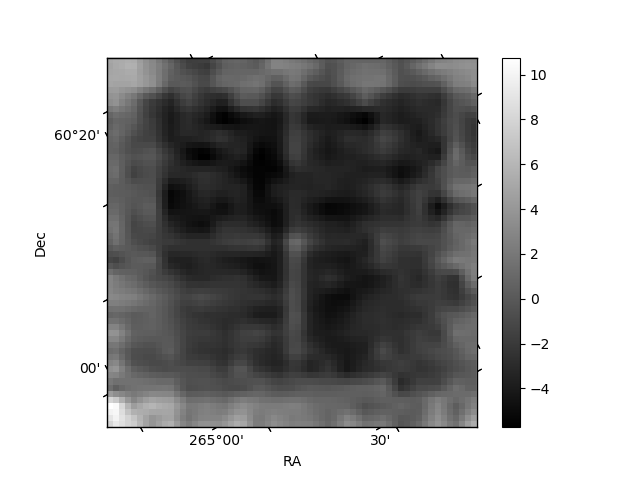
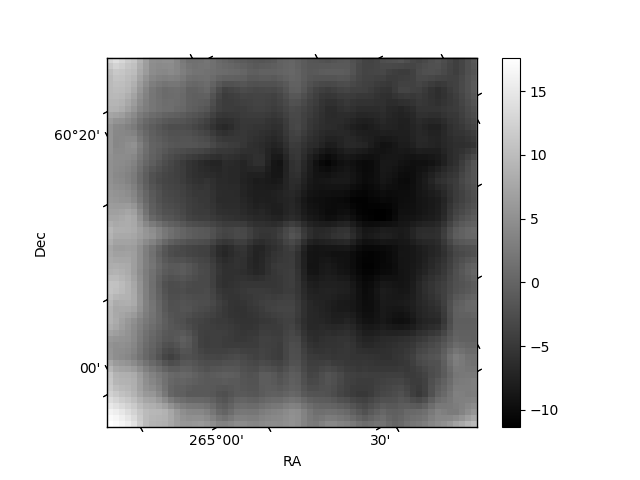
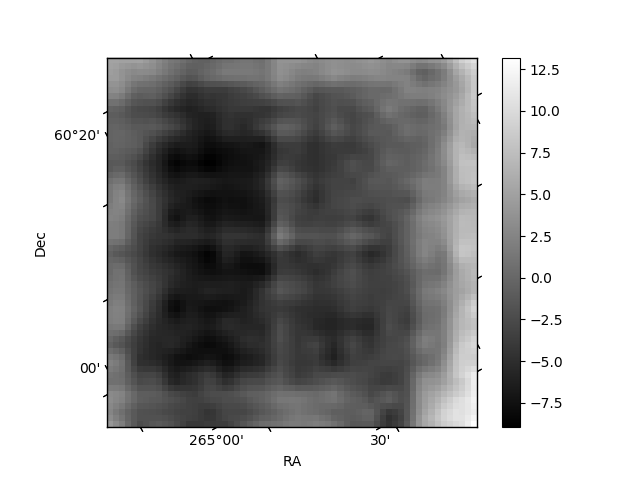
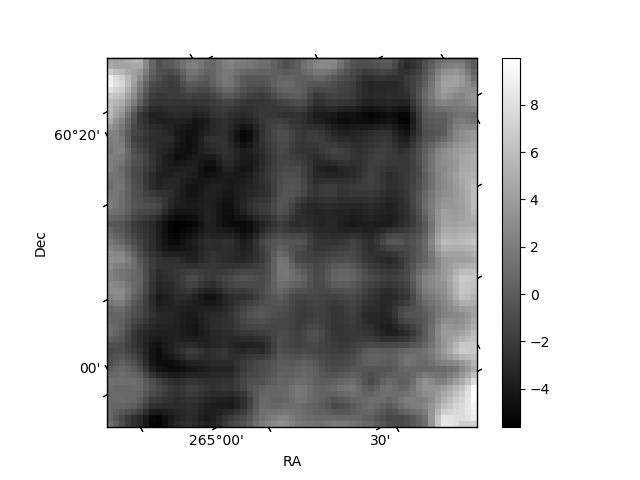
Histogram calculated using DETX and DETY for each event in the final _common_clean file
| Quadrant A | 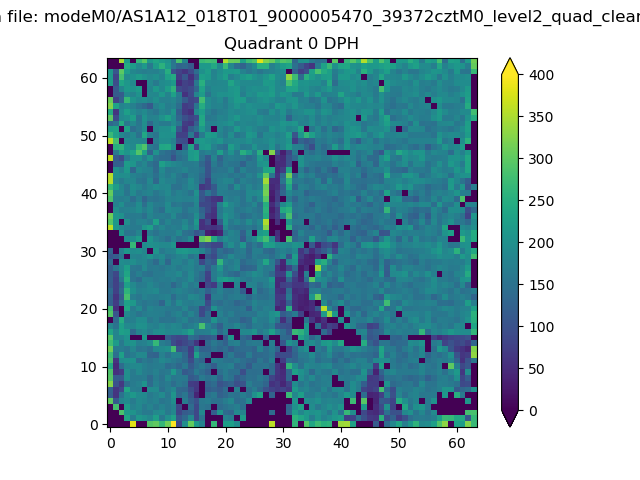 |
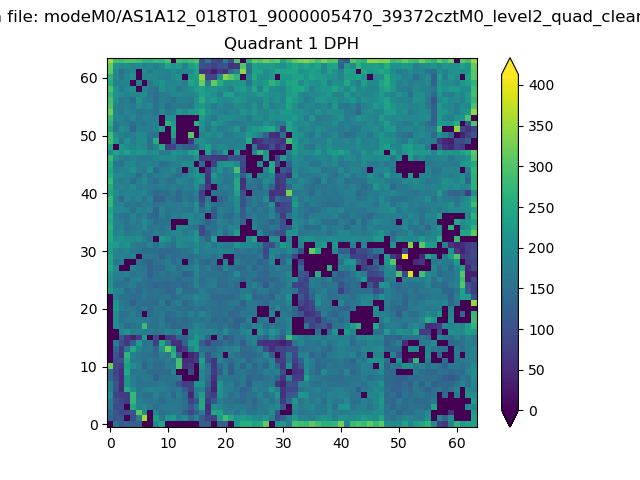 |
Quadrant B |
|---|---|---|---|
| Quadrant D | 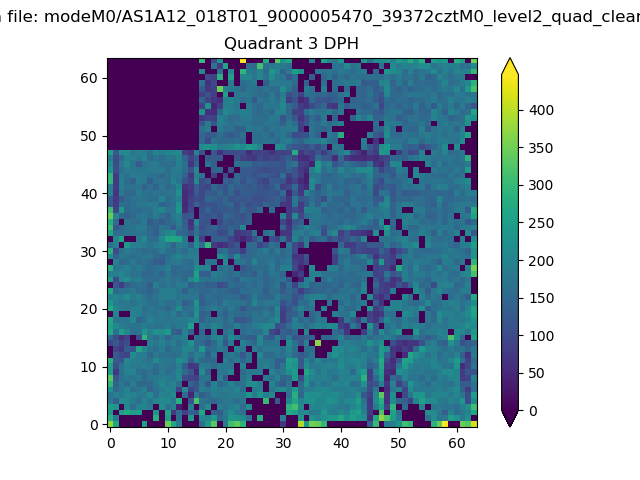 |
 |
Quadrant C |
| Plot type | Count rate plots | Images |
|---|---|---|
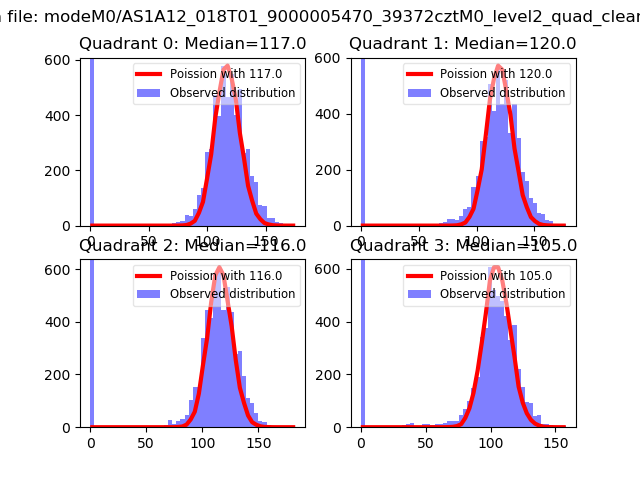
| Comparison with Poisson distribution Blue bars denote a histogram of data divided into 1 sec bins. Red curve is a Poisson curve with rate = median count rate of data. |
 |
 |
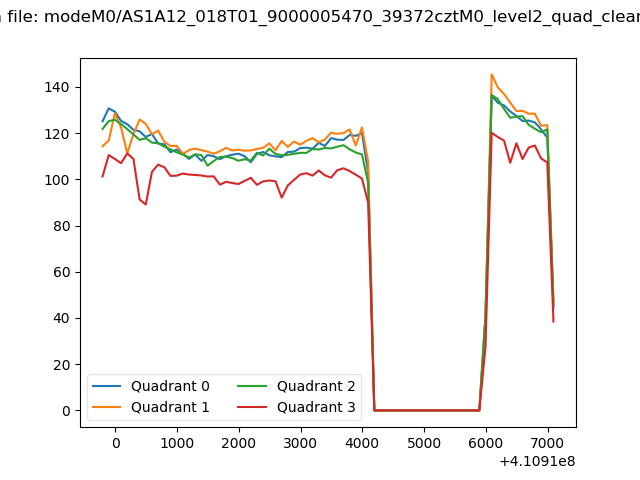
| Quadrant-wise count rates Data is divided into 100 sec bins |
 |
|
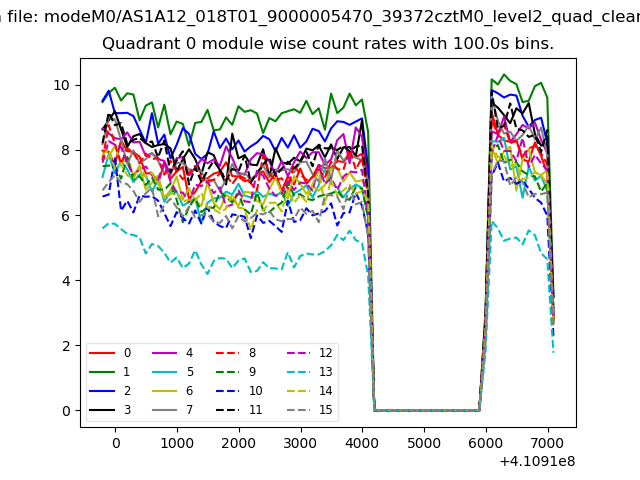
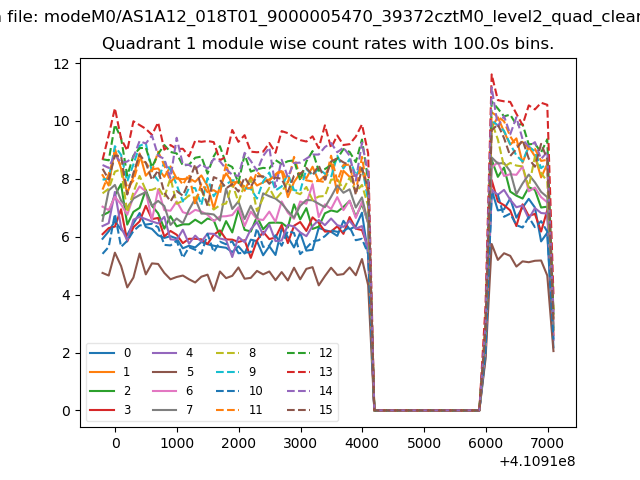
| Module-wise count rates for Quadrant A Data is divided into 100 sec bins |
 |
 |
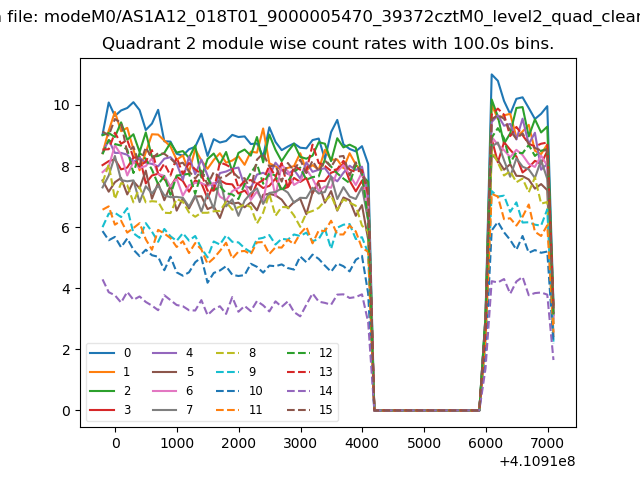
| Module-wise count rates for Quadrant B Data is divided into 100 sec bins |
 |
 |
| Module-wise count rates for Quadrant C Data is divided into 100 sec bins |
 |
 |
| Module-wise count rates for Quadrant D Data is divided into 100 sec bins |
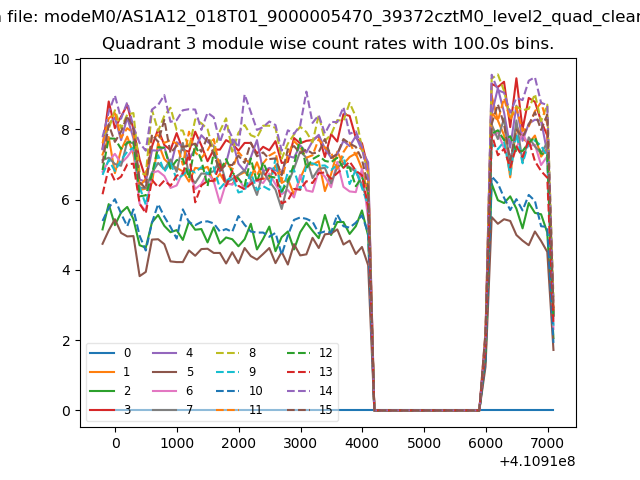 |
 |
| Parameter | Plot |
|---|---|
| CZT HV Monitor | 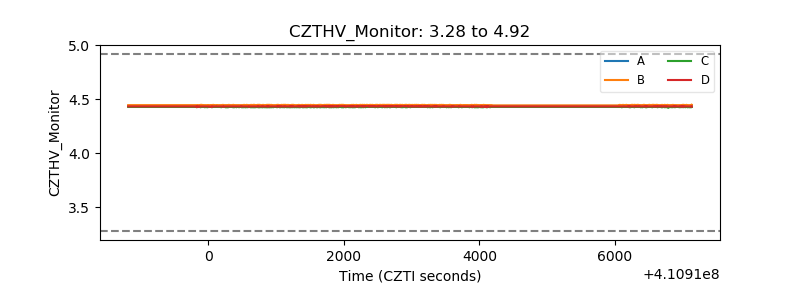 |
| D_VDD | 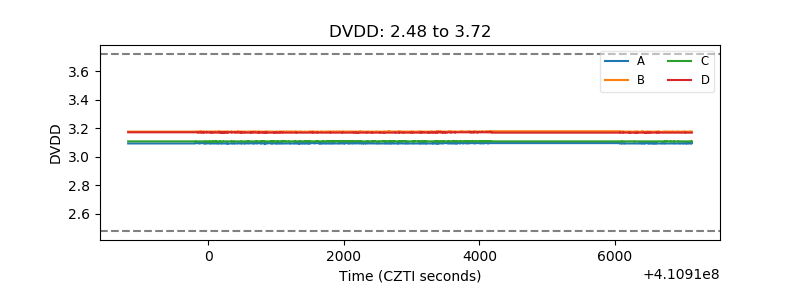 |
| Temperature 1 | 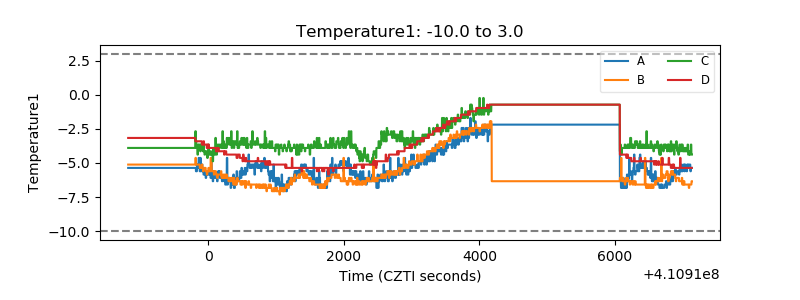 |
| Veto HV Monitor | 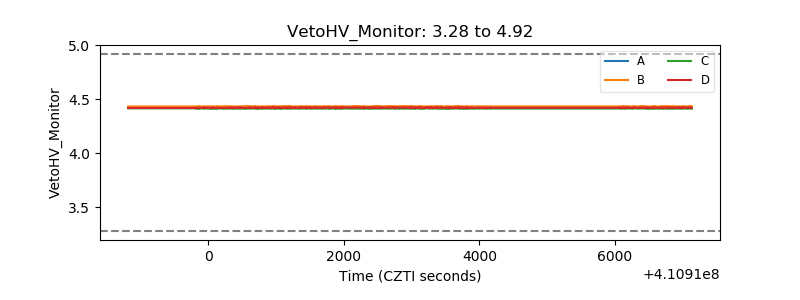 |
| Veto LLD | 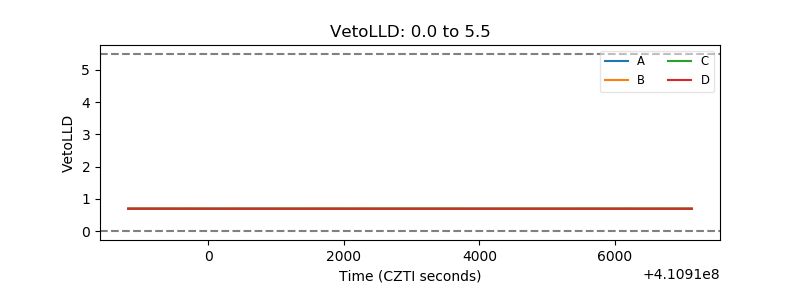 |
| Alpha Counter | 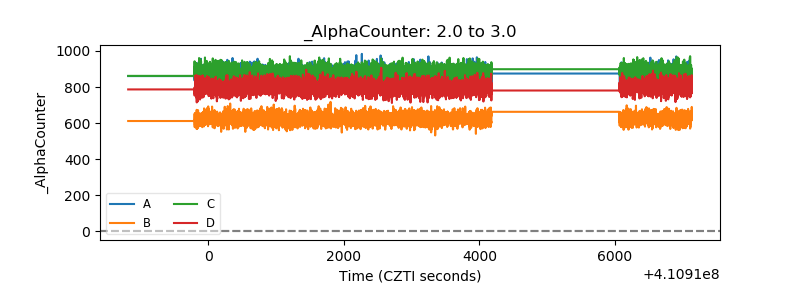 |
| _CPM_Rate | 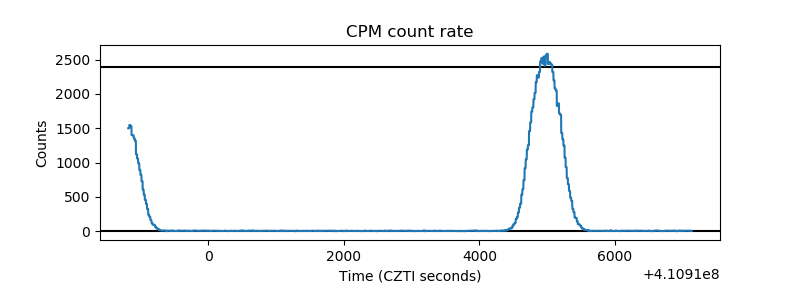 |
| CZT Counter | 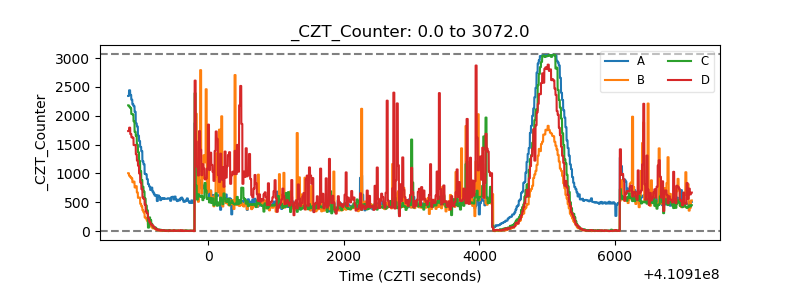 |
| +2.5 Volts monitor | 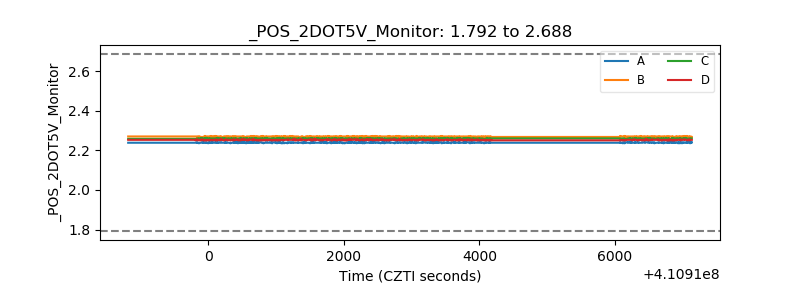 |
| +5 Volts monitor | 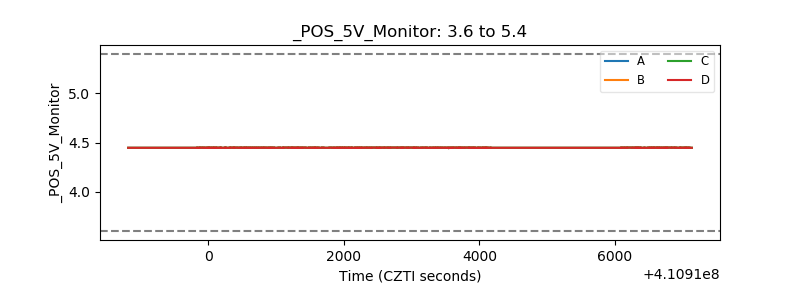 |
| _ROLL_ROT | 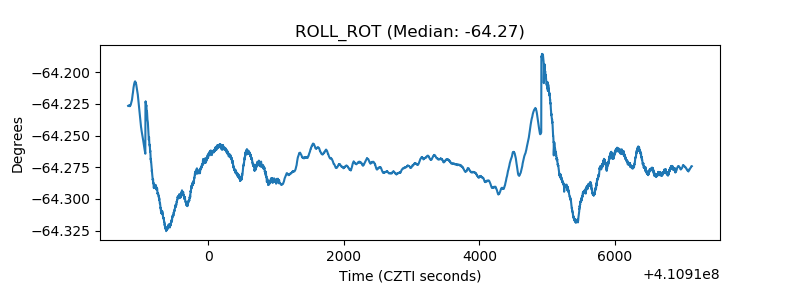 |
| _Roll_DEC | 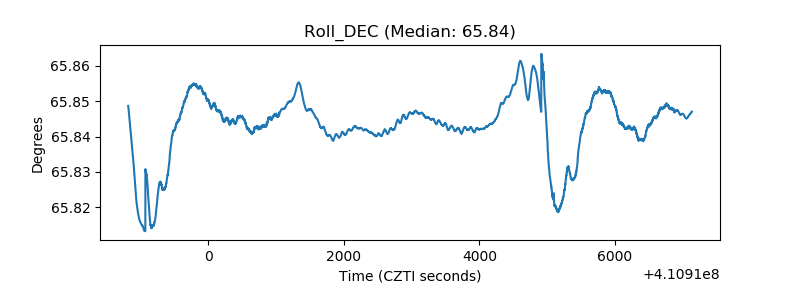 |
| _Roll_RA | 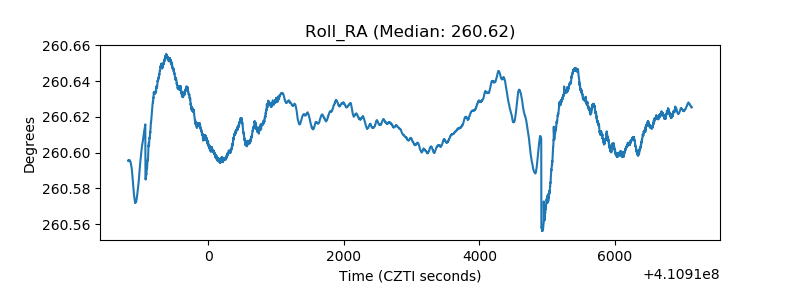 |
| Veto Counter | 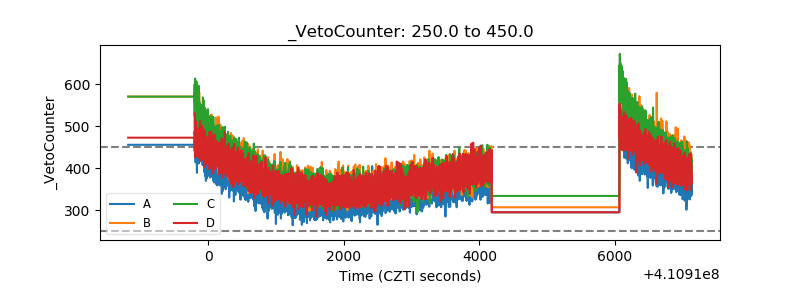 |