| Param | Original file | Final file |
|---|---|---|
| Filename | modeM0/AS1A12_018T01_9000005470_39373cztM0_level2.fits | modeM0/AS1A12_018T01_9000005470_39373cztM0_level2_quad_clean.evt |
| Size (bytes) | 409,236,480 | 92,361,600 |
| Size | 390.3 MB | 88.1 MB |
| Events in quadrant A | 2,787,553 | 645,617 |
| Events in quadrant B | 3,166,019 | 664,737 |
| Events in quadrant C | 2,551,868 | 633,043 |
| Events in quadrant D | 6,231,250 | 482,581 |
| Mode M9 | |||
|---|---|---|---|
| Quadrant | BADHDUFLAG | Total packets | Discarded packets |
| A | 0 | 29 | 0 |
| B | 0 | 29 | 0 |
| C | 0 | 29 | 0 |
| D | 0 | 30 | 0 |
| Mode SS | |||
|---|---|---|---|
| Quadrant | BADHDUFLAG | Total packets | Discarded packets |
| A | 0 | 108 | 0 |
| B | 0 | 108 | 0 |
| C | 0 | 108 | 0 |
| D | 0 | 108 | 0 |
| Mode M0 | |||
|---|---|---|---|
| Quadrant | BADHDUFLAG | Total packets | Discarded packets |
| A | 0 | 11552 | 3 |
| B | 0 | 12946 | 2 |
| C | 0 | 10830 | 2 |
| D | 0 | 22168 | 2 |
| Quadrant | Total seconds | Saturated seconds | Saturation percentage |
|---|---|---|---|
| A | 5295 | 10 | 0.188857% |
| B | 5295 | 78 | 1.473088% |
| C | 5295 | 6 | 0.113314% |
| D | 5295 | 1079 | 20.377715% |
Noise dominated data is calculated using 1-second bins in cleaned event files. If a bin has >2000 counts, and if more than 50% of those come from <1% of pixels, then it is considered to be noise-dominated and hence unusable.
| Quadrant | # 1 sec bins | Bins with >0 counts | Bins with >2000 counts | High rate bins dominated by noise | Noise dominated (total time) | Noise dominated (detector-on time) | Marked lightcurve |
|---|---|---|---|---|---|---|---|
| A | 7299 | 5296 | 4 | 4 | 0.05% | 0.08% | 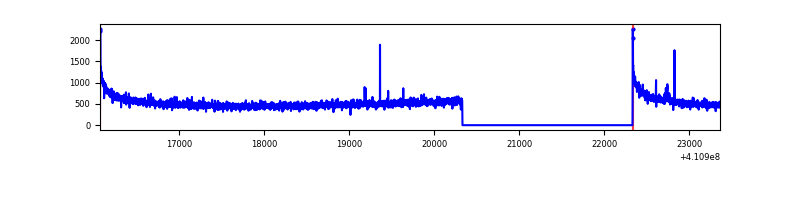 |
| B | 7299 | 5296 | 40 | 40 | 0.55% | 0.76% | 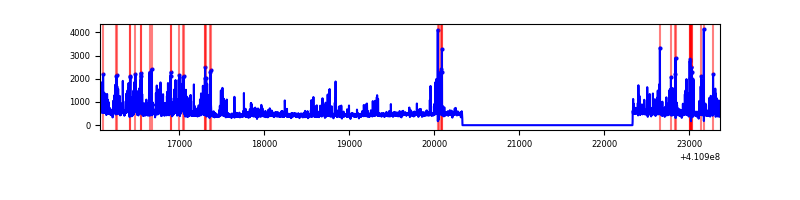 |
| C | 7299 | 5296 | 1 | 1 | 0.01% | 0.02% | 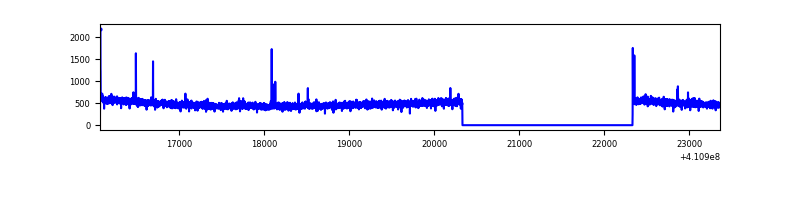 |
| D | 7299 | 5296 | 893 | 893 | 12.23% | 16.86% | 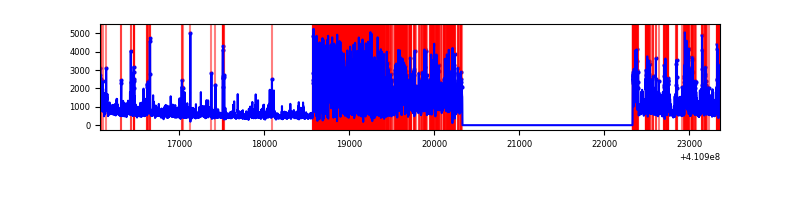 |
Top three noisy pixels from each quadrant. If the there are fewer than three noisy pixels in the level2.evt file, extra rows are filled as -1
| Pixel properties | Quadrant properties | ||||||
|---|---|---|---|---|---|---|---|
| Quadrant | DetID | PixID | Counts | Sigma | Mean | Median | Sigma |
| A | 10 | 83 | 418966 | 3469.07 | 600 | 588 | 120.6 |
| A | 13 | 6 | 17416 | 139.53 | 600 | 588 | 120.6 |
| A | 15 | 174 | 13387 | 106.13 | 600 | 588 | 120.6 |
| B | 5 | 172 | 776920 | 6875.55 | 598 | 584 | 112.9 |
| B | 4 | 170 | 19727 | 169.54 | 598 | 584 | 112.9 |
| B | 12 | 111 | 13961 | 118.47 | 598 | 584 | 112.9 |
| C | 15 | 214 | 223275 | 1641.98 | 584 | 587 | 135.6 |
| C | 14 | 254 | 22966 | 165.01 | 584 | 587 | 135.6 |
| C | 3 | 233 | 17747 | 126.53 | 584 | 587 | 135.6 |
| D | 12 | 235 | 3711343 | 28655.81 | 525 | 510 | 129.5 |
| D | 13 | 249 | 453139 | 3495.29 | 525 | 510 | 129.5 |
| D | 2 | 249 | 35666 | 271.48 | 525 | 510 | 129.5 |
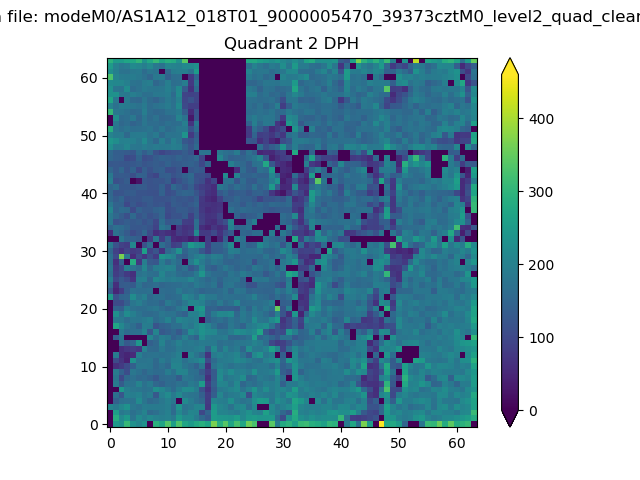
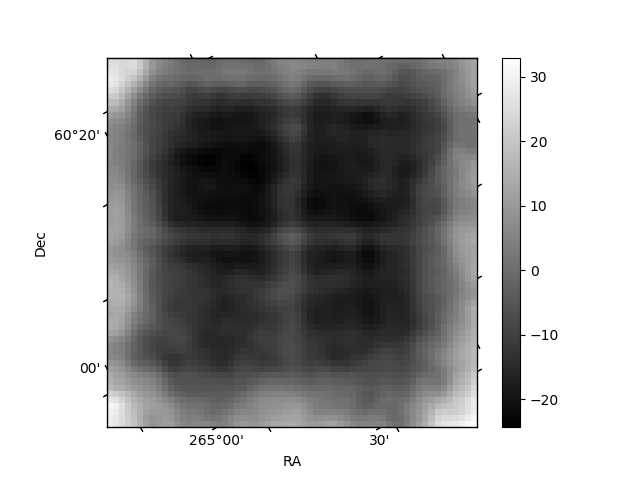
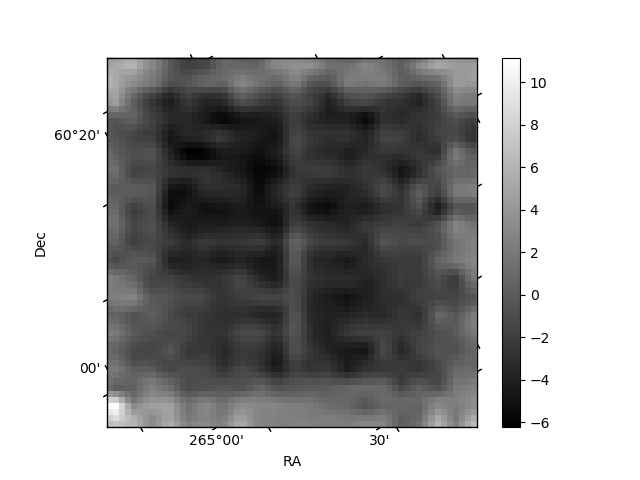
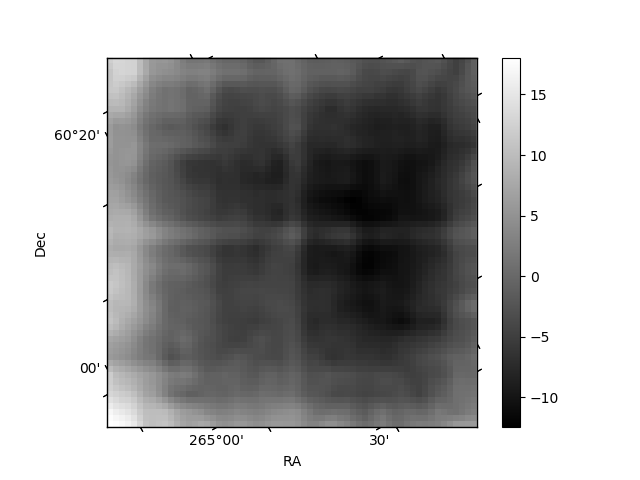
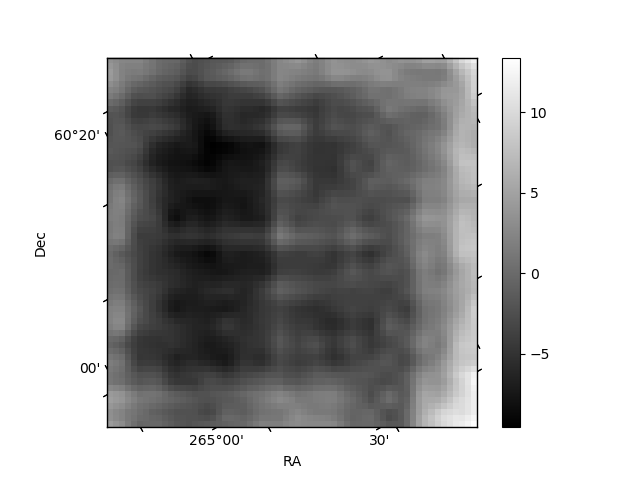
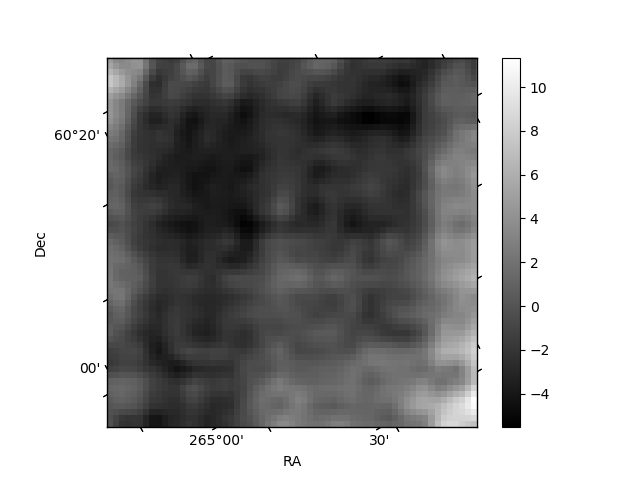
Histogram calculated using DETX and DETY for each event in the final _common_clean file
| Quadrant A | 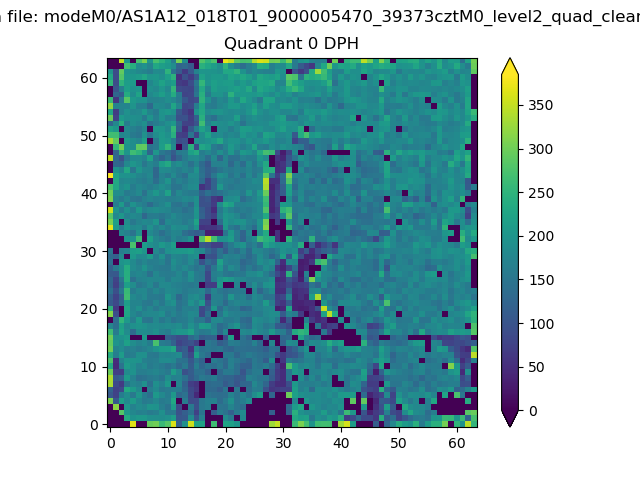 |
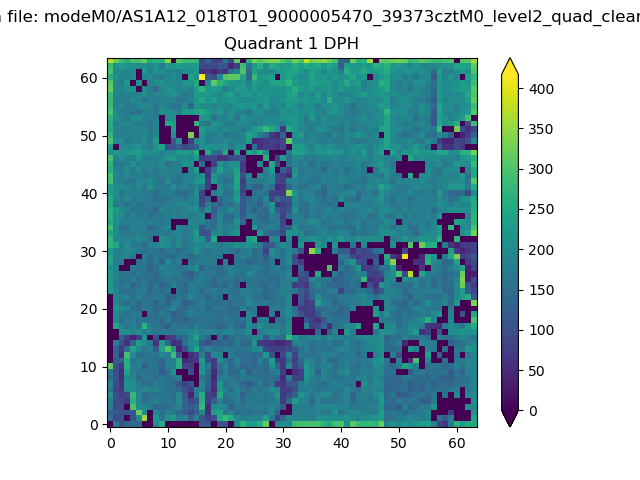 |
Quadrant B |
|---|---|---|---|
| Quadrant D | 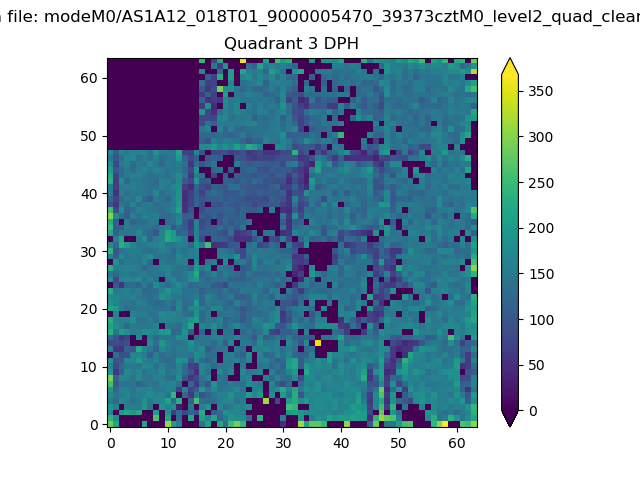 |
 |
Quadrant C |
| Plot type | Count rate plots | Images |
|---|---|---|
| Comparison with Poisson distribution Blue bars denote a histogram of data divided into 1 sec bins. Red curve is a Poisson curve with rate = median count rate of data. |
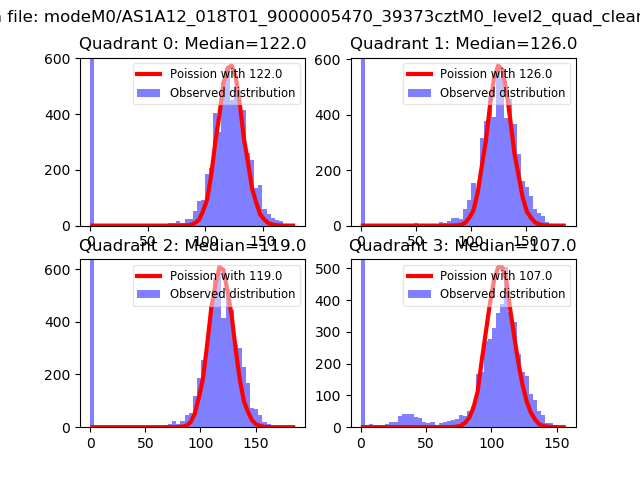 |
 |
| Quadrant-wise count rates Data is divided into 100 sec bins |
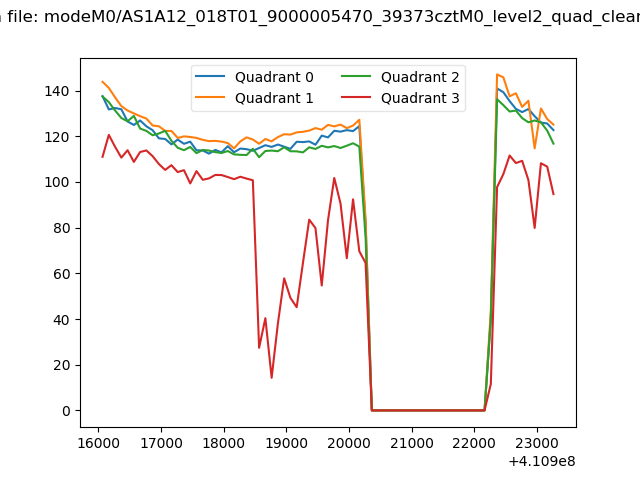 |
|
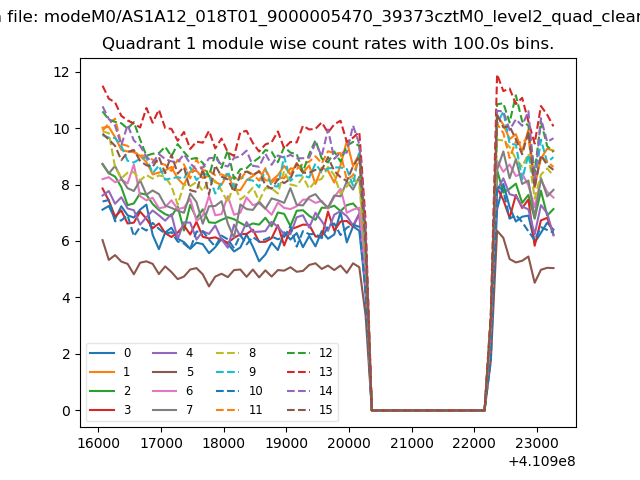
| Module-wise count rates for Quadrant A Data is divided into 100 sec bins |
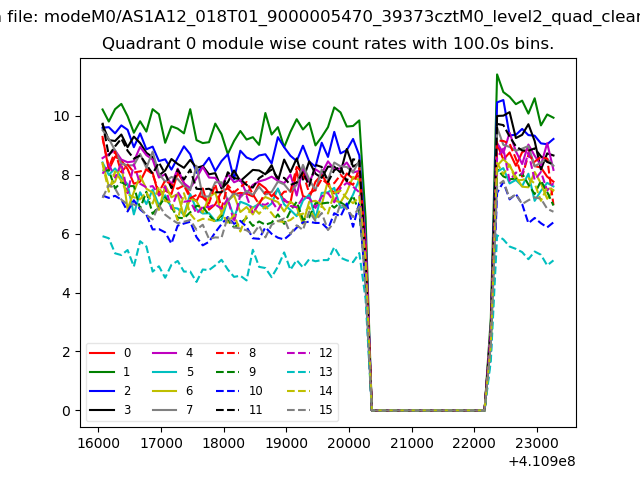 |
 |
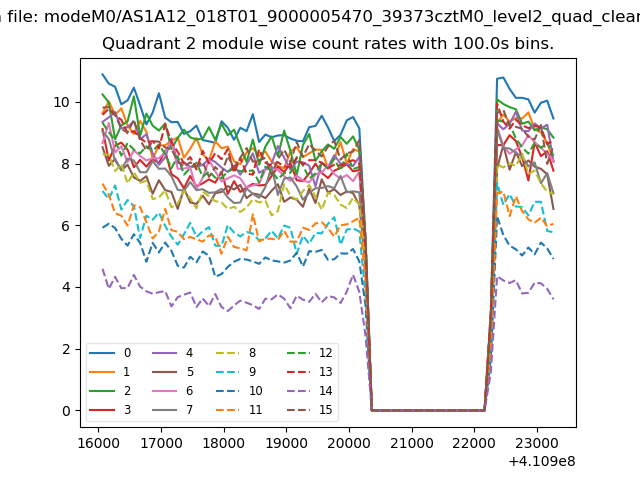
| Module-wise count rates for Quadrant B Data is divided into 100 sec bins |
 |
 |
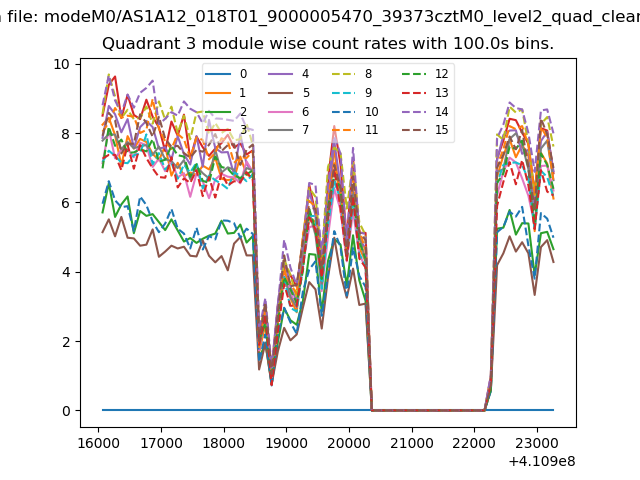
| Module-wise count rates for Quadrant C Data is divided into 100 sec bins |
 |
 |
| Module-wise count rates for Quadrant D Data is divided into 100 sec bins |
 |
 |
| Parameter | Plot |
|---|---|
| CZT HV Monitor | 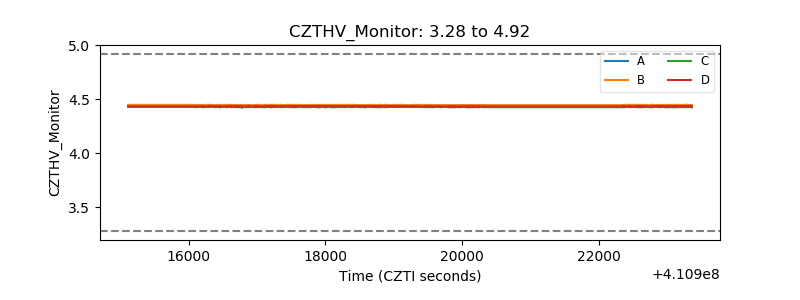 |
| D_VDD | 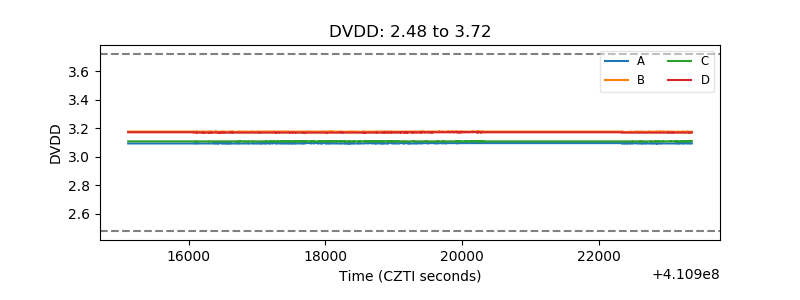 |
| Temperature 1 | 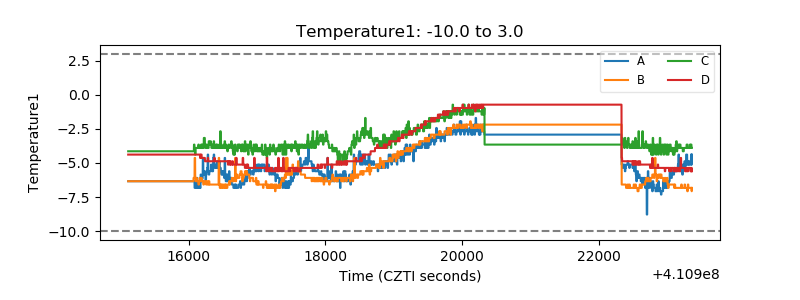 |
| Veto HV Monitor | 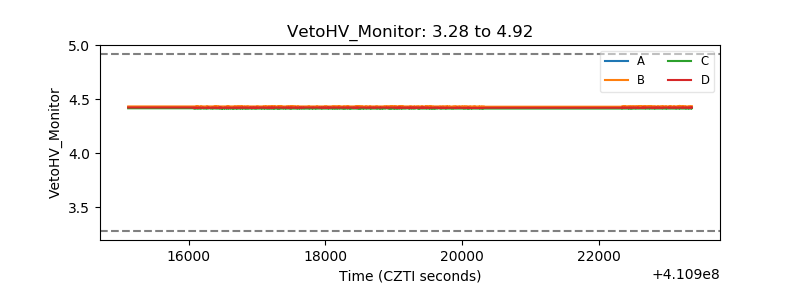 |
| Veto LLD | 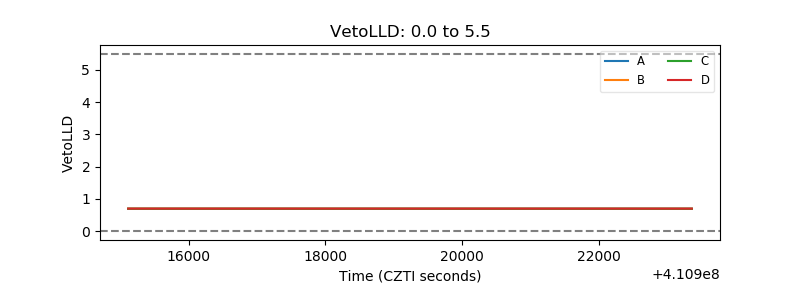 |
| Alpha Counter | 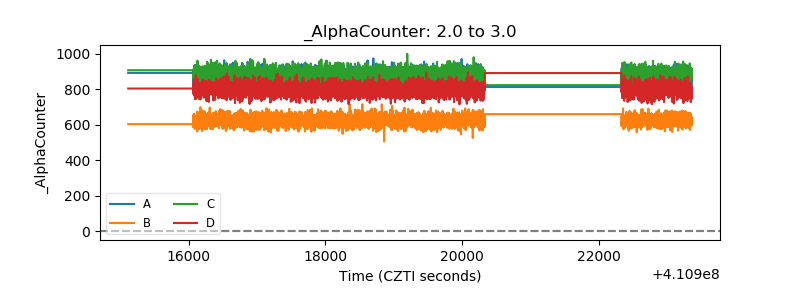 |
| _CPM_Rate | 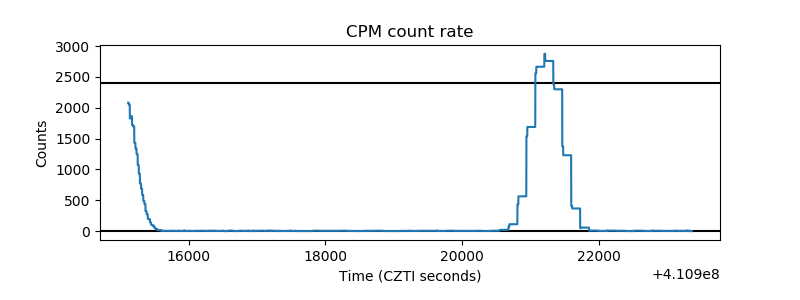 |
| CZT Counter | 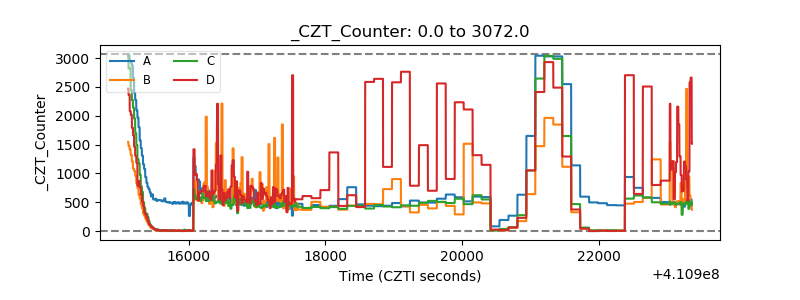 |
| +2.5 Volts monitor | 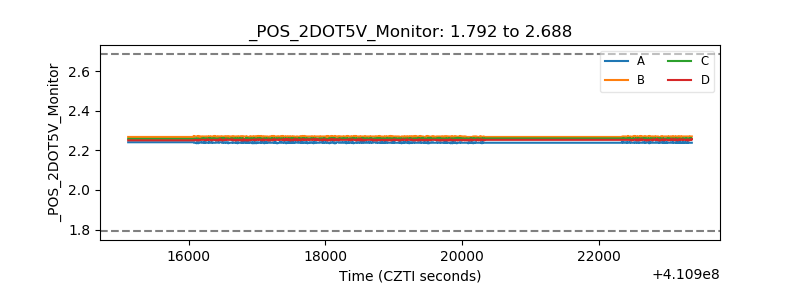 |
| +5 Volts monitor | 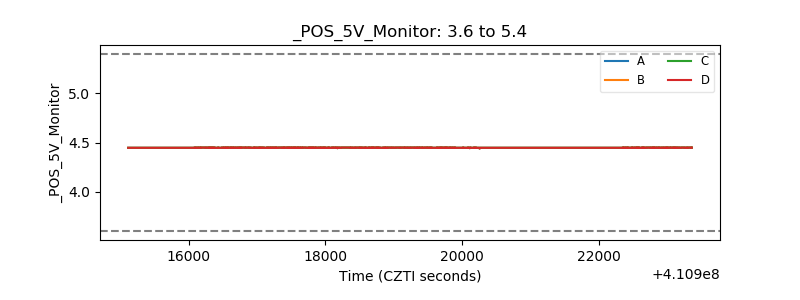 |
| _ROLL_ROT | 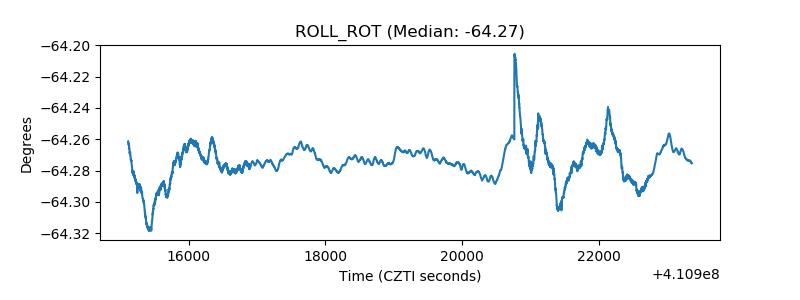 |
| _Roll_DEC | 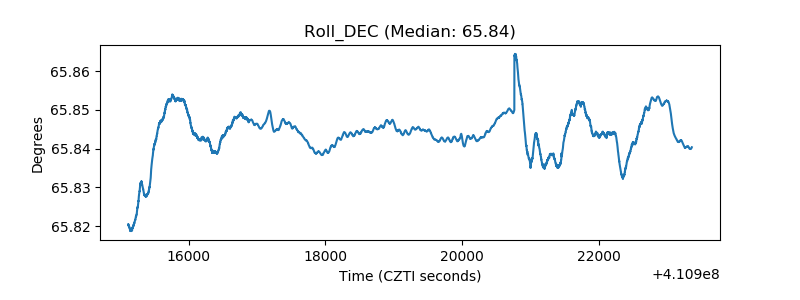 |
| _Roll_RA | 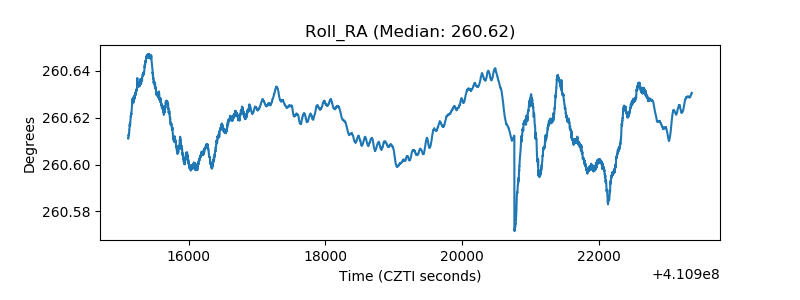 |
| Veto Counter | 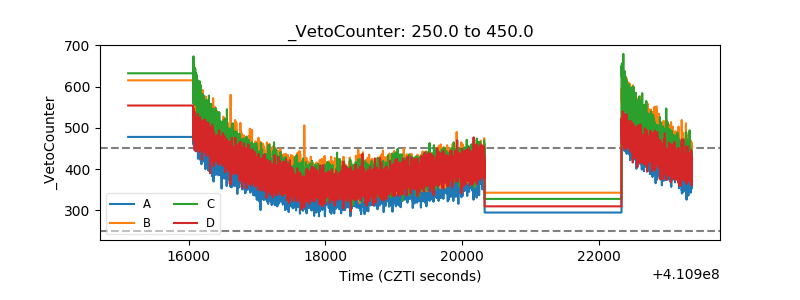 |