| Param | Original file | Final file |
|---|---|---|
| Filename | modeM0/AS1A12_018T01_9000005470_39374cztM0_level2.fits | modeM0/AS1A12_018T01_9000005470_39374cztM0_level2_quad_clean.evt |
| Size (bytes) | 435,248,640 | 88,908,480 |
| Size | 415.1 MB | 84.8 MB |
| Events in quadrant A | 2,732,009 | 639,514 |
| Events in quadrant B | 3,346,765 | 643,973 |
| Events in quadrant C | 2,619,538 | 615,548 |
| Events in quadrant D | 7,013,018 | 433,133 |
| Mode M9 | |||
|---|---|---|---|
| Quadrant | BADHDUFLAG | Total packets | Discarded packets |
| A | 0 | 30 | 0 |
| B | 0 | 30 | 0 |
| C | 0 | 30 | 0 |
| D | 0 | 31 | 0 |
| Mode SS | |||
|---|---|---|---|
| Quadrant | BADHDUFLAG | Total packets | Discarded packets |
| A | 0 | 104 | 0 |
| B | 0 | 104 | 0 |
| C | 0 | 104 | 0 |
| D | 0 | 104 | 0 |
| Mode M0 | |||
|---|---|---|---|
| Quadrant | BADHDUFLAG | Total packets | Discarded packets |
| A | 0 | 11263 | 3 |
| B | 0 | 13478 | 2 |
| C | 0 | 10968 | 2 |
| D | 0 | 24438 | 2 |
| Quadrant | Total seconds | Saturated seconds | Saturation percentage |
|---|---|---|---|
| A | 5144 | 18 | 0.349922% |
| B | 5144 | 202 | 3.926905% |
| C | 5144 | 22 | 0.427683% |
| D | 5144 | 1400 | 27.216174% |
Noise dominated data is calculated using 1-second bins in cleaned event files. If a bin has >2000 counts, and if more than 50% of those come from <1% of pixels, then it is considered to be noise-dominated and hence unusable.
| Quadrant | # 1 sec bins | Bins with >0 counts | Bins with >2000 counts | High rate bins dominated by noise | Noise dominated (total time) | Noise dominated (detector-on time) | Marked lightcurve |
|---|---|---|---|---|---|---|---|
| A | 7237 | 5145 | 6 | 6 | 0.08% | 0.12% | 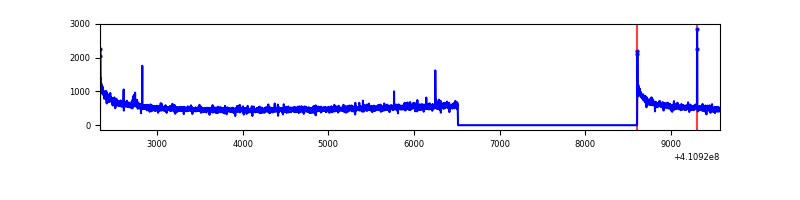 |
| B | 7237 | 5145 | 115 | 115 | 1.59% | 2.24% | 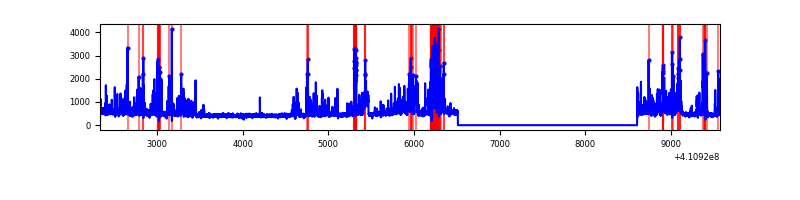 |
| C | 7237 | 5145 | 10 | 10 | 0.14% | 0.19% | 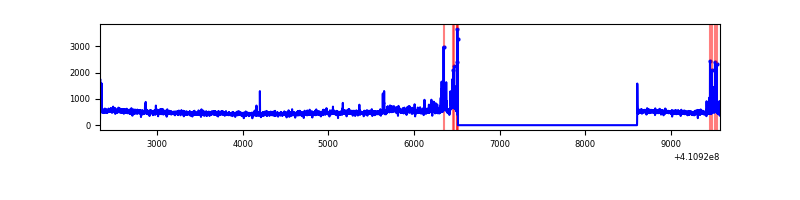 |
| D | 7237 | 5144 | 1193 | 1193 | 16.48% | 23.19% | 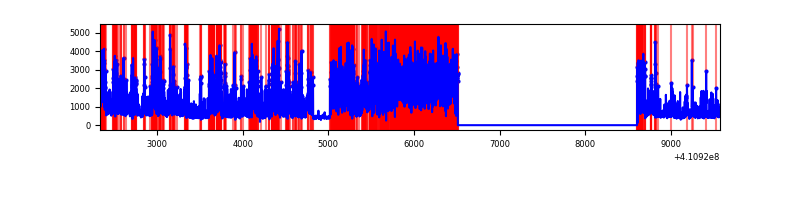 |
Top three noisy pixels from each quadrant. If the there are fewer than three noisy pixels in the level2.evt file, extra rows are filled as -1
| Pixel properties | Quadrant properties | ||||||
|---|---|---|---|---|---|---|---|
| Quadrant | DetID | PixID | Counts | Sigma | Mean | Median | Sigma |
| A | 10 | 83 | 418274 | 3539.52 | 586 | 577 | 118.0 |
| A | 15 | 174 | 13306 | 107.86 | 586 | 577 | 118.0 |
| A | 13 | 248 | 8336 | 65.75 | 586 | 577 | 118.0 |
| B | 5 | 172 | 575604 | 5268.25 | 577 | 562 | 109.2 |
| B | 5 | 200 | 399558 | 3655.4 | 577 | 562 | 109.2 |
| B | 5 | 255 | 84150 | 765.79 | 577 | 562 | 109.2 |
| C | 15 | 214 | 218236 | 1658.16 | 566 | 571 | 131.3 |
| C | 14 | 254 | 124882 | 946.99 | 566 | 571 | 131.3 |
| C | 9 | 187 | 55193 | 416.11 | 566 | 571 | 131.3 |
| D | 12 | 235 | 4773612 | 39170.32 | 495 | 479 | 121.9 |
| D | 13 | 249 | 201463 | 1649.36 | 495 | 479 | 121.9 |
| D | 2 | 249 | 128555 | 1051.05 | 495 | 479 | 121.9 |
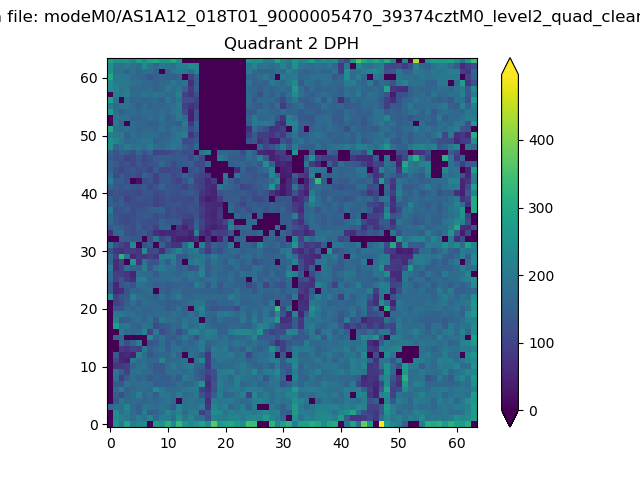
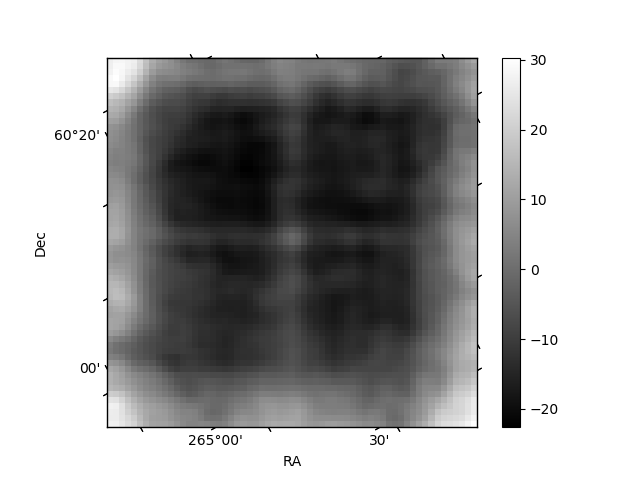
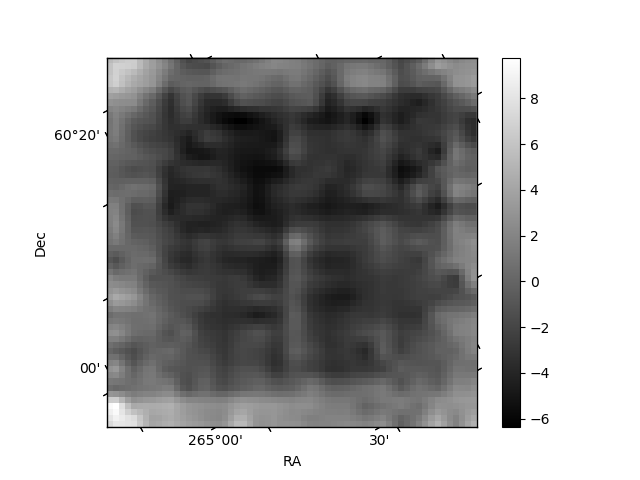
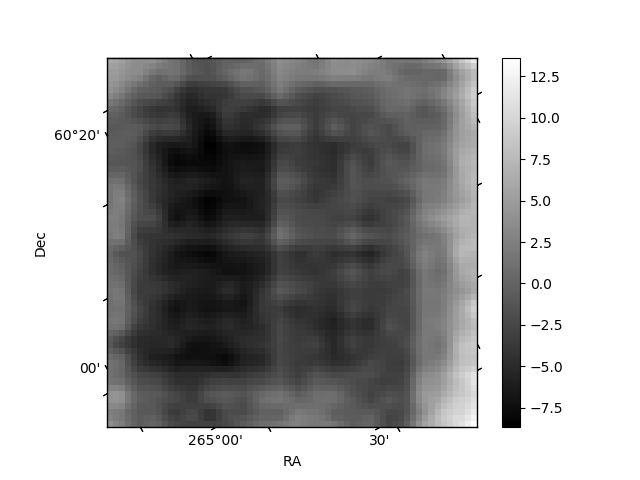
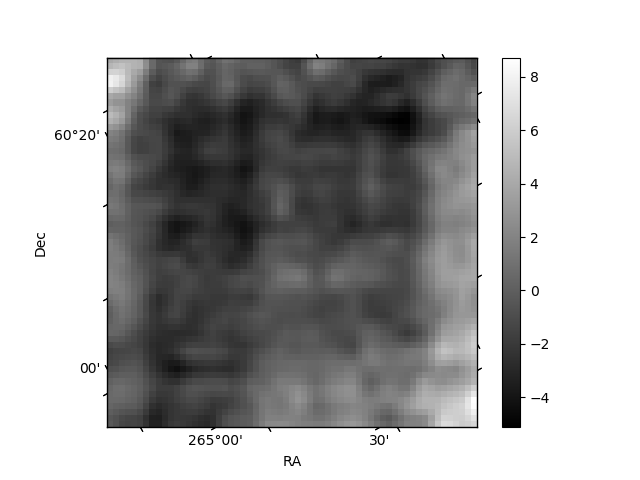
Histogram calculated using DETX and DETY for each event in the final _common_clean file
| Quadrant A | 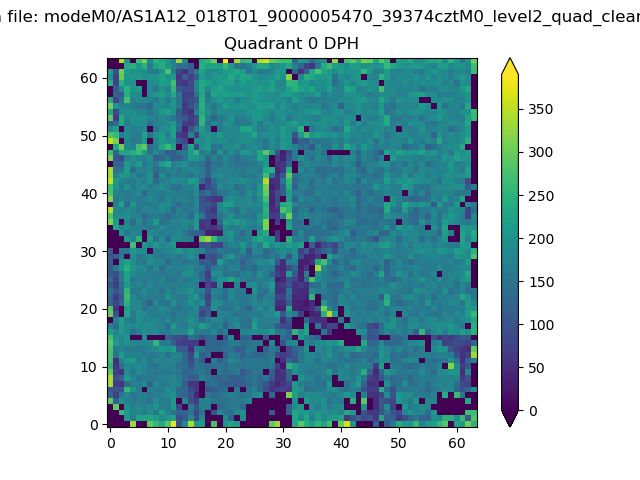 |
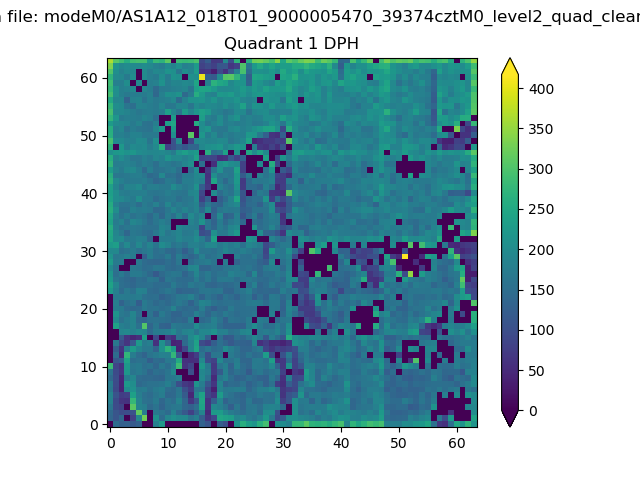 |
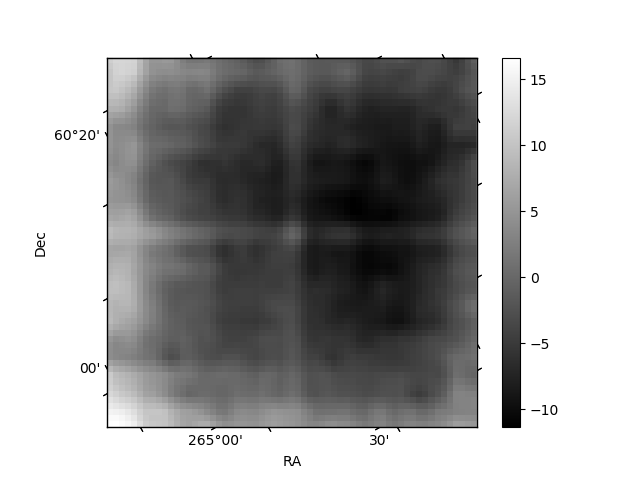
Quadrant B |
|---|---|---|---|
| Quadrant D | 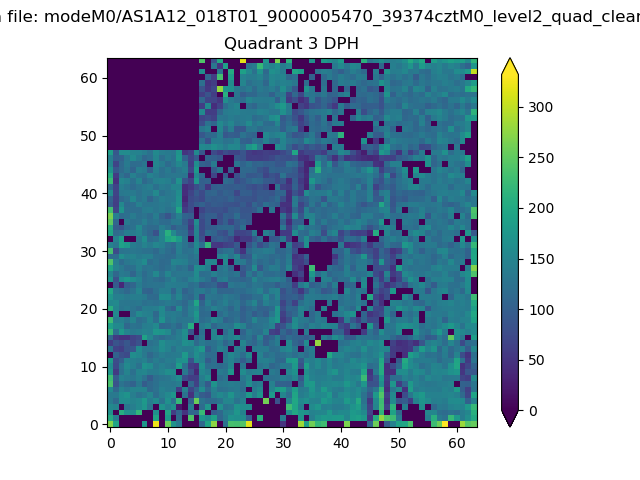 |
 |
Quadrant C |
| Plot type | Count rate plots | Images |
|---|---|---|
| Comparison with Poisson distribution Blue bars denote a histogram of data divided into 1 sec bins. Red curve is a Poisson curve with rate = median count rate of data. |
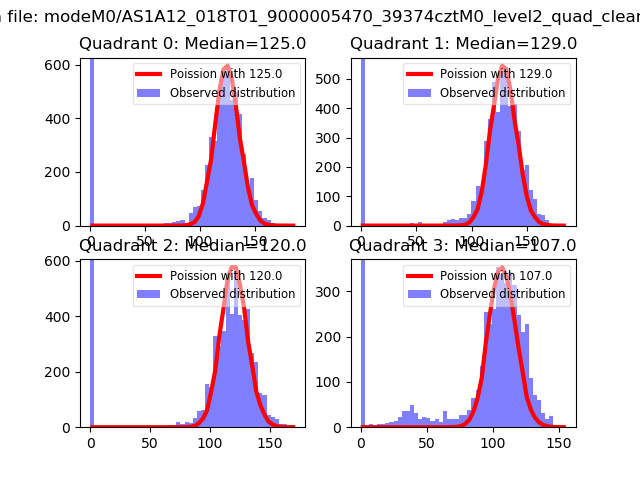 |
 |
| Quadrant-wise count rates Data is divided into 100 sec bins |
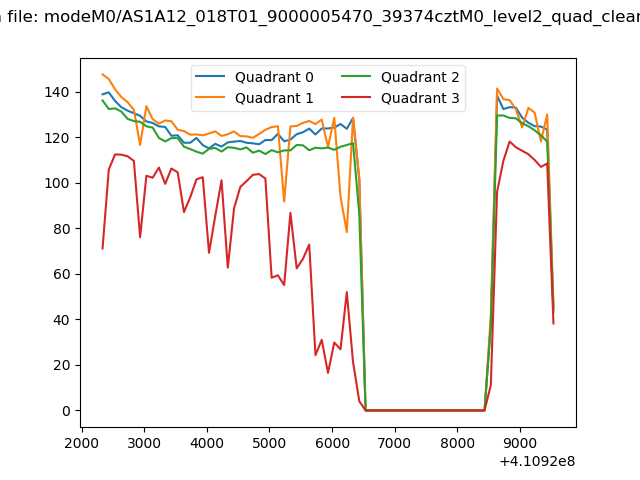 |
|
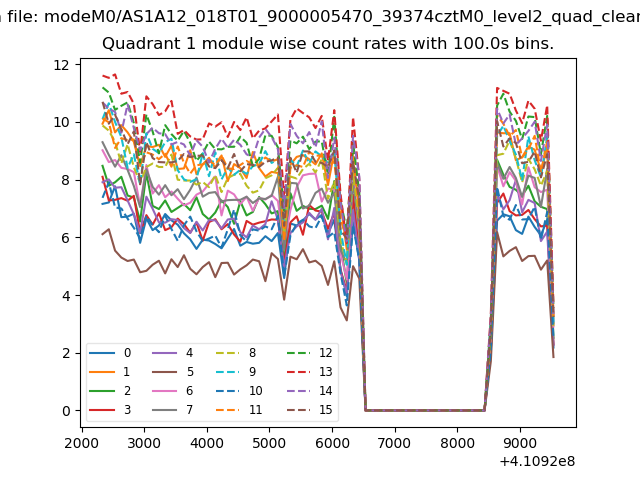
| Module-wise count rates for Quadrant A Data is divided into 100 sec bins |
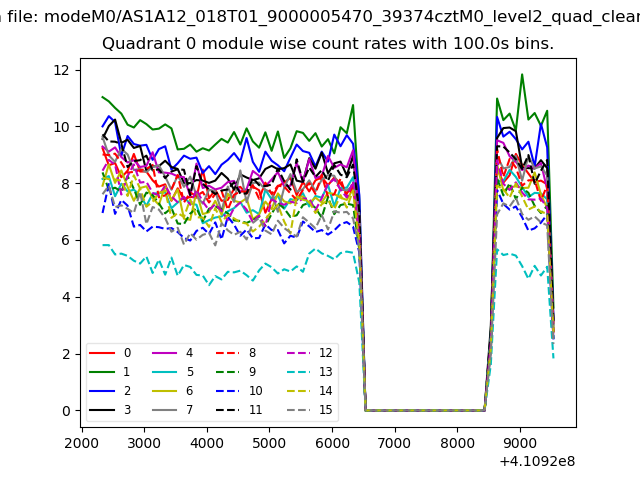 |
 |
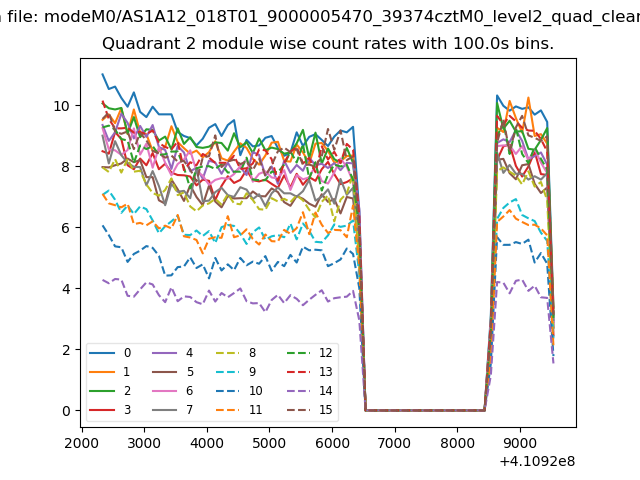
| Module-wise count rates for Quadrant B Data is divided into 100 sec bins |
 |
 |
| Module-wise count rates for Quadrant C Data is divided into 100 sec bins |
 |
 |
| Module-wise count rates for Quadrant D Data is divided into 100 sec bins |
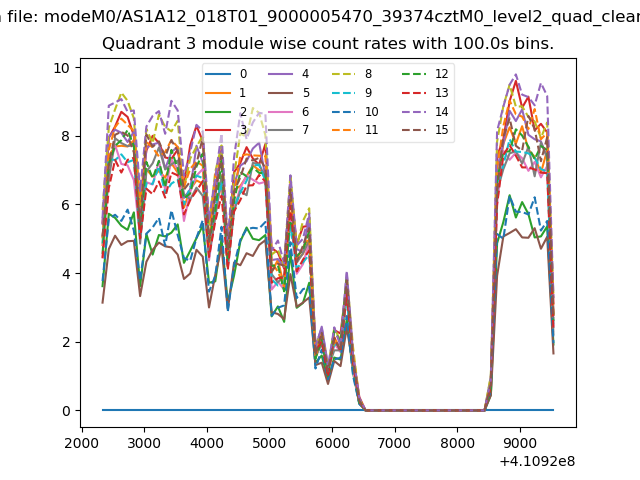 |
 |
| Parameter | Plot |
|---|---|
| CZT HV Monitor |  |
| D_VDD | 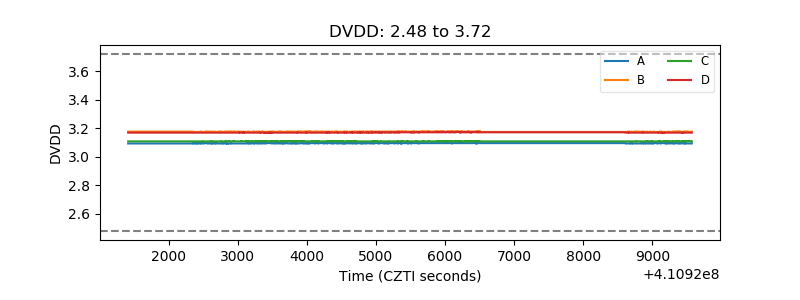 |
| Temperature 1 | 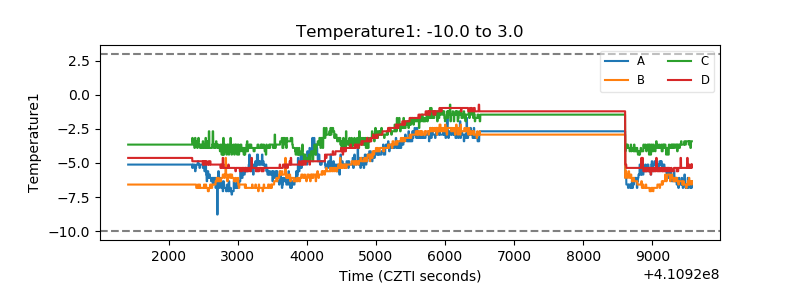 |
| Veto HV Monitor | 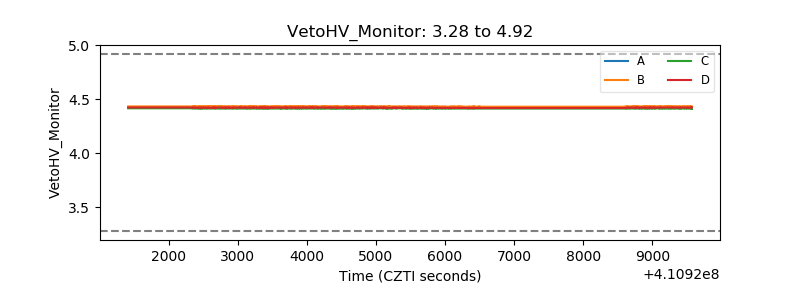 |
| Veto LLD | 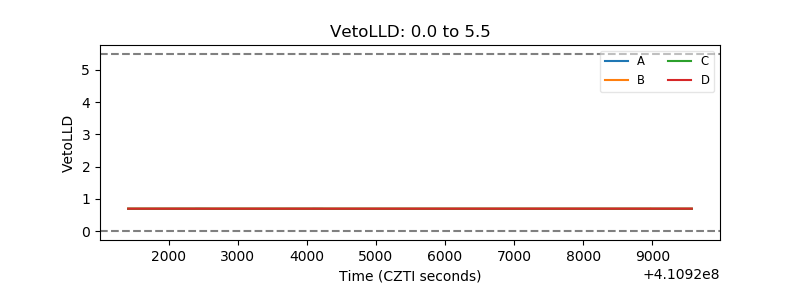 |
| Alpha Counter | 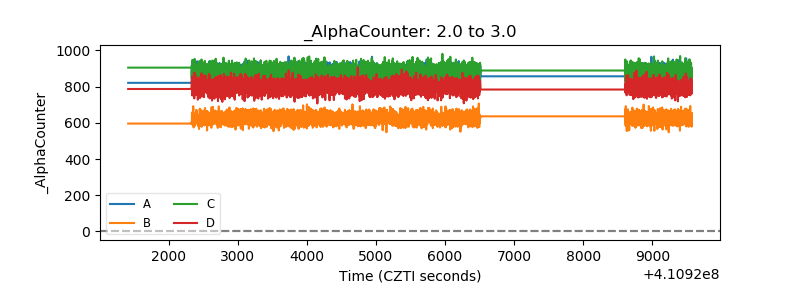 |
| _CPM_Rate | 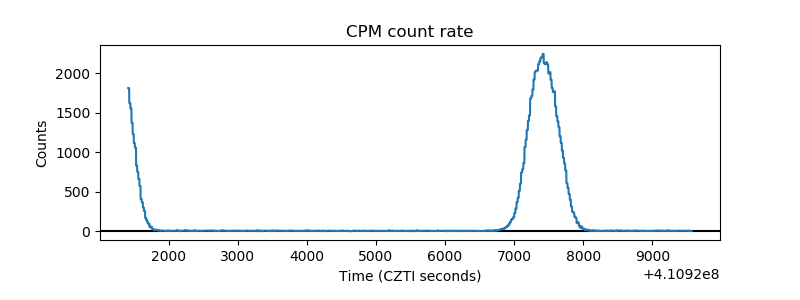 |
| CZT Counter | 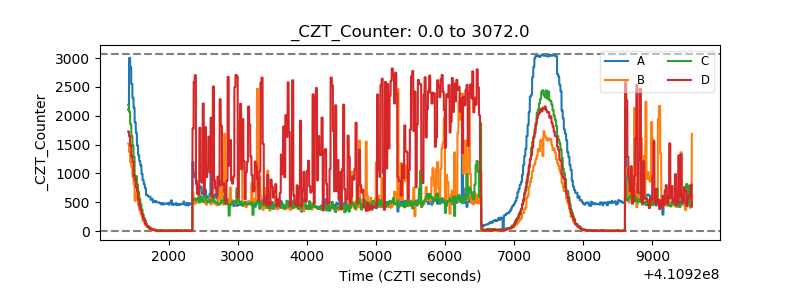 |
| +2.5 Volts monitor | 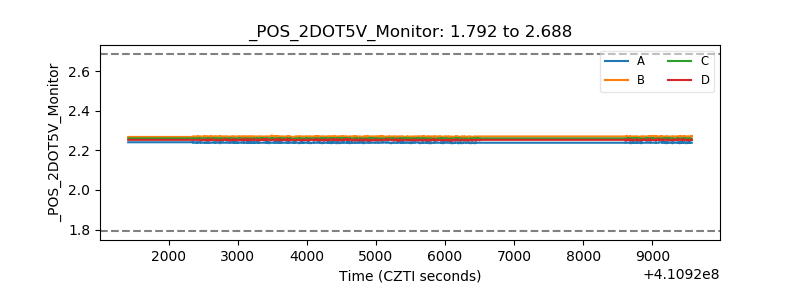 |
| +5 Volts monitor | 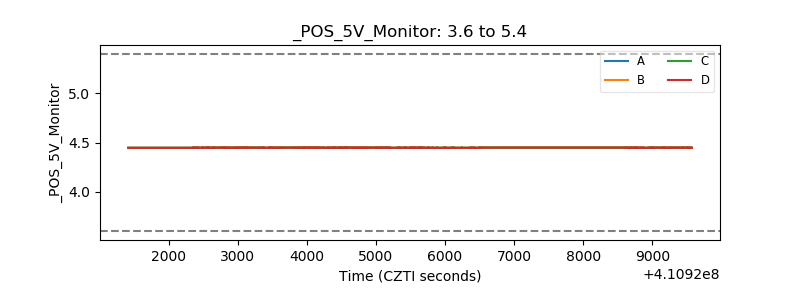 |
| _ROLL_ROT | 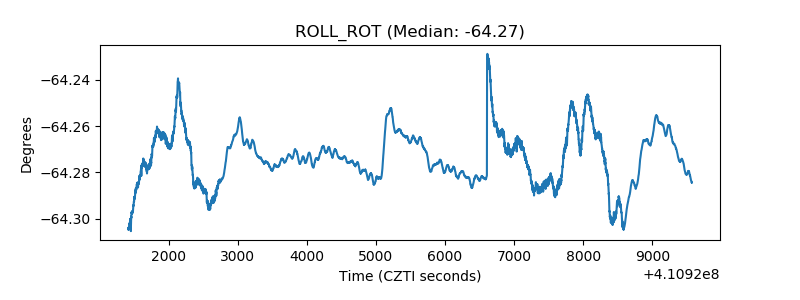 |
| _Roll_DEC | 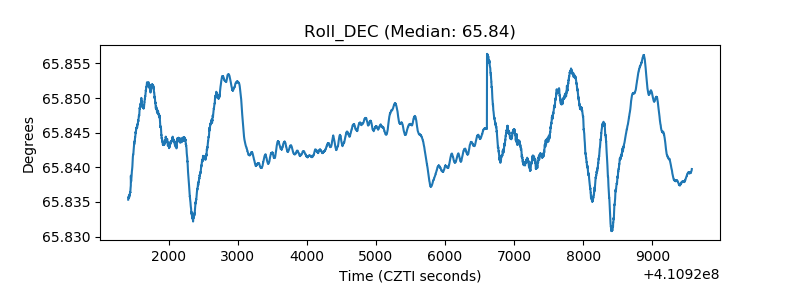 |
| _Roll_RA | 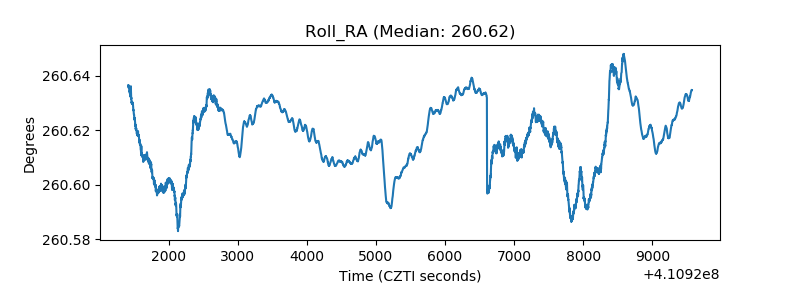 |
| Veto Counter | 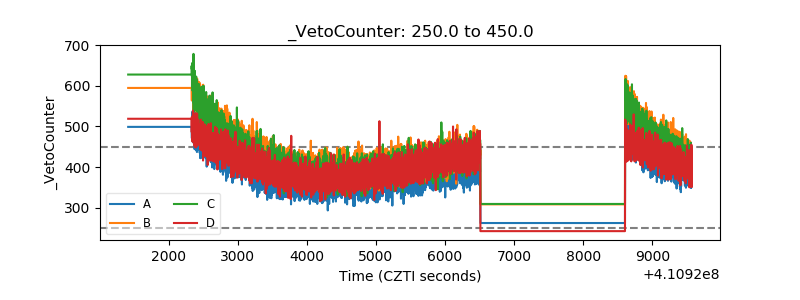 |