| Param | Original file | Final file |
|---|---|---|
| Filename | modeM0/AS1A12_018T01_9000005470_39375cztM0_level2.fits | modeM0/AS1A12_018T01_9000005470_39375cztM0_level2_quad_clean.evt |
| Size (bytes) | 333,740,160 | 69,615,360 |
| Size | 318.3 MB | 66.4 MB |
| Events in quadrant A | 2,090,733 | 496,805 |
| Events in quadrant B | 3,044,526 | 491,548 |
| Events in quadrant C | 2,006,380 | 476,034 |
| Events in quadrant D | 4,898,205 | 358,950 |
| Mode M9 | |||
|---|---|---|---|
| Quadrant | BADHDUFLAG | Total packets | Discarded packets |
| A | 0 | 29 | 0 |
| B | 0 | 30 | 1 |
| C | 0 | 31 | 1 |
| D | 0 | 31 | 0 |
| Mode SS | |||
|---|---|---|---|
| Quadrant | BADHDUFLAG | Total packets | Discarded packets |
| A | 0 | 89 | 5 |
| B | 0 | 89 | 5 |
| C | 0 | 90 | 4 |
| D | 0 | 89 | 5 |
| Mode M0 | |||
|---|---|---|---|
| Quadrant | BADHDUFLAG | Total packets | Discarded packets |
| A | 0 | 9197 | 588 |
| B | 0 | 12332 | 573 |
| C | 0 | 8857 | 404 |
| D | 0 | 18675 | 1362 |
| Quadrant | Total seconds | Saturated seconds | Saturation percentage |
|---|---|---|---|
| A | 4054 | 7 | 0.172669% |
| B | 4039 | 232 | 5.743996% |
| C | 4067 | 10 | 0.245881% |
| D | 3965 | 795 | 20.050441% |
Noise dominated data is calculated using 1-second bins in cleaned event files. If a bin has >2000 counts, and if more than 50% of those come from <1% of pixels, then it is considered to be noise-dominated and hence unusable.
| Quadrant | # 1 sec bins | Bins with >0 counts | Bins with >2000 counts | High rate bins dominated by noise | Noise dominated (total time) | Noise dominated (detector-on time) | Marked lightcurve |
|---|---|---|---|---|---|---|---|
| A | 6297 | 4094 | 4 | 4 | 0.06% | 0.10% | 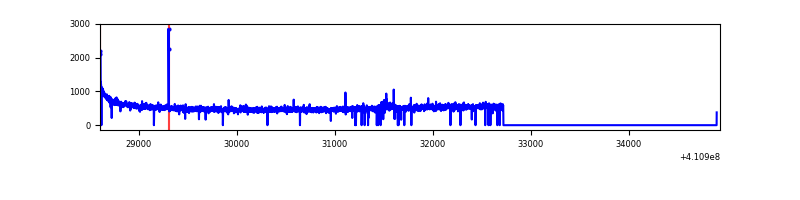 |
| B | 6329 | 4102 | 166 | 166 | 2.62% | 4.05% | 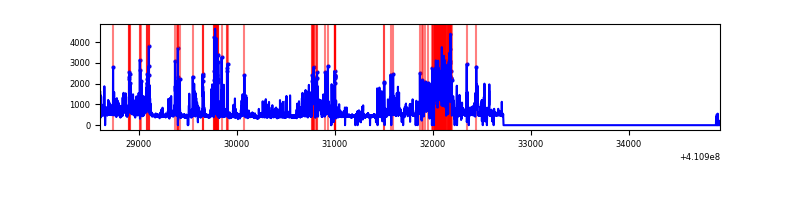 |
| C | 6321 | 4107 | 12 | 12 | 0.19% | 0.29% | 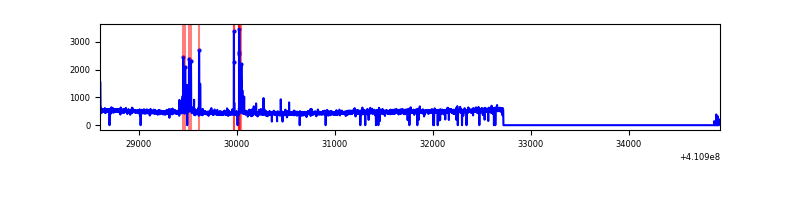 |
| D | 4117 | 4078 | 657 | 657 | 15.96% | 16.11% | 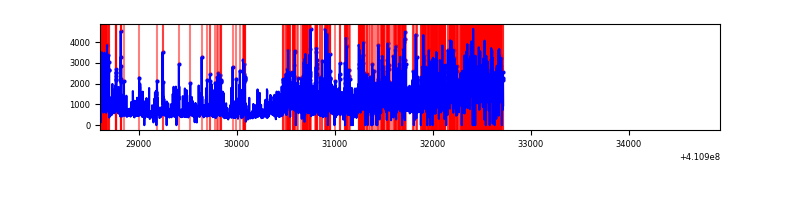 |
Top three noisy pixels from each quadrant. If the there are fewer than three noisy pixels in the level2.evt file, extra rows are filled as -1
| Pixel properties | Quadrant properties | ||||||
|---|---|---|---|---|---|---|---|
| Quadrant | DetID | PixID | Counts | Sigma | Mean | Median | Sigma |
| A | 10 | 83 | 282589 | 3023.65 | 460 | 452 | 93.3 |
| A | 13 | 248 | 9710 | 99.22 | 460 | 452 | 93.3 |
| A | 15 | 174 | 7849 | 79.27 | 460 | 452 | 93.3 |
| B | 5 | 172 | 643300 | 7506.07 | 445 | 433 | 85.6 |
| B | 5 | 200 | 594154 | 6932.25 | 445 | 433 | 85.6 |
| B | 4 | 170 | 38854 | 448.6 | 445 | 433 | 85.6 |
| C | 15 | 214 | 167892 | 1644.56 | 440 | 443 | 101.8 |
| C | 14 | 254 | 95444 | 933.03 | 440 | 443 | 101.8 |
| C | 9 | 187 | 13675 | 129.95 | 440 | 443 | 101.8 |
| D | 12 | 235 | 2998626 | 31137.33 | 394 | 382 | 96.3 |
| D | 13 | 249 | 216385 | 2243.23 | 394 | 382 | 96.3 |
| D | 2 | 249 | 145012 | 1502.01 | 394 | 382 | 96.3 |
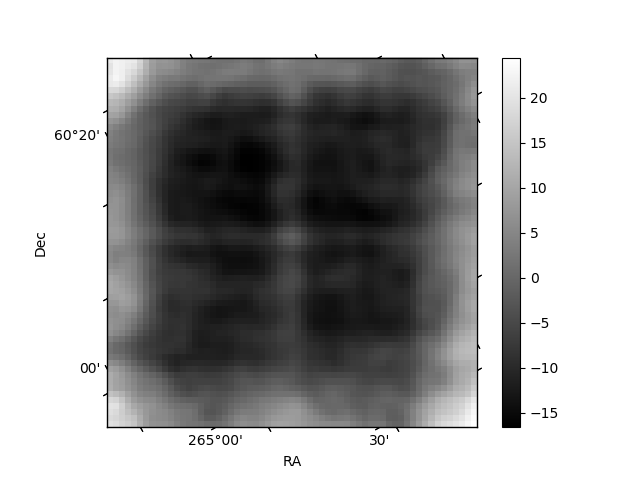
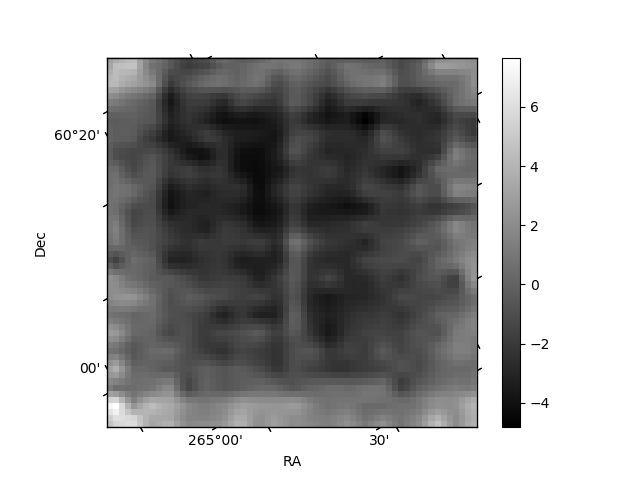
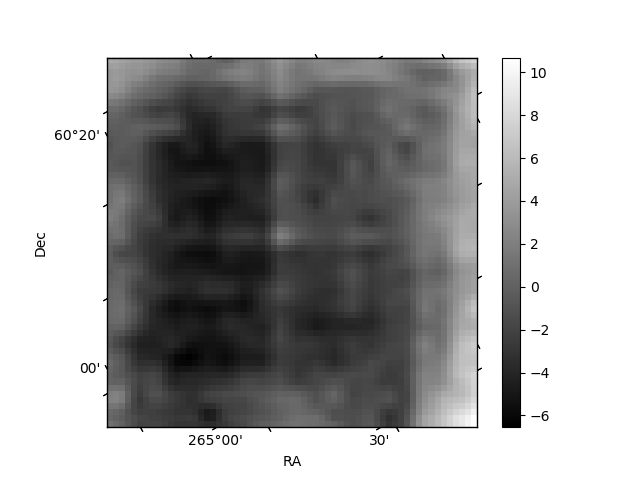
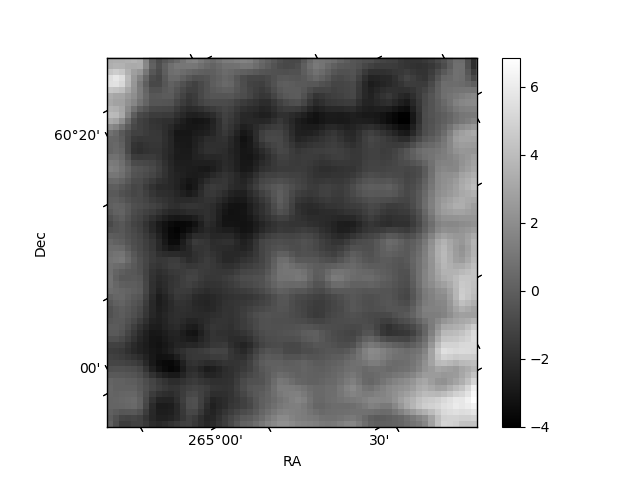
Histogram calculated using DETX and DETY for each event in the final _common_clean file
| Quadrant A | 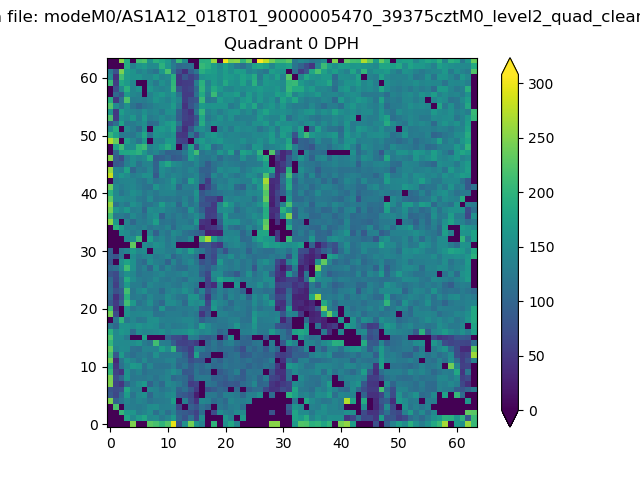 |
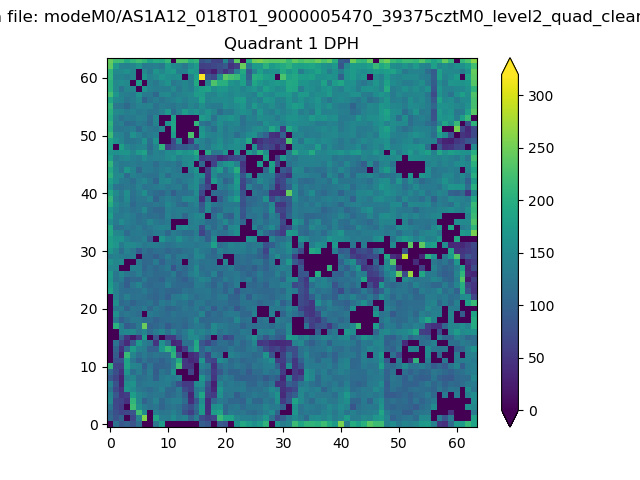 |
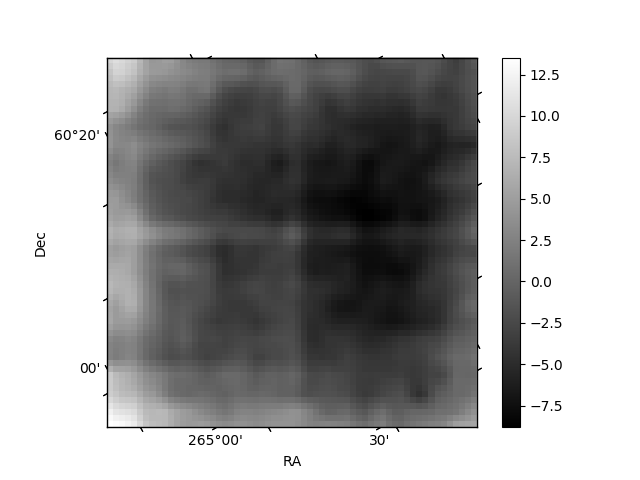
Quadrant B |
|---|---|---|---|
| Quadrant D | 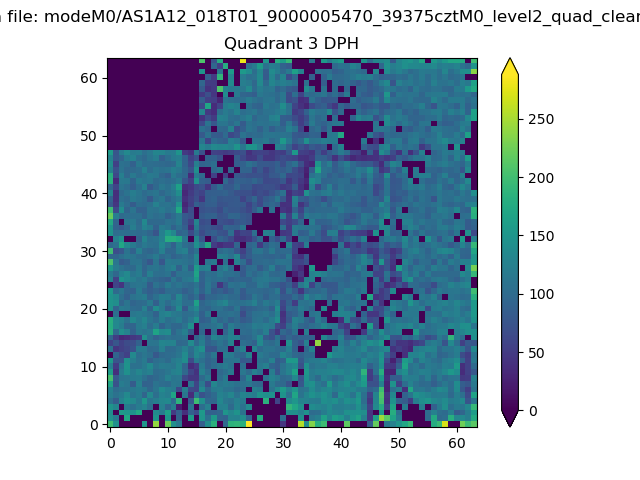 |
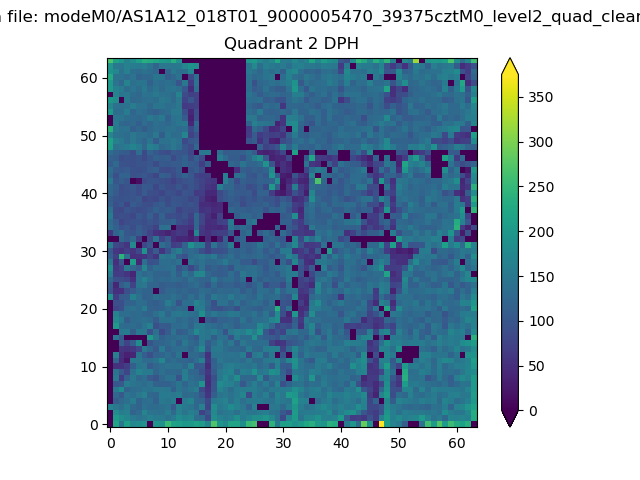 |
Quadrant C |
| Plot type | Count rate plots | Images |
|---|---|---|
| Comparison with Poisson distribution Blue bars denote a histogram of data divided into 1 sec bins. Red curve is a Poisson curve with rate = median count rate of data. |
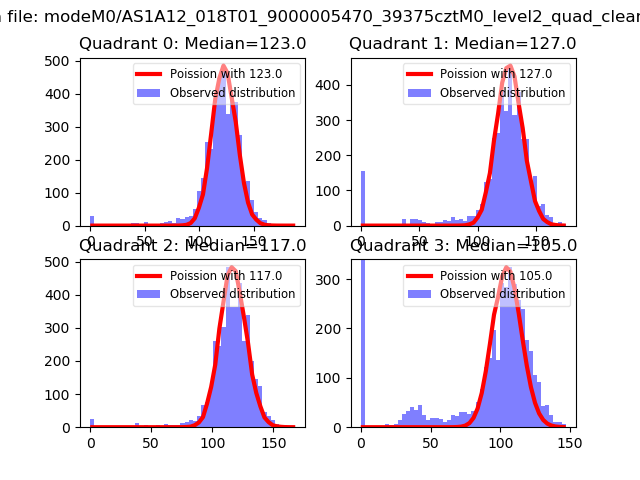 |
 |
| Quadrant-wise count rates Data is divided into 100 sec bins |
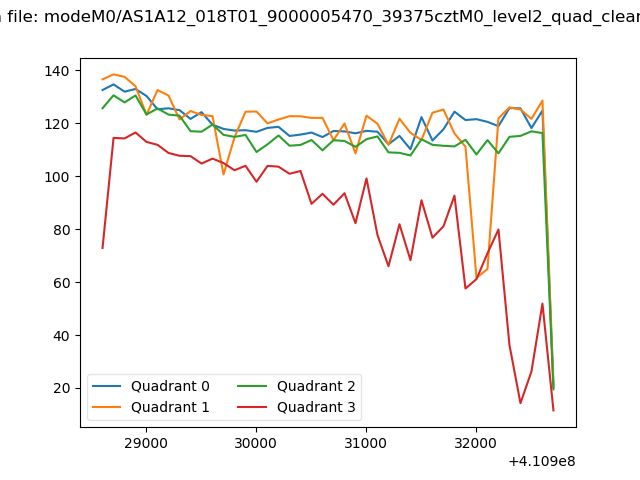 |
|
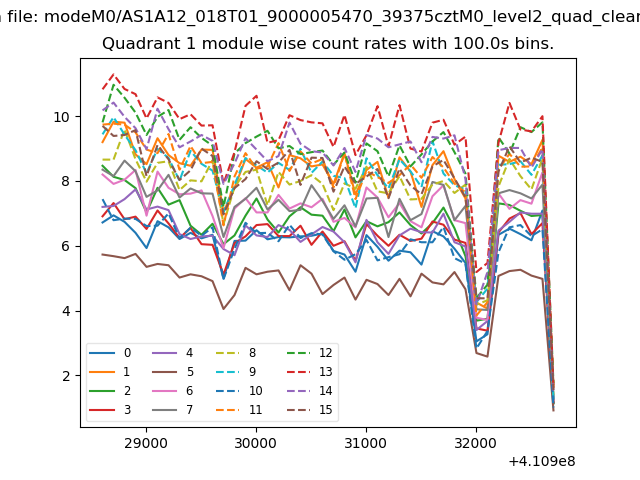
| Module-wise count rates for Quadrant A Data is divided into 100 sec bins |
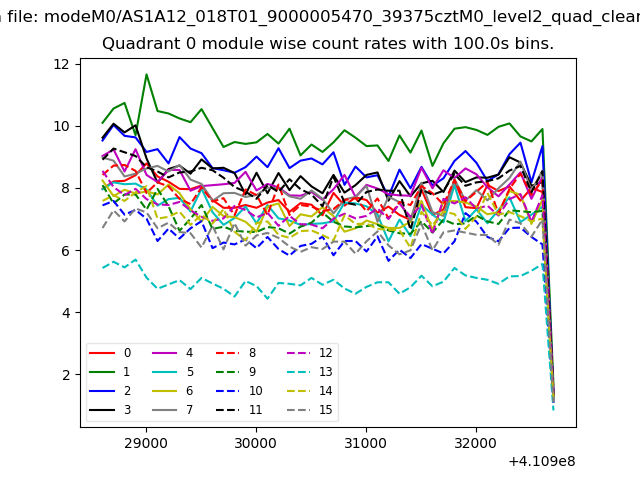 |
 |
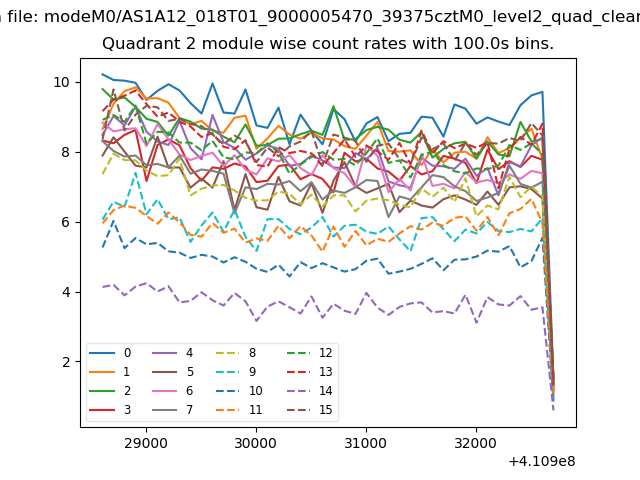
| Module-wise count rates for Quadrant B Data is divided into 100 sec bins |
 |
 |
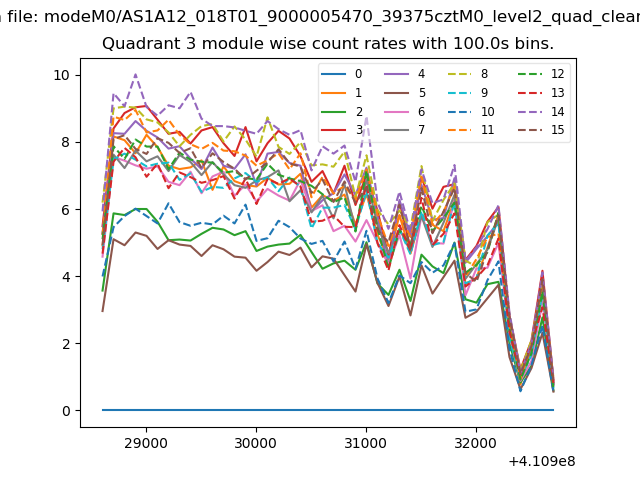
| Module-wise count rates for Quadrant C Data is divided into 100 sec bins |
 |
 |
| Module-wise count rates for Quadrant D Data is divided into 100 sec bins |
 |
 |
| Parameter | Plot |
|---|---|
| CZT HV Monitor | 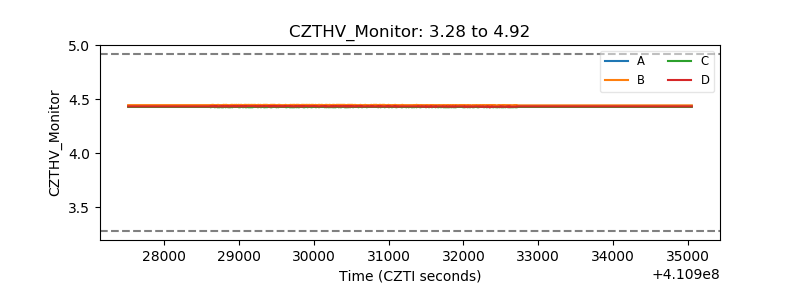 |
| D_VDD | 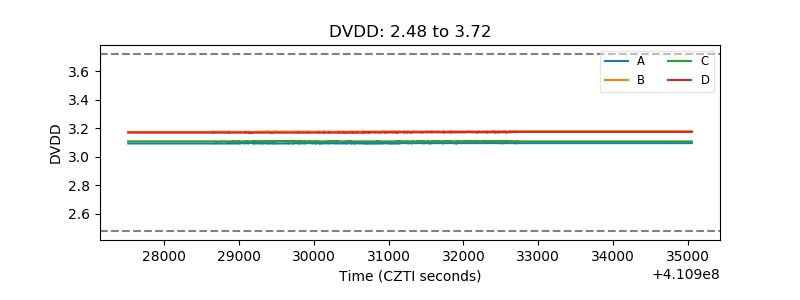 |
| Temperature 1 | 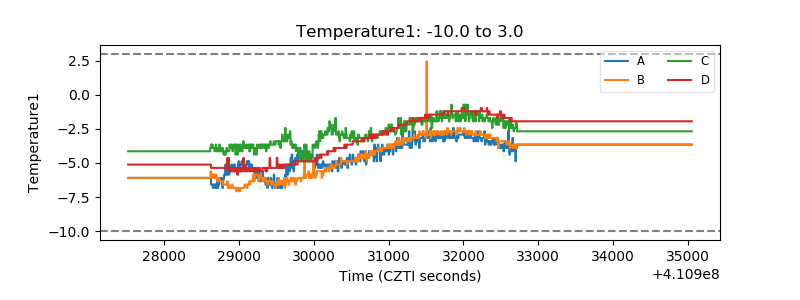 |
| Veto HV Monitor | 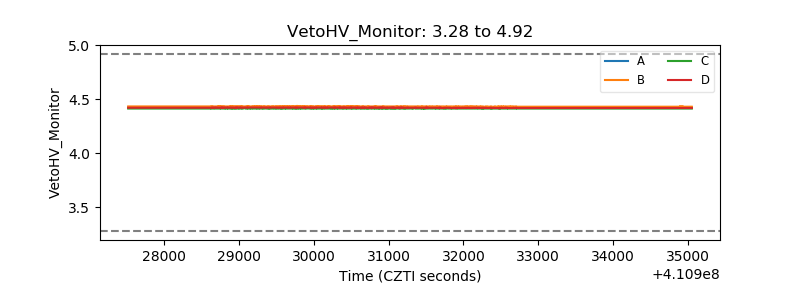 |
| Veto LLD | 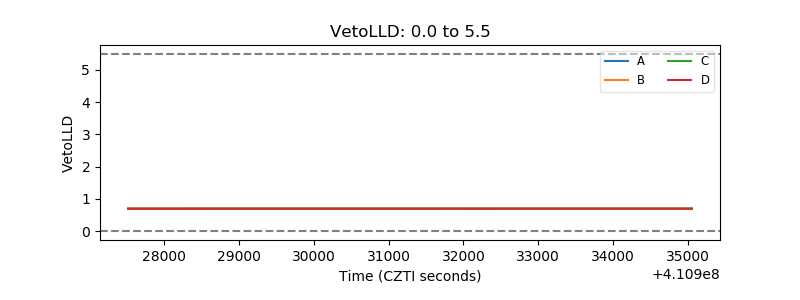 |
| Alpha Counter | 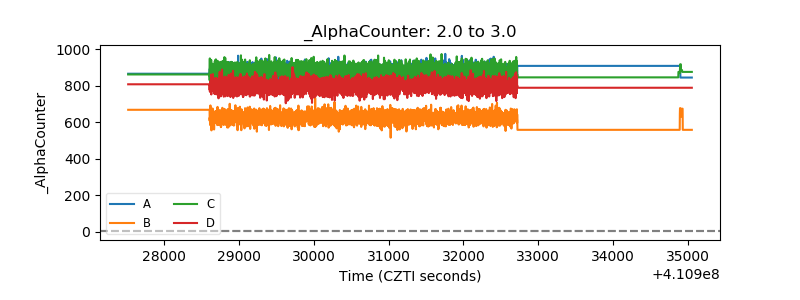 |
| _CPM_Rate | 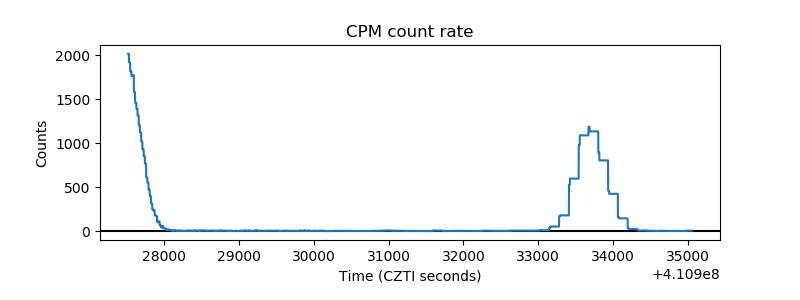 |
| CZT Counter | 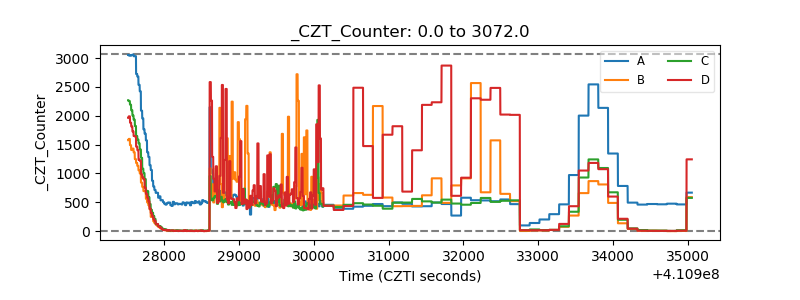 |
| +2.5 Volts monitor | 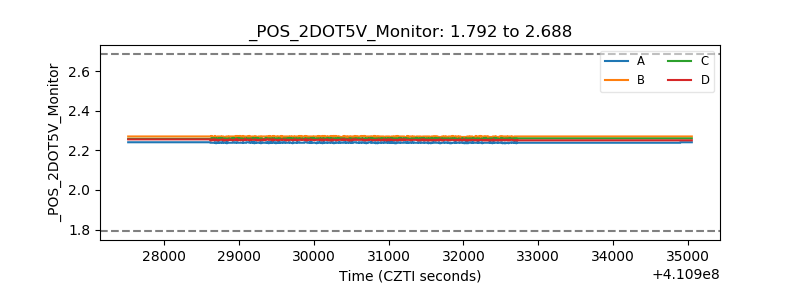 |
| +5 Volts monitor | 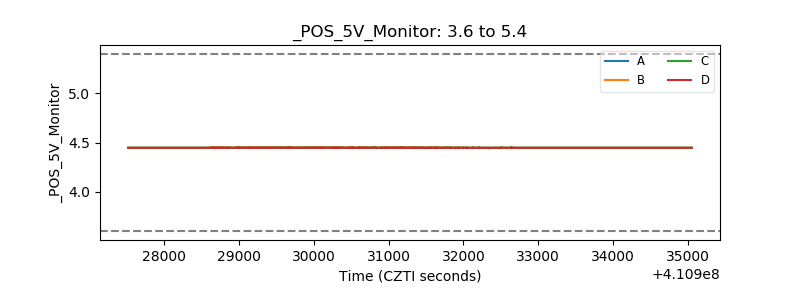 |
| _ROLL_ROT | 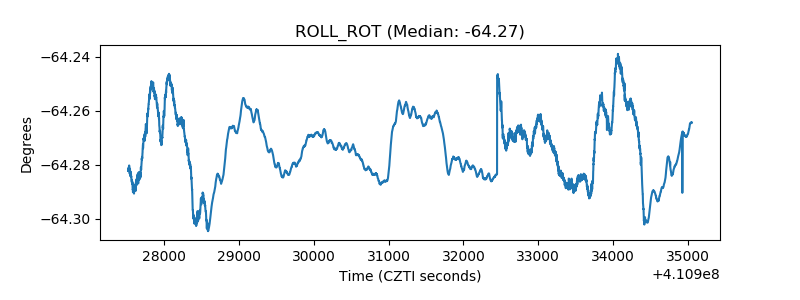 |
| _Roll_DEC | 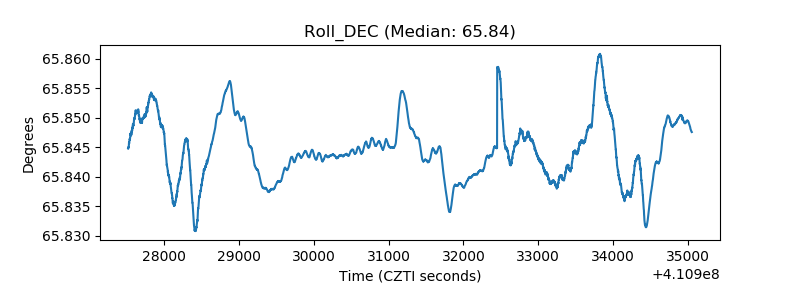 |
| _Roll_RA | 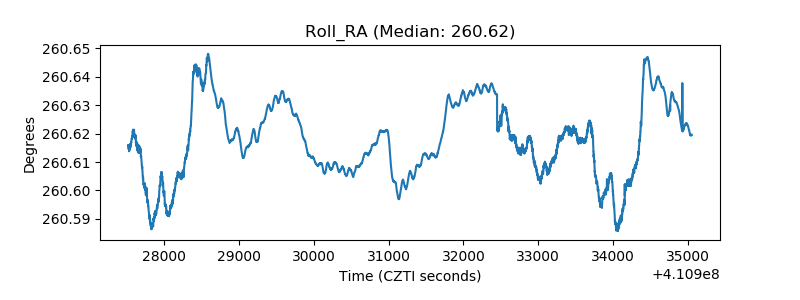 |
| Veto Counter | 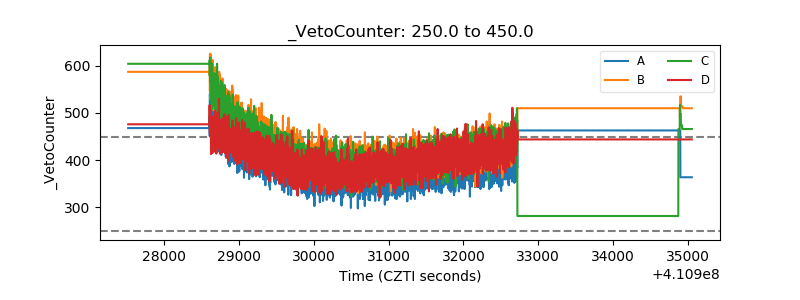 |