| Param | Original file | Final file |
|---|---|---|
| Filename | modeM0/AS1A12_018T01_9000005470_39376cztM0_level2.fits | modeM0/AS1A12_018T01_9000005470_39376cztM0_level2_quad_clean.evt |
| Size (bytes) | 344,298,240 | 74,396,160 |
| Size | 328.3 MB | 70.9 MB |
| Events in quadrant A | 2,350,825 | 531,955 |
| Events in quadrant B | 2,920,864 | 518,157 |
| Events in quadrant C | 2,122,031 | 502,107 |
| Events in quadrant D | 5,000,104 | 383,032 |
| Mode M9 | |||
|---|---|---|---|
| Quadrant | BADHDUFLAG | Total packets | Discarded packets |
| A | 0 | 28 | 0 |
| B | 0 | 31 | 3 |
| C | 0 | 31 | 4 |
| D | 0 | 32 | 1 |
| Mode SS | |||
|---|---|---|---|
| Quadrant | BADHDUFLAG | Total packets | Discarded packets |
| A | 0 | 101 | 1 |
| B | 0 | 101 | 3 |
| C | 0 | 100 | 5 |
| D | 0 | 100 | 7 |
| Mode M0 | |||
|---|---|---|---|
| Quadrant | BADHDUFLAG | Total packets | Discarded packets |
| A | 0 | 10389 | 703 |
| B | 0 | 12938 | 1154 |
| C | 0 | 9890 | 674 |
| D | 0 | 20358 | 2473 |
| Quadrant | Total seconds | Saturated seconds | Saturation percentage |
|---|---|---|---|
| A | 4565 | 10 | 0.219058% |
| B | 4525 | 252 | 5.569061% |
| C | 4543 | 5 | 0.110059% |
| D | 4350 | 704 | 16.183908% |
Noise dominated data is calculated using 1-second bins in cleaned event files. If a bin has >2000 counts, and if more than 50% of those come from <1% of pixels, then it is considered to be noise-dominated and hence unusable.
| Quadrant | # 1 sec bins | Bins with >0 counts | Bins with >2000 counts | High rate bins dominated by noise | Noise dominated (total time) | Noise dominated (detector-on time) | Marked lightcurve |
|---|---|---|---|---|---|---|---|
| A | 7078 | 4808 | 2 | 2 | 0.03% | 0.04% | 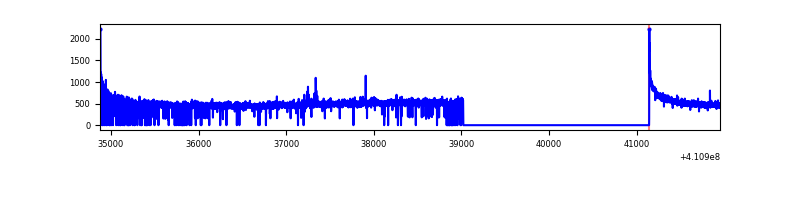 |
| B | 7078 | 4779 | 153 | 153 | 2.16% | 3.20% | 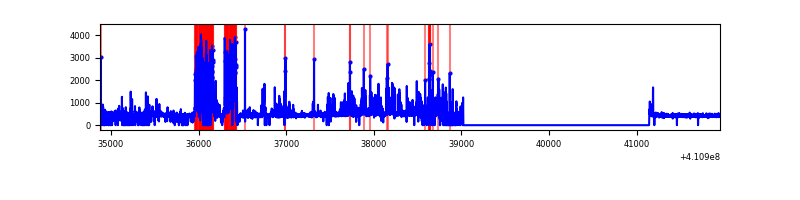 |
| C | 7078 | 4800 | 2 | 2 | 0.03% | 0.04% | 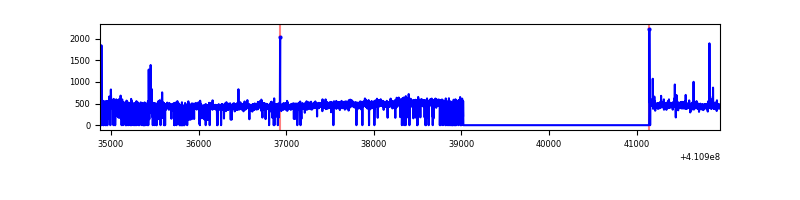 |
| D | 7078 | 4685 | 577 | 577 | 8.15% | 12.32% | 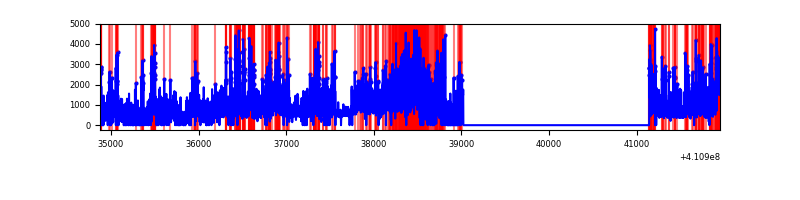 |
Top three noisy pixels from each quadrant. If the there are fewer than three noisy pixels in the level2.evt file, extra rows are filled as -1
| Pixel properties | Quadrant properties | ||||||
|---|---|---|---|---|---|---|---|
| Quadrant | DetID | PixID | Counts | Sigma | Mean | Median | Sigma |
| A | 10 | 83 | 377277 | 3673.2 | 505 | 495 | 102.6 |
| A | 13 | 248 | 8536 | 78.39 | 505 | 495 | 102.6 |
| A | 13 | 254 | 5940 | 53.08 | 505 | 495 | 102.6 |
| B | 5 | 200 | 527807 | 5623.07 | 485 | 474 | 93.8 |
| B | 5 | 172 | 441454 | 4702.27 | 485 | 474 | 93.8 |
| B | 4 | 170 | 28044 | 293.99 | 485 | 474 | 93.8 |
| C | 15 | 214 | 193718 | 1739.72 | 479 | 481 | 111.1 |
| C | 3 | 233 | 24067 | 212.35 | 479 | 481 | 111.1 |
| C | 14 | 254 | 23840 | 210.3 | 479 | 481 | 111.1 |
| D | 12 | 235 | 3152933 | 30076.03 | 429 | 416 | 104.8 |
| D | 13 | 249 | 71053 | 673.9 | 429 | 416 | 104.8 |
| D | 6 | 239 | 62833 | 595.48 | 429 | 416 | 104.8 |
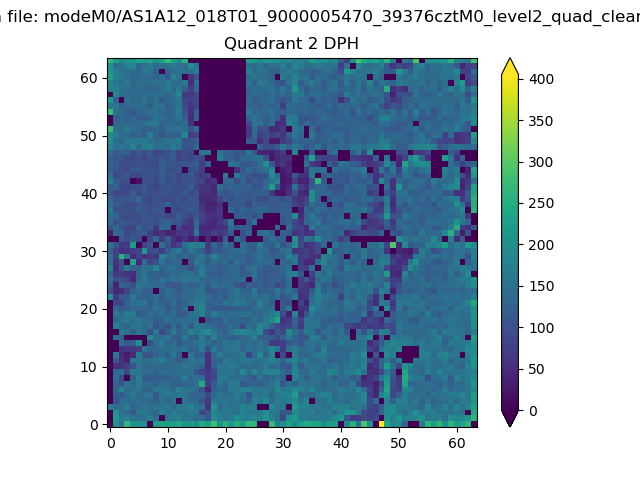
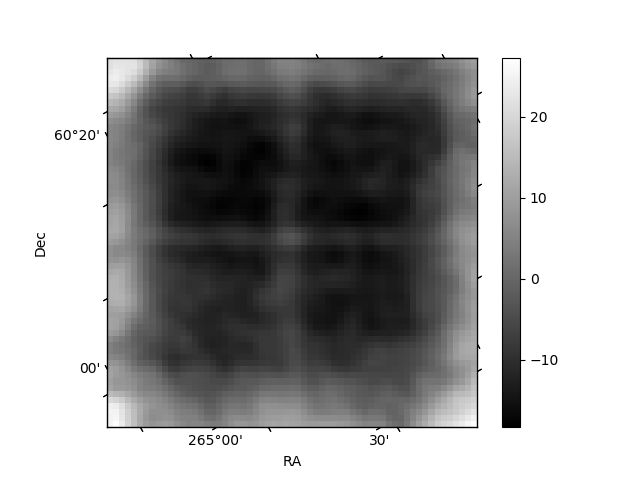
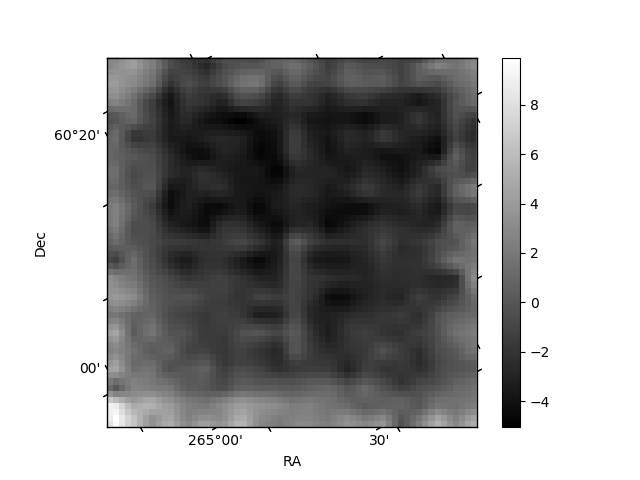
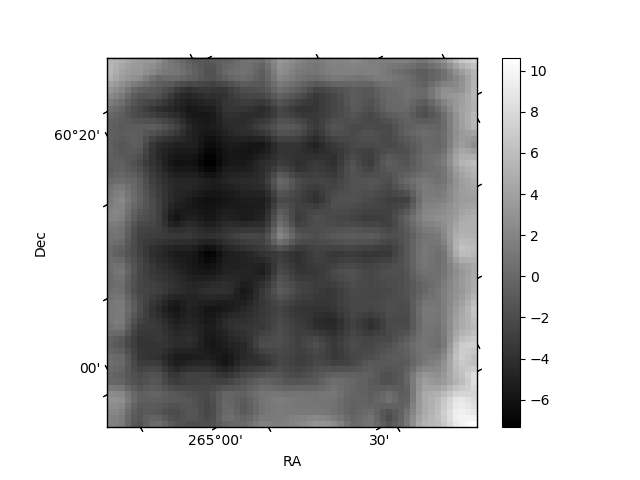
Histogram calculated using DETX and DETY for each event in the final _common_clean file
| Quadrant A | 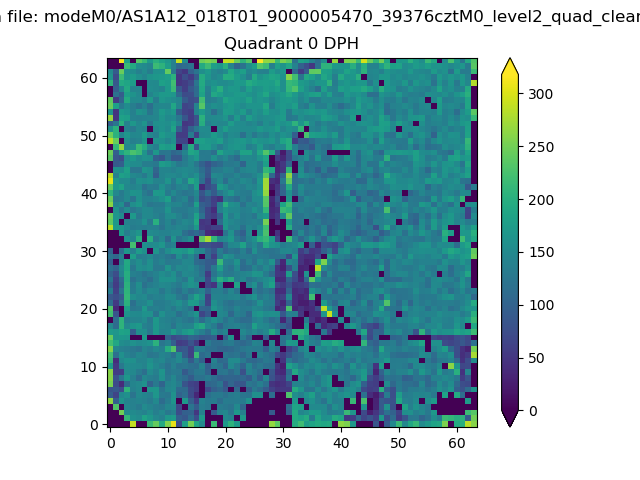 |
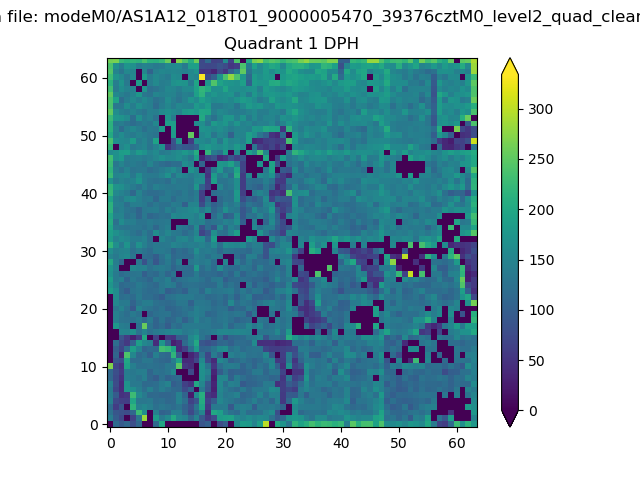 |
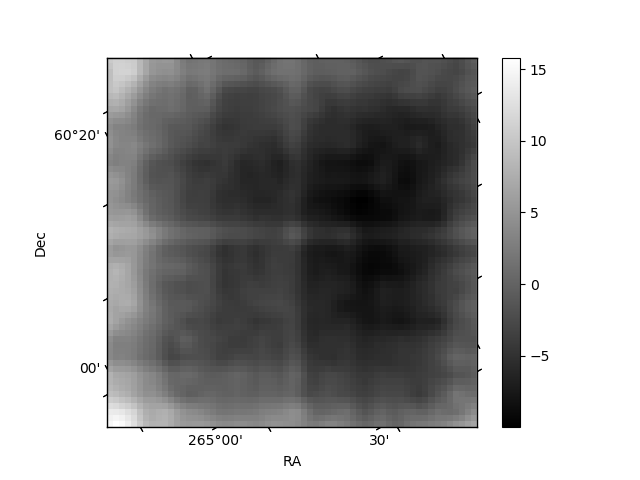
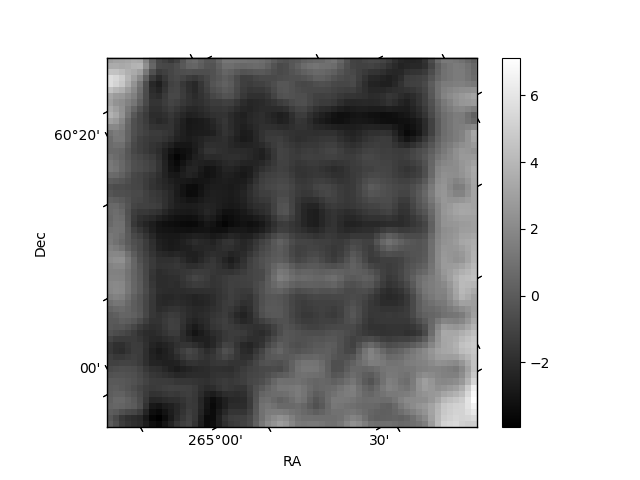
Quadrant B |
|---|---|---|---|
| Quadrant D | 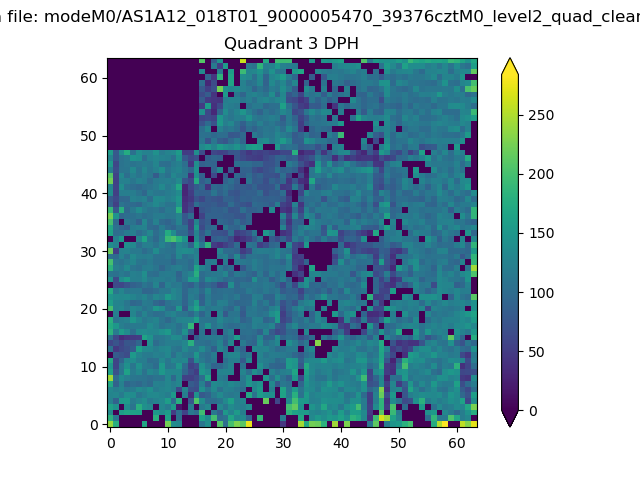 |
 |
Quadrant C |
| Plot type | Count rate plots | Images |
|---|---|---|
| Comparison with Poisson distribution Blue bars denote a histogram of data divided into 1 sec bins. Red curve is a Poisson curve with rate = median count rate of data. |
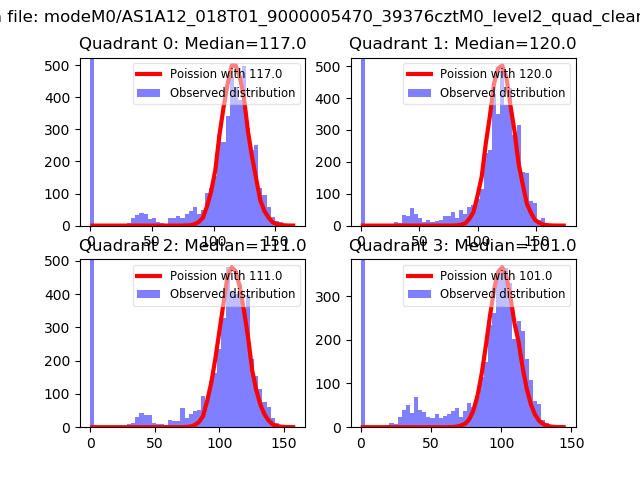 |
 |
| Quadrant-wise count rates Data is divided into 100 sec bins |
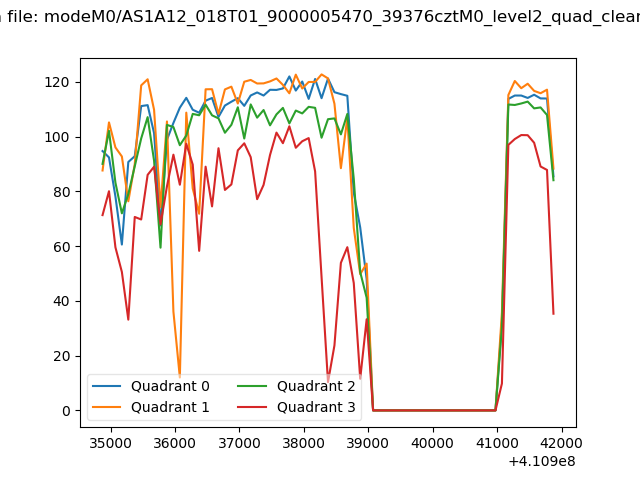 |
|
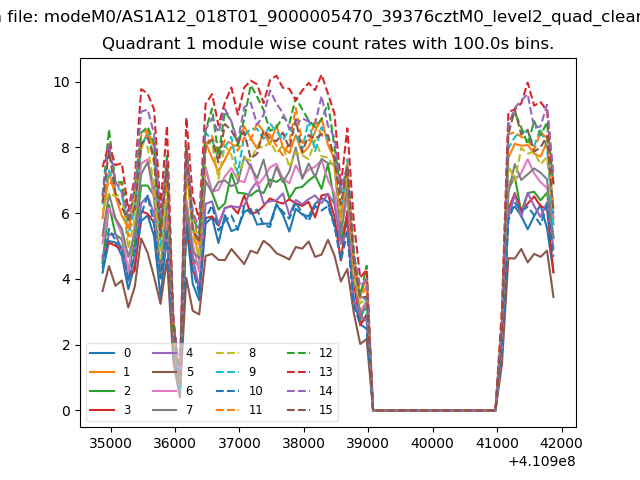
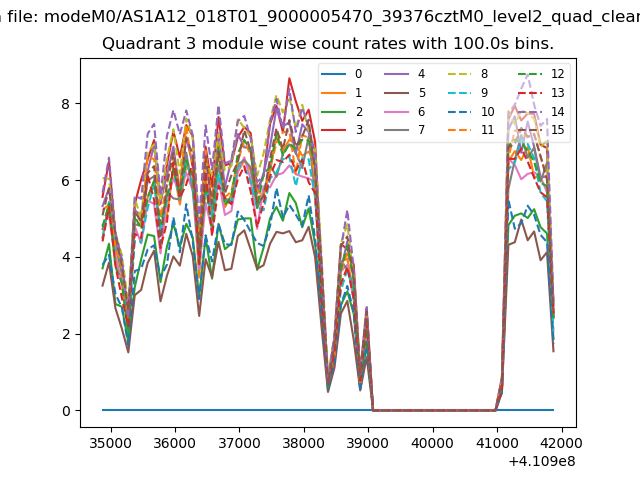
| Module-wise count rates for Quadrant A Data is divided into 100 sec bins |
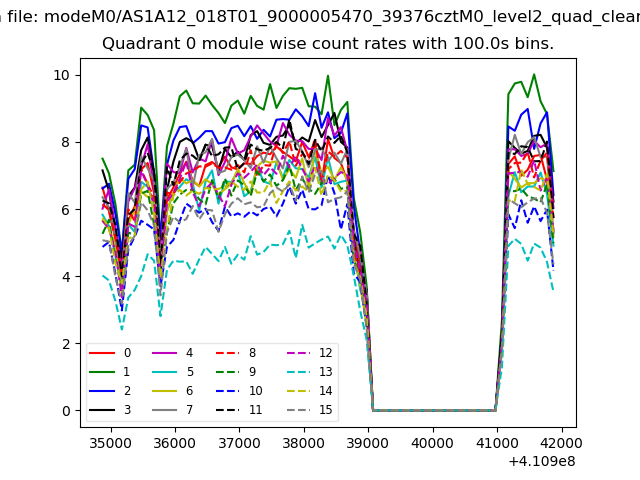 |
 |
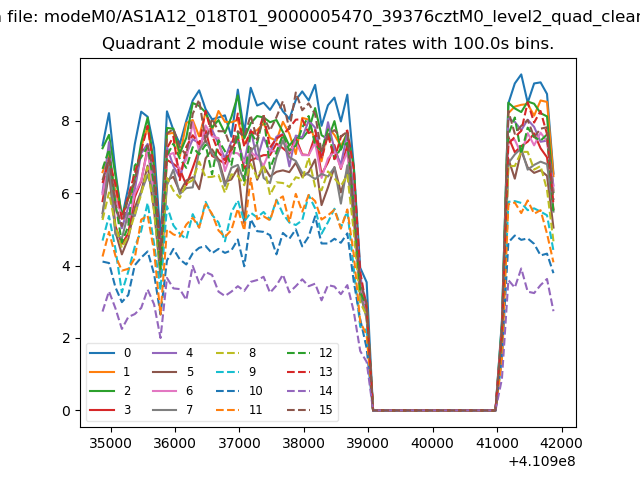
| Module-wise count rates for Quadrant B Data is divided into 100 sec bins |
 |
 |
| Module-wise count rates for Quadrant C Data is divided into 100 sec bins |
 |
 |
| Module-wise count rates for Quadrant D Data is divided into 100 sec bins |
 |
 |
| Parameter | Plot |
|---|---|
| CZT HV Monitor | 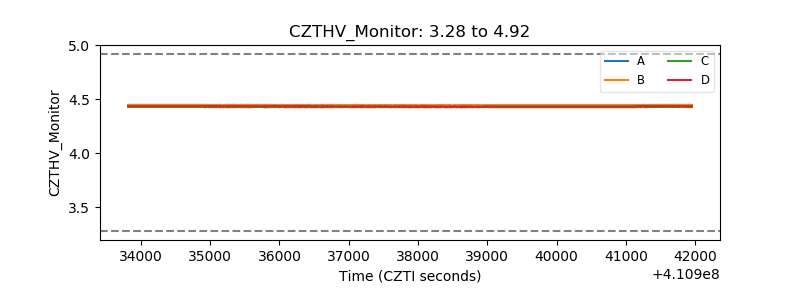 |
| D_VDD | 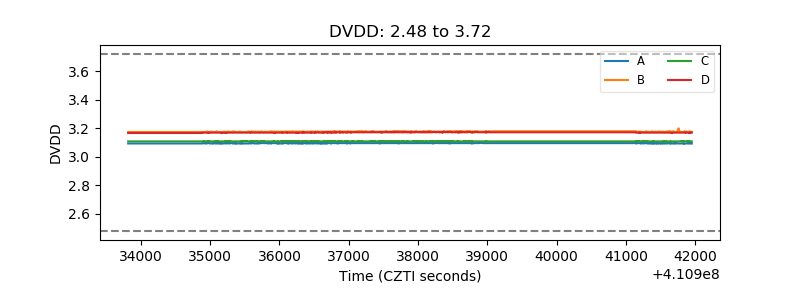 |
| Temperature 1 | 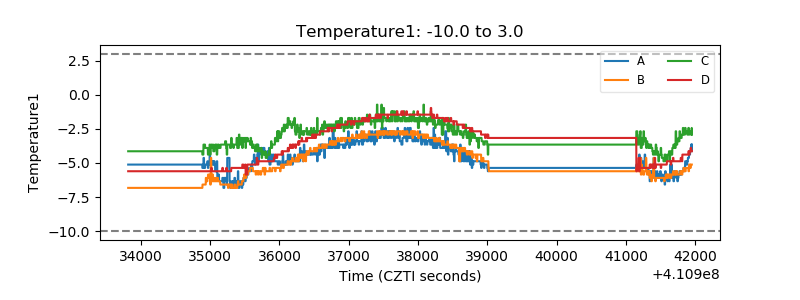 |
| Veto HV Monitor | 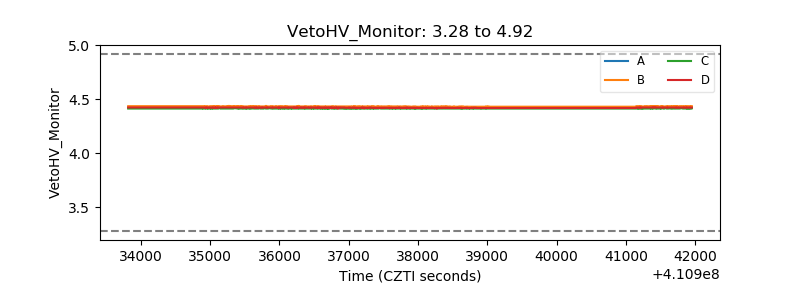 |
| Veto LLD | 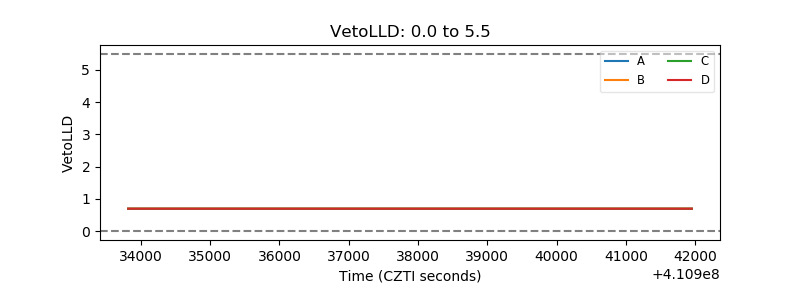 |
| Alpha Counter | 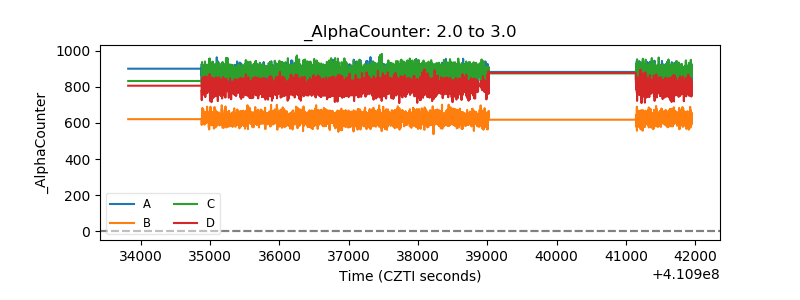 |
| _CPM_Rate | 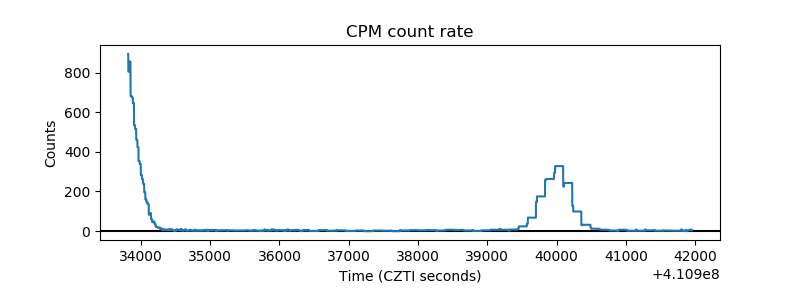 |
| CZT Counter | 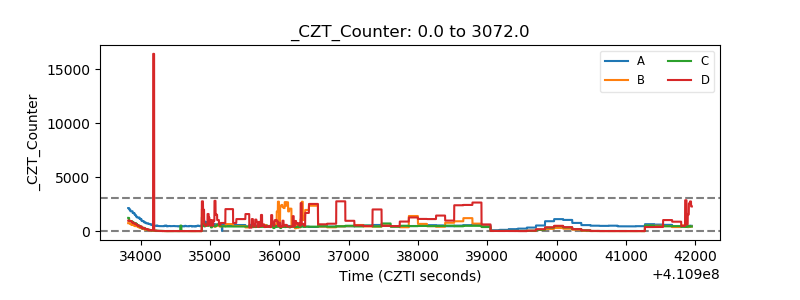 |
| +2.5 Volts monitor | 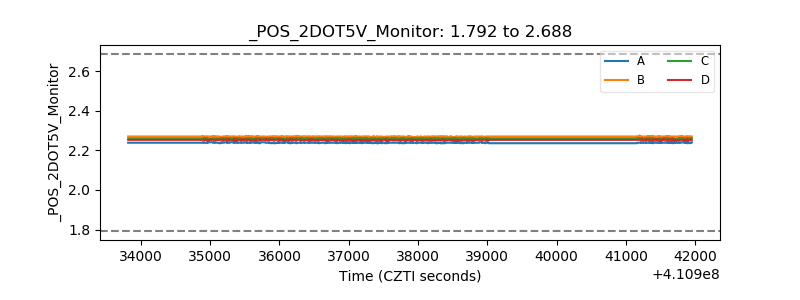 |
| +5 Volts monitor | 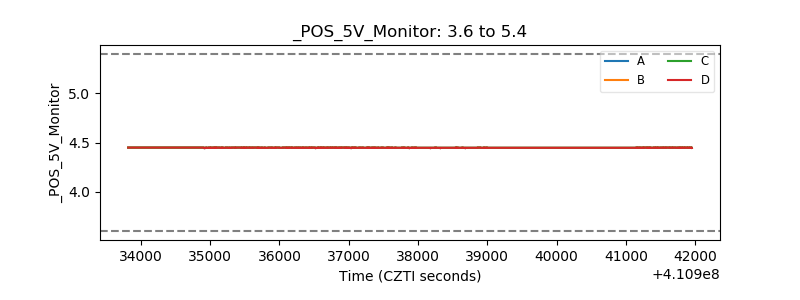 |
| _ROLL_ROT | 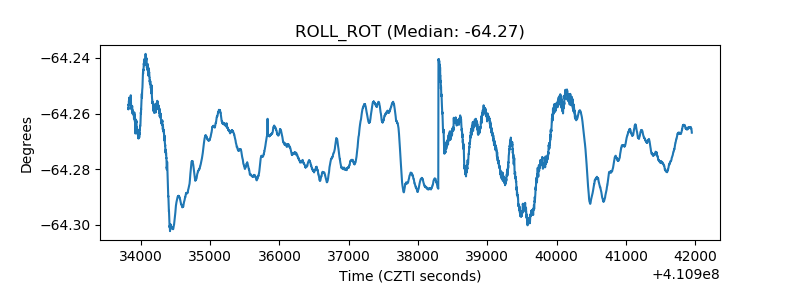 |
| _Roll_DEC | 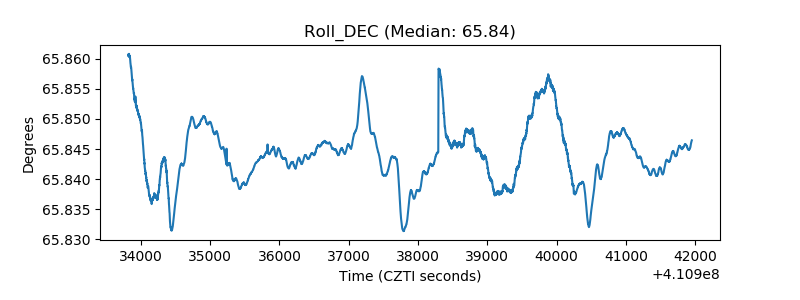 |
| _Roll_RA | 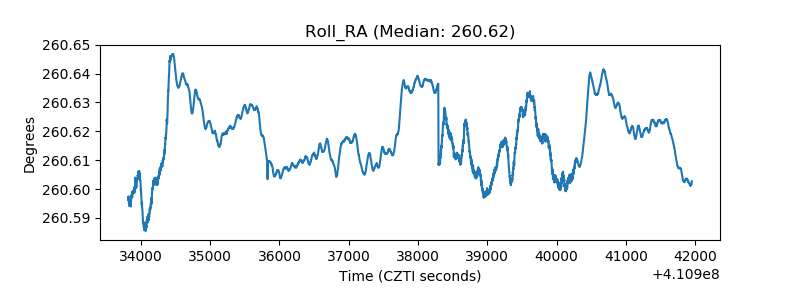 |
| Veto Counter | 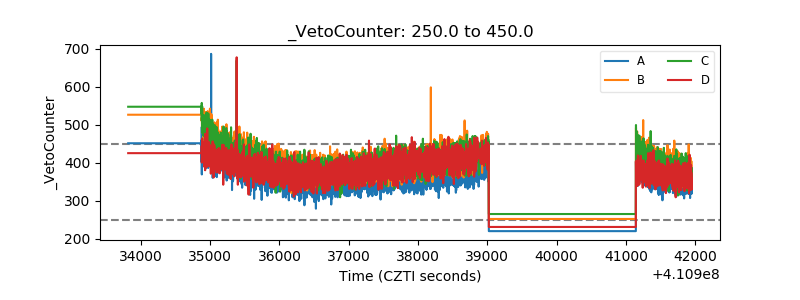 |