| Param | Original file | Final file |
|---|---|---|
| Filename | modeM0/AS1A12_018T01_9000005470_39377cztM0_level2.fits | modeM0/AS1A12_018T01_9000005470_39377cztM0_level2_quad_clean.evt |
| Size (bytes) | 1,097,202,240 | 214,827,840 |
| Size | 1.0 GB | 204.9 MB |
| Events in quadrant A | 6,596,442 | 1,535,494 |
| Events in quadrant B | 8,688,928 | 1,513,966 |
| Events in quadrant C | 7,302,348 | 1,439,208 |
| Events in quadrant D | 17,014,676 | 1,111,099 |
| Mode M9 | |||
|---|---|---|---|
| Quadrant | BADHDUFLAG | Total packets | Discarded packets |
| A | 0 | 62 | 0 |
| B | 0 | 62 | 0 |
| C | 0 | 62 | 0 |
| D | 0 | 62 | 0 |
| Mode SS | |||
|---|---|---|---|
| Quadrant | BADHDUFLAG | Total packets | Discarded packets |
| A | 0 | 268 | 0 |
| B | 0 | 268 | 0 |
| C | 0 | 268 | 0 |
| D | 0 | 268 | 0 |
| Mode M0 | |||
|---|---|---|---|
| Quadrant | BADHDUFLAG | Total packets | Discarded packets |
| A | 0 | 27303 | 3 |
| B | 0 | 34818 | 2 |
| C | 0 | 30118 | 4 |
| D | 0 | 59717 | 2 |
| Quadrant | Total seconds | Saturated seconds | Saturation percentage |
|---|---|---|---|
| A | 13096 | 22 | 0.167990% |
| B | 13096 | 646 | 4.932804% |
| C | 13095 | 294 | 2.245132% |
| D | 13096 | 2947 | 22.503054% |
Noise dominated data is calculated using 1-second bins in cleaned event files. If a bin has >2000 counts, and if more than 50% of those come from <1% of pixels, then it is considered to be noise-dominated and hence unusable.
| Quadrant | # 1 sec bins | Bins with >0 counts | Bins with >2000 counts | High rate bins dominated by noise | Noise dominated (total time) | Noise dominated (detector-on time) | Marked lightcurve |
|---|---|---|---|---|---|---|---|
| A | 19286 | 13099 | 7 | 7 | 0.04% | 0.05% | 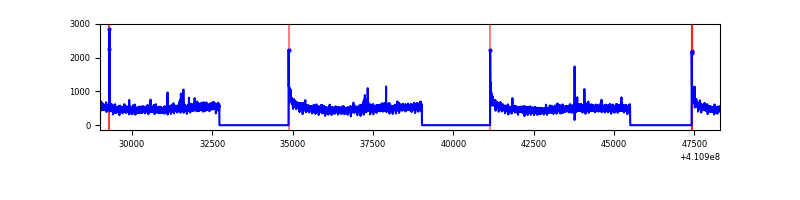 |
| B | 19286 | 13099 | 434 | 434 | 2.25% | 3.31% | 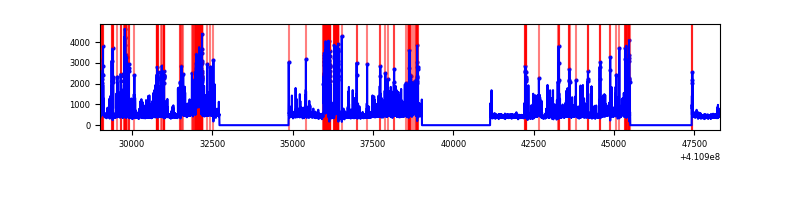 |
| C | 19286 | 13099 | 238 | 238 | 1.23% | 1.82% | 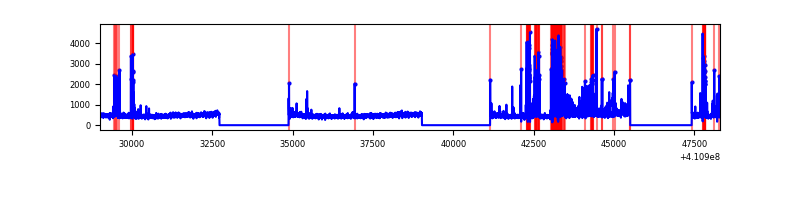 |
| D | 19286 | 13099 | 2536 | 2536 | 13.15% | 19.36% | 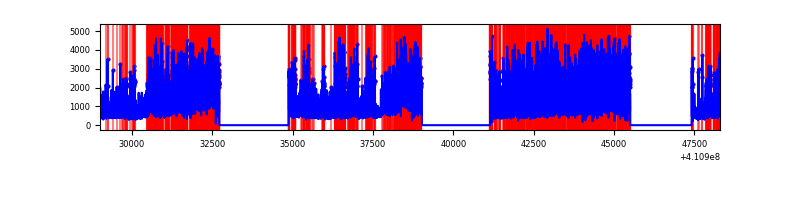 |
Top three noisy pixels from each quadrant. If the there are fewer than three noisy pixels in the level2.evt file, extra rows are filled as -1
| Pixel properties | Quadrant properties | ||||||
|---|---|---|---|---|---|---|---|
| Quadrant | DetID | PixID | Counts | Sigma | Mean | Median | Sigma |
| A | 10 | 83 | 916269 | 3147.16 | 1454 | 1428 | 290.7 |
| A | 13 | 248 | 19027 | 60.54 | 1454 | 1428 | 290.7 |
| A | 13 | 254 | 17750 | 56.15 | 1454 | 1428 | 290.7 |
| B | 5 | 172 | 1634506 | 6136.33 | 1411 | 1375 | 266.1 |
| B | 5 | 200 | 1229810 | 4615.73 | 1411 | 1375 | 266.1 |
| B | 4 | 170 | 179308 | 668.57 | 1411 | 1375 | 266.1 |
| C | 14 | 254 | 1246299 | 3947.51 | 1377 | 1384 | 315.4 |
| C | 15 | 214 | 536995 | 1698.37 | 1377 | 1384 | 315.4 |
| C | 9 | 187 | 87321 | 272.5 | 1377 | 1384 | 315.4 |
| D | 12 | 235 | 11315500 | 36904.96 | 1272 | 1235 | 306.6 |
| D | 13 | 249 | 364053 | 1183.44 | 1272 | 1235 | 306.6 |
| D | 6 | 239 | 191110 | 619.34 | 1272 | 1235 | 306.6 |
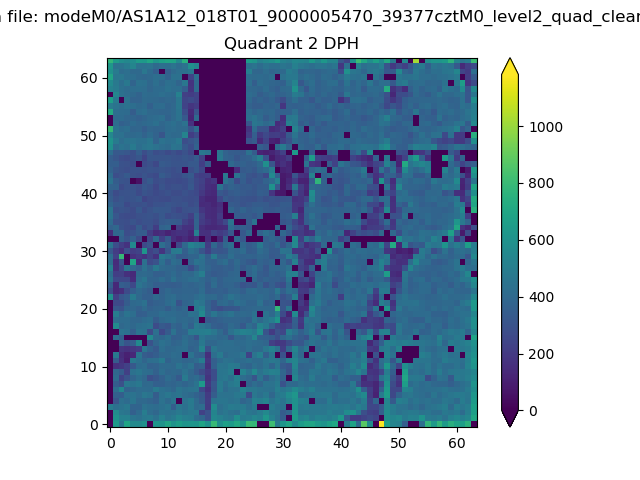
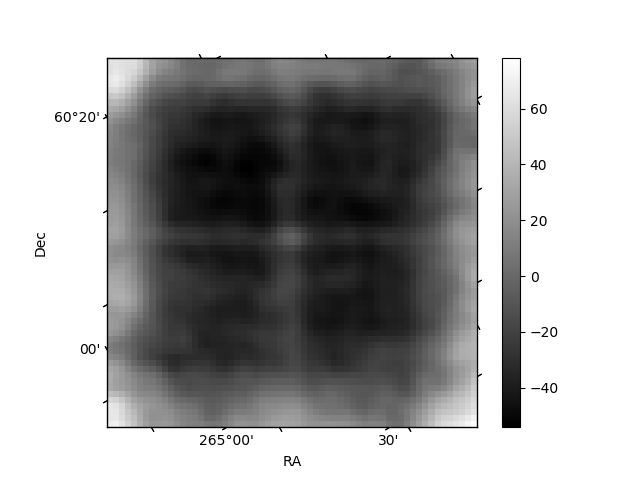
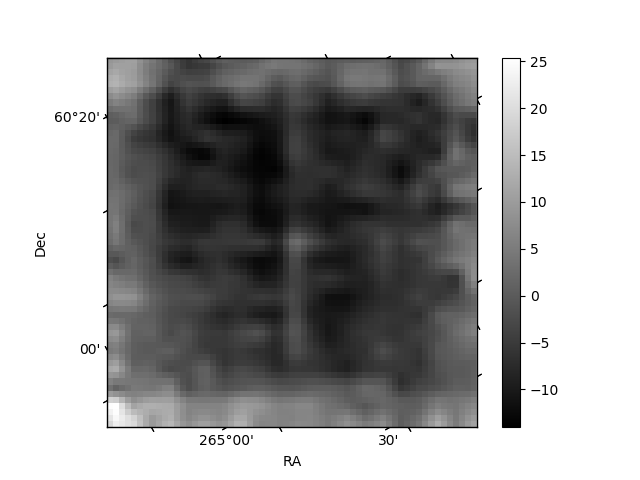
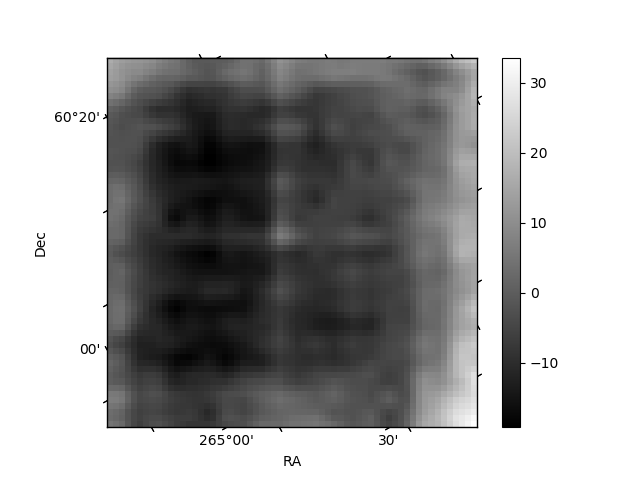
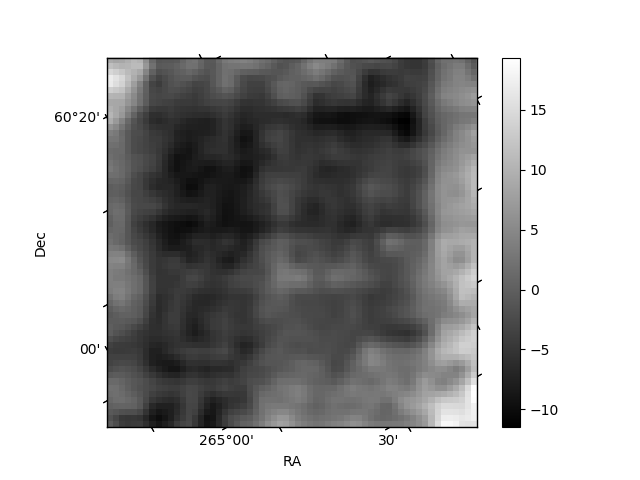
Histogram calculated using DETX and DETY for each event in the final _common_clean file
| Quadrant A | 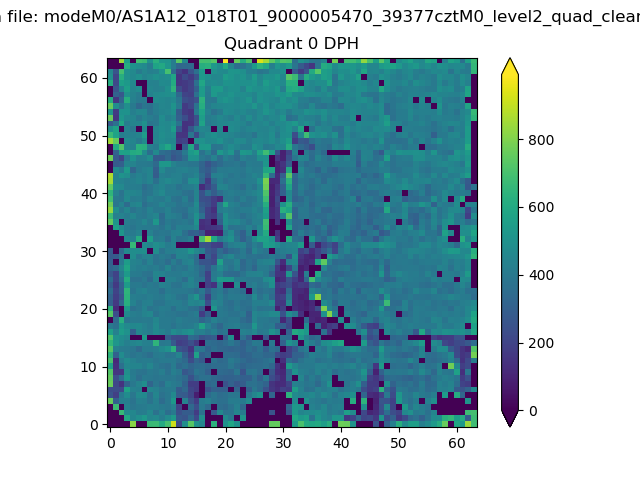 |
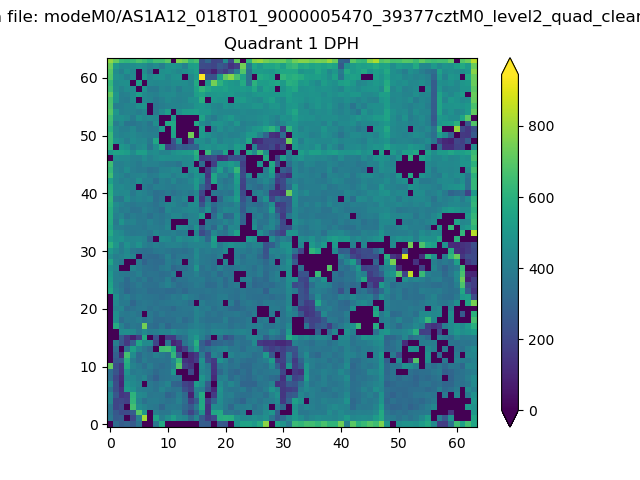 |
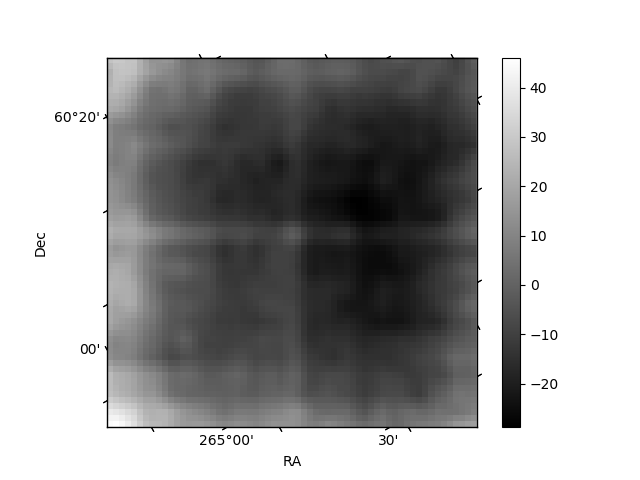
Quadrant B |
|---|---|---|---|
| Quadrant D | 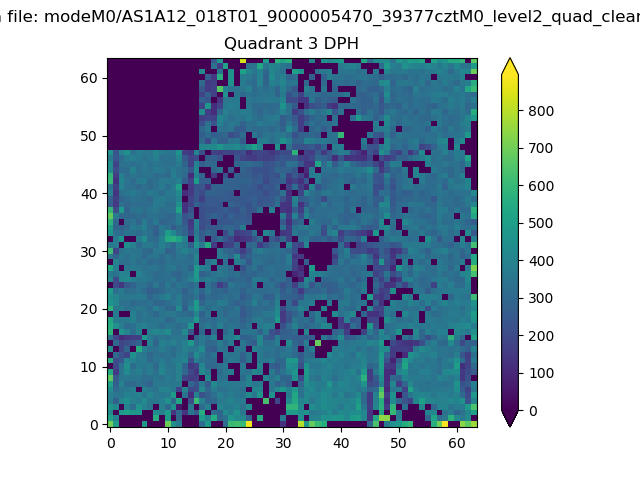 |
 |
Quadrant C |
| Plot type | Count rate plots | Images |
|---|---|---|
| Comparison with Poisson distribution Blue bars denote a histogram of data divided into 1 sec bins. Red curve is a Poisson curve with rate = median count rate of data. |
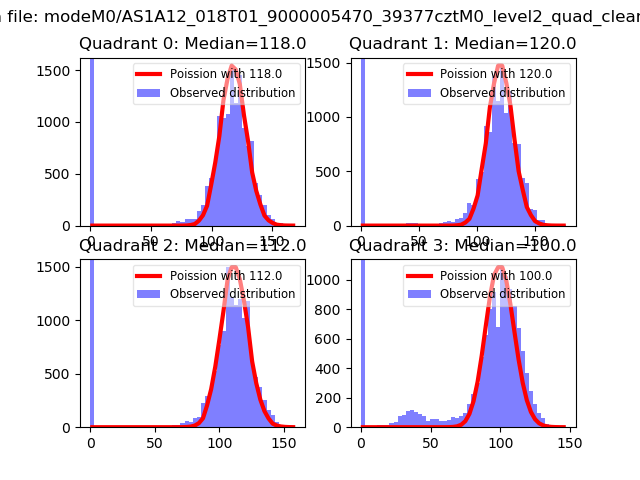 |
 |
| Quadrant-wise count rates Data is divided into 100 sec bins |
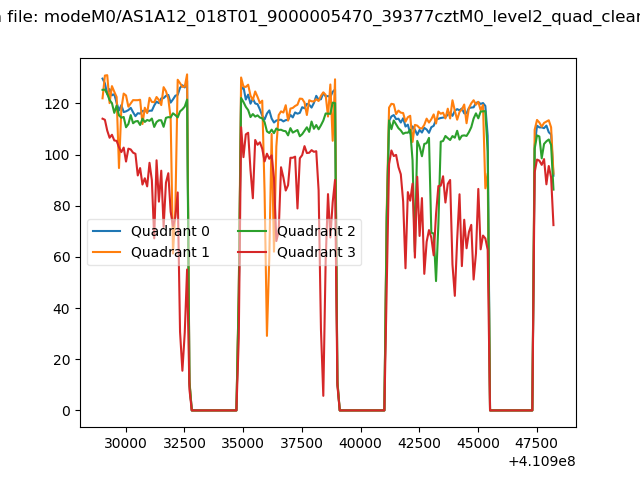 |
|
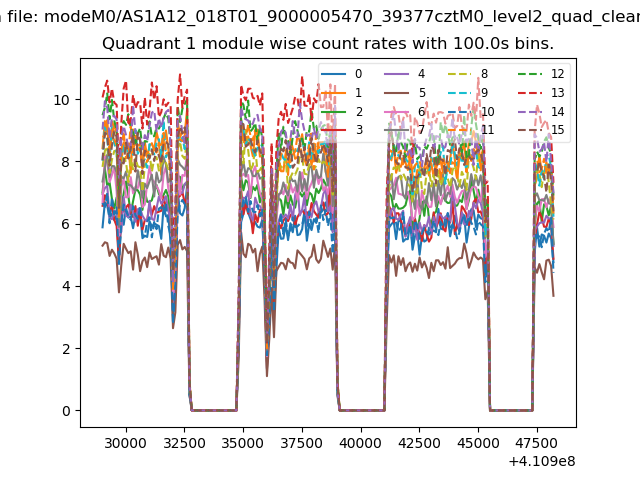
| Module-wise count rates for Quadrant A Data is divided into 100 sec bins |
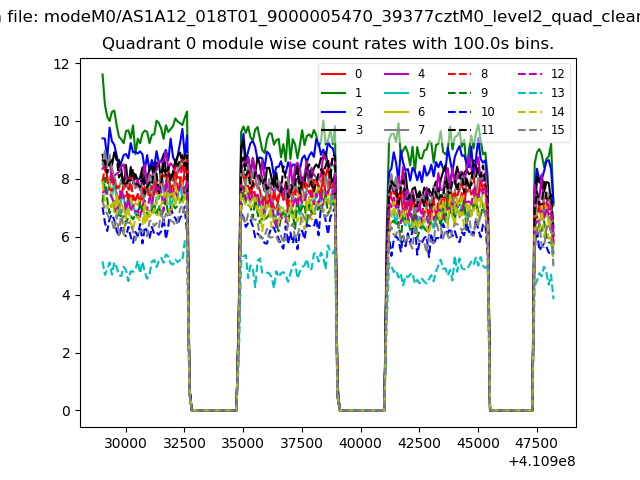 |
 |
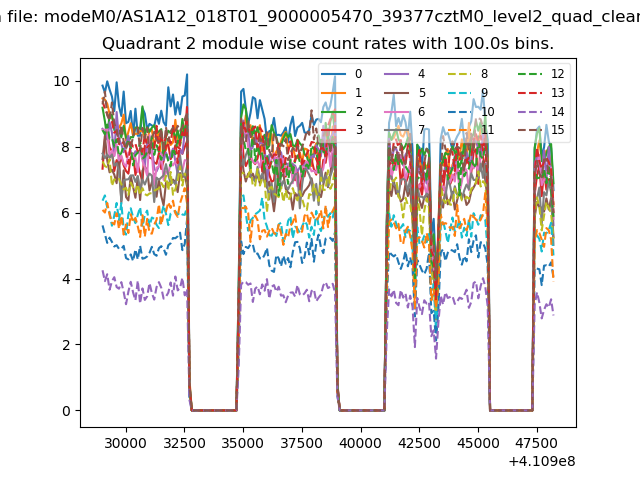
| Module-wise count rates for Quadrant B Data is divided into 100 sec bins |
 |
 |
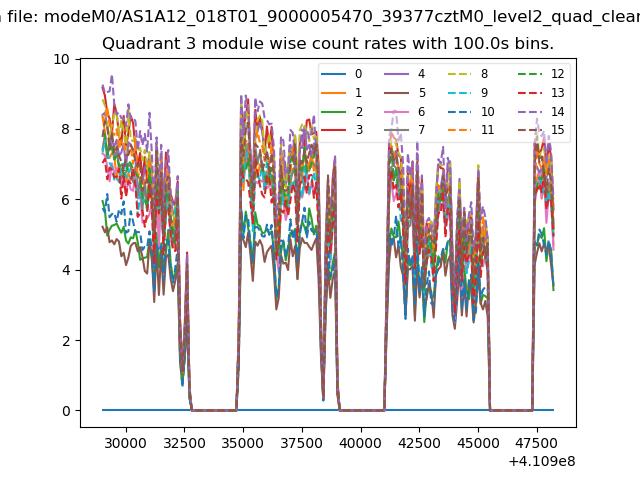
| Module-wise count rates for Quadrant C Data is divided into 100 sec bins |
 |
 |
| Module-wise count rates for Quadrant D Data is divided into 100 sec bins |
 |
 |
| Parameter | Plot |
|---|---|
| CZT HV Monitor | 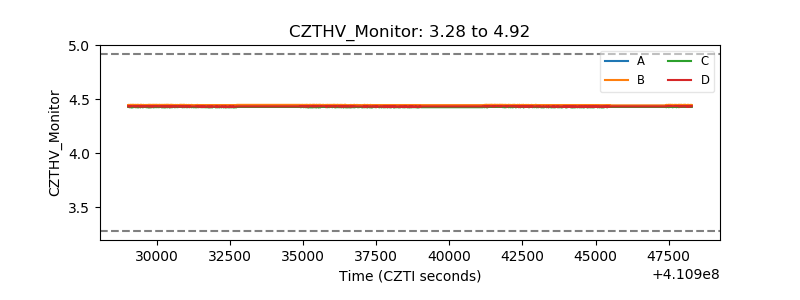 |
| D_VDD | 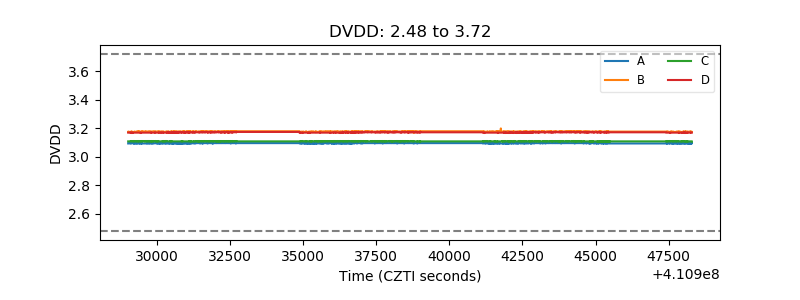 |
| Temperature 1 | 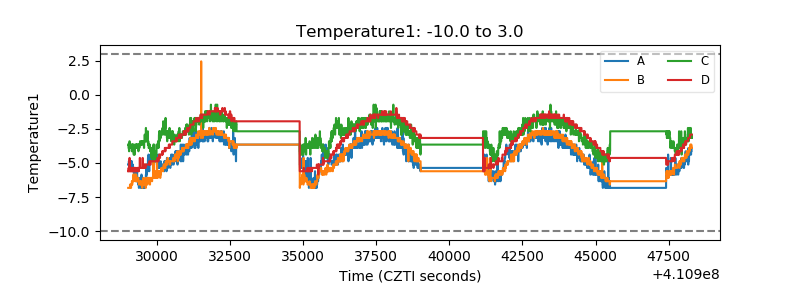 |
| Veto HV Monitor | 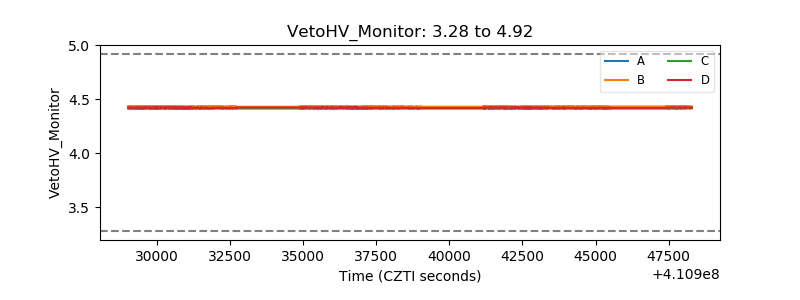 |
| Veto LLD | 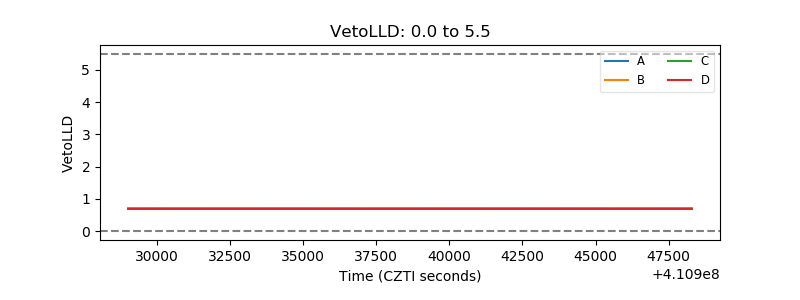 |
| Alpha Counter | 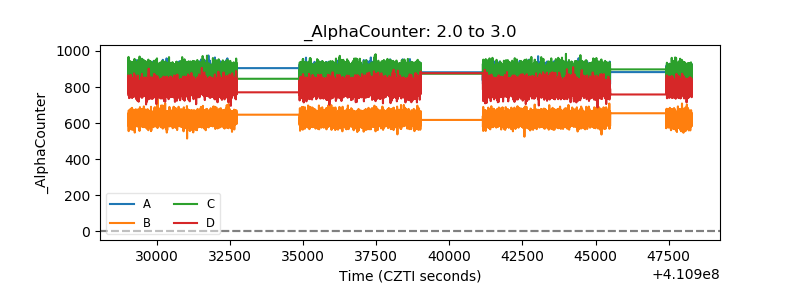 |
| _CPM_Rate | 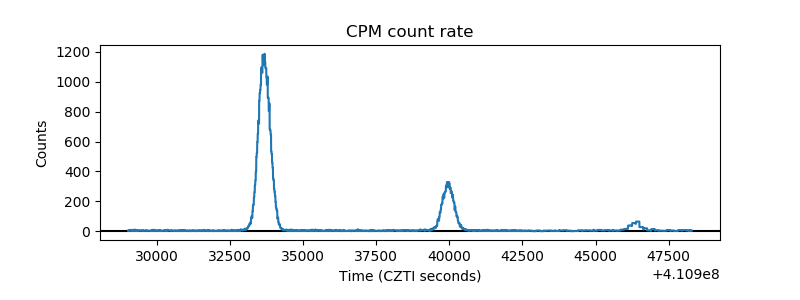 |
| CZT Counter | 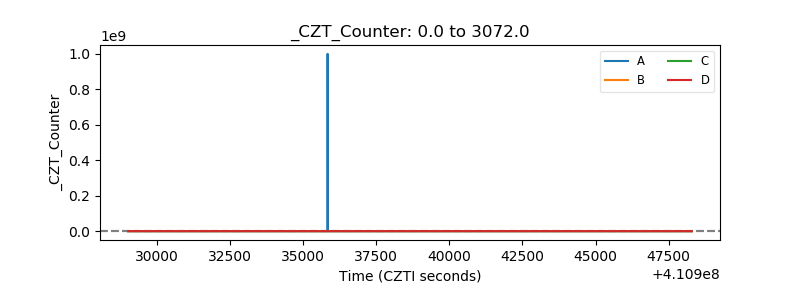 |
| +2.5 Volts monitor | 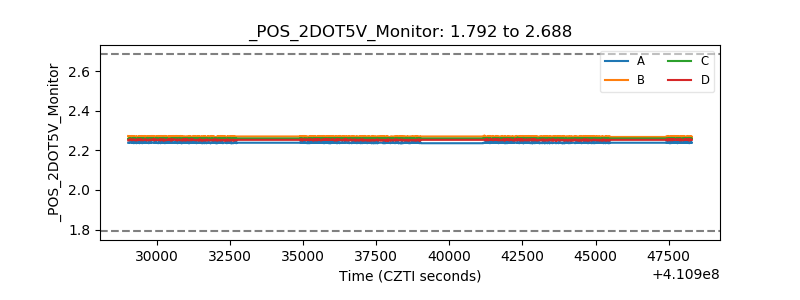 |
| +5 Volts monitor | 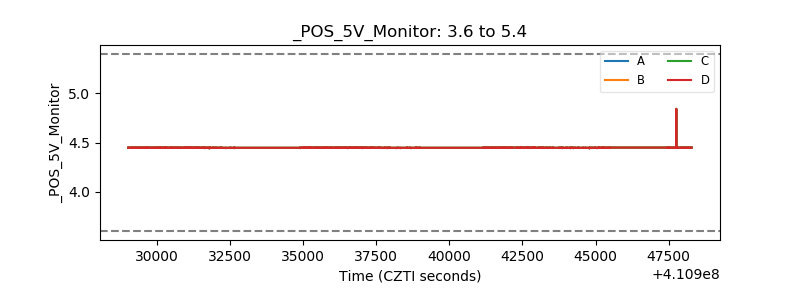 |
| _ROLL_ROT | 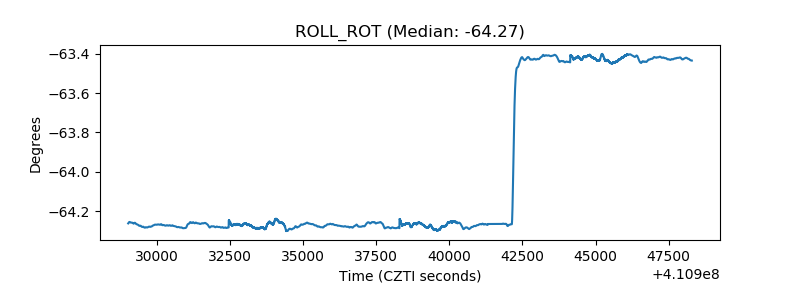 |
| _Roll_DEC | 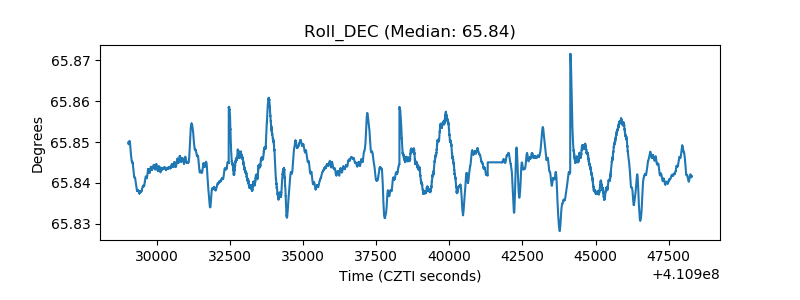 |
| _Roll_RA | 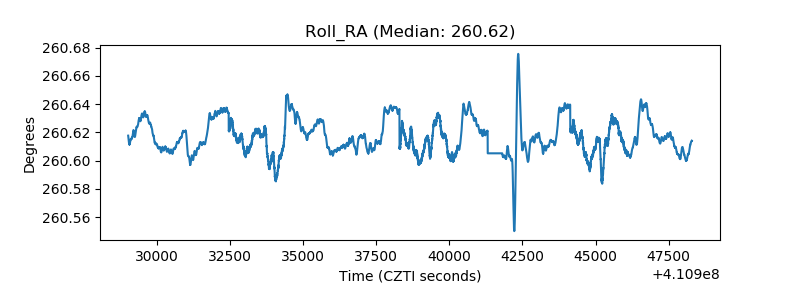 |
| Veto Counter | 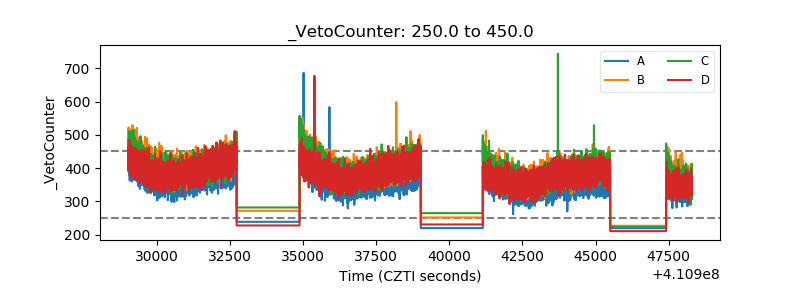 |