| Param | Original file | Final file |
|---|---|---|
| Filename | modeM0/AS1A12_018T01_9000005470_39378cztM0_level2.fits | modeM0/AS1A12_018T01_9000005470_39378cztM0_level2_quad_clean.evt |
| Size (bytes) | 463,628,160 | 87,546,240 |
| Size | 442.2 MB | 83.5 MB |
| Events in quadrant A | 2,794,593 | 621,745 |
| Events in quadrant B | 3,190,468 | 599,029 |
| Events in quadrant C | 3,718,999 | 589,525 |
| Events in quadrant D | 7,025,219 | 451,095 |
| Mode M9 | |||
|---|---|---|---|
| Quadrant | BADHDUFLAG | Total packets | Discarded packets |
| A | 0 | 24 | 0 |
| B | 0 | 24 | 0 |
| C | 0 | 24 | 0 |
| D | 0 | 25 | 0 |
| Mode SS | |||
|---|---|---|---|
| Quadrant | BADHDUFLAG | Total packets | Discarded packets |
| A | 0 | 112 | 0 |
| B | 0 | 112 | 0 |
| C | 0 | 112 | 0 |
| D | 0 | 112 | 0 |
| Mode M0 | |||
|---|---|---|---|
| Quadrant | BADHDUFLAG | Total packets | Discarded packets |
| A | 0 | 11651 | 2 |
| B | 0 | 13372 | 1 |
| C | 0 | 14697 | 1 |
| D | 0 | 24759 | 1 |
| Quadrant | Total seconds | Saturated seconds | Saturation percentage |
|---|---|---|---|
| A | 5567 | 15 | 0.269445% |
| B | 5567 | 324 | 5.820011% |
| C | 5567 | 59 | 1.059817% |
| D | 5567 | 1271 | 22.830968% |
Noise dominated data is calculated using 1-second bins in cleaned event files. If a bin has >2000 counts, and if more than 50% of those come from <1% of pixels, then it is considered to be noise-dominated and hence unusable.
| Quadrant | # 1 sec bins | Bins with >0 counts | Bins with >2000 counts | High rate bins dominated by noise | Noise dominated (total time) | Noise dominated (detector-on time) | Marked lightcurve |
|---|---|---|---|---|---|---|---|
| A | 7150 | 5568 | 5 | 5 | 0.07% | 0.09% | 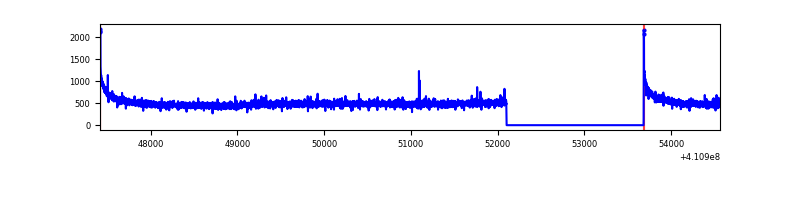 |
| B | 7150 | 5568 | 269 | 269 | 3.76% | 4.83% | 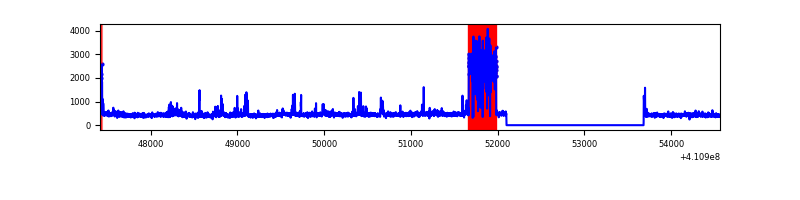 |
| C | 7150 | 5568 | 68 | 68 | 0.95% | 1.22% | 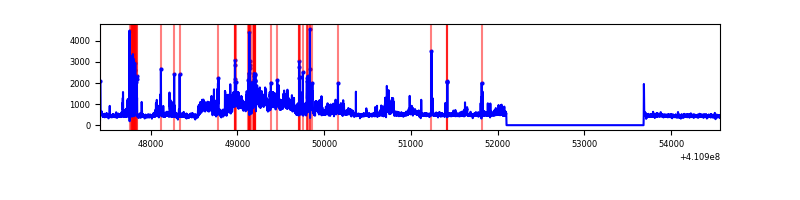 |
| D | 7150 | 5568 | 1075 | 1075 | 15.03% | 19.31% | 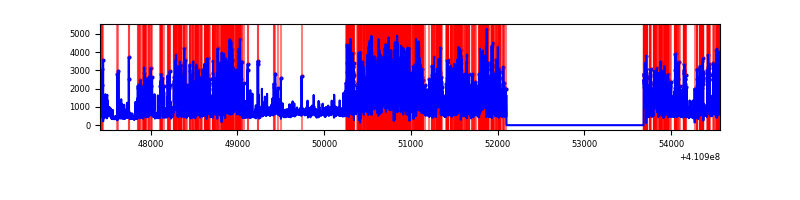 |
Top three noisy pixels from each quadrant. If the there are fewer than three noisy pixels in the level2.evt file, extra rows are filled as -1
| Pixel properties | Quadrant properties | ||||||
|---|---|---|---|---|---|---|---|
| Quadrant | DetID | PixID | Counts | Sigma | Mean | Median | Sigma |
| A | 10 | 83 | 440263 | 3578.16 | 606 | 594 | 122.9 |
| A | 13 | 254 | 7598 | 57.0 | 606 | 594 | 122.9 |
| A | 3 | 137 | 6582 | 48.73 | 606 | 594 | 122.9 |
| B | 5 | 200 | 676896 | 6013.21 | 577 | 560 | 112.5 |
| B | 5 | 172 | 179994 | 1595.32 | 577 | 560 | 112.5 |
| B | 4 | 170 | 41779 | 366.47 | 577 | 560 | 112.5 |
| C | 9 | 187 | 960324 | 7055.12 | 583 | 586 | 136.0 |
| C | 15 | 214 | 234854 | 1722.13 | 583 | 586 | 136.0 |
| C | 14 | 254 | 216890 | 1590.07 | 583 | 586 | 136.0 |
| D | 12 | 235 | 4329443 | 33293.26 | 532 | 514 | 130.0 |
| D | 13 | 249 | 199114 | 1527.41 | 532 | 514 | 130.0 |
| D | 7 | 38 | 141053 | 1080.87 | 532 | 514 | 130.0 |
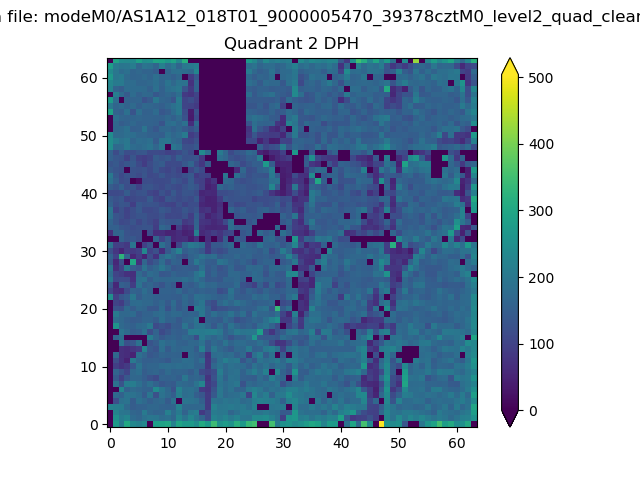
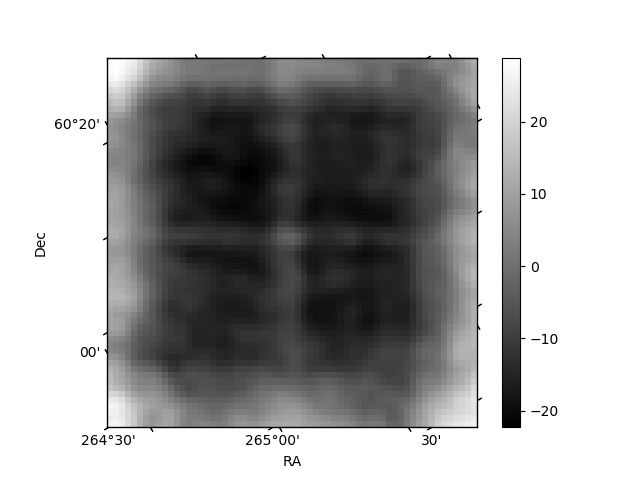
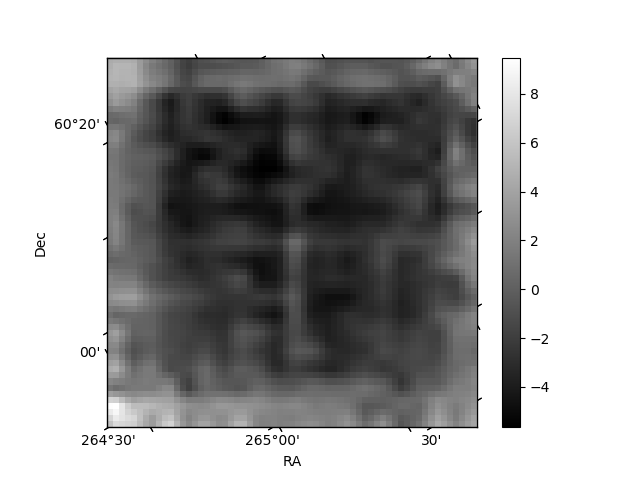
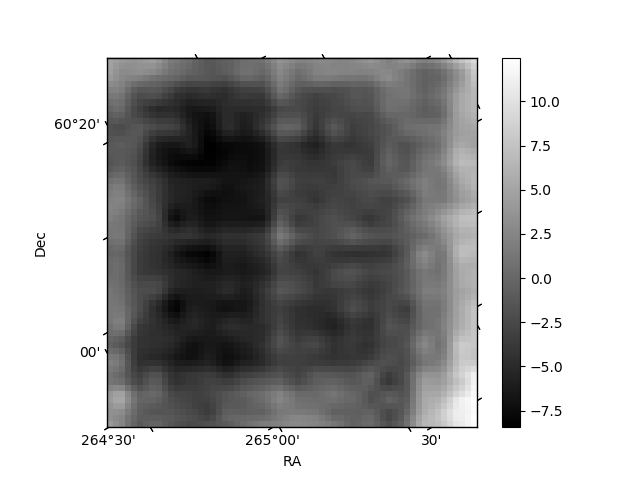
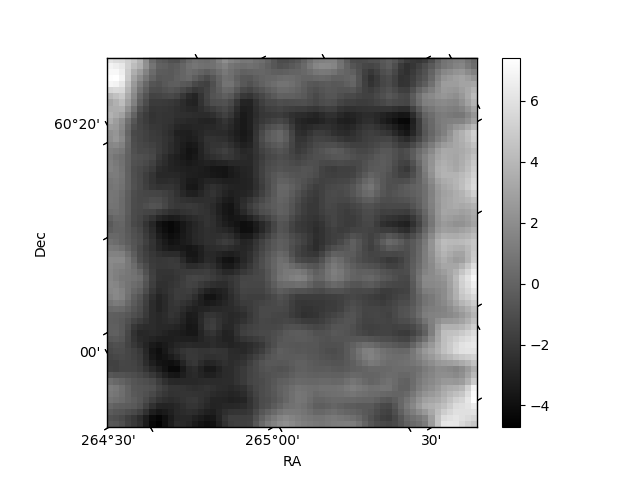
Histogram calculated using DETX and DETY for each event in the final _common_clean file
| Quadrant A | 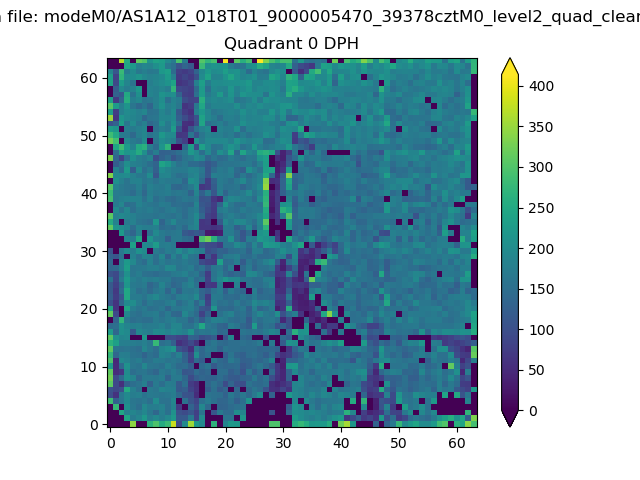 |
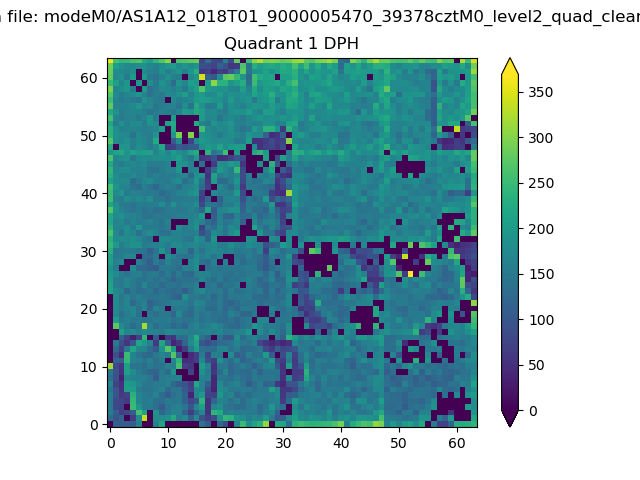 |
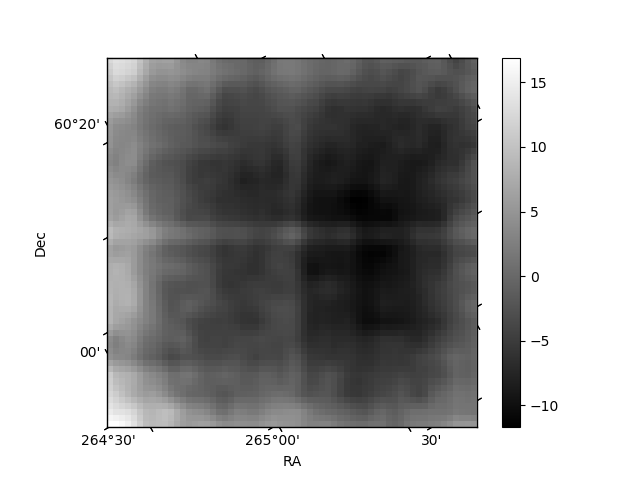
Quadrant B |
|---|---|---|---|
| Quadrant D | 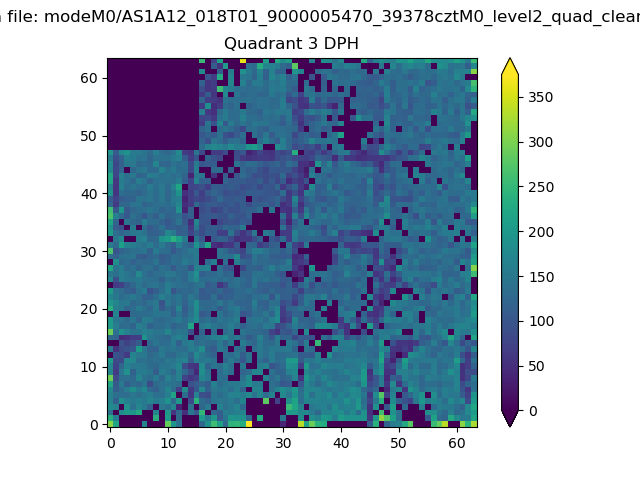 |
 |
Quadrant C |
| Plot type | Count rate plots | Images |
|---|---|---|
| Comparison with Poisson distribution Blue bars denote a histogram of data divided into 1 sec bins. Red curve is a Poisson curve with rate = median count rate of data. |
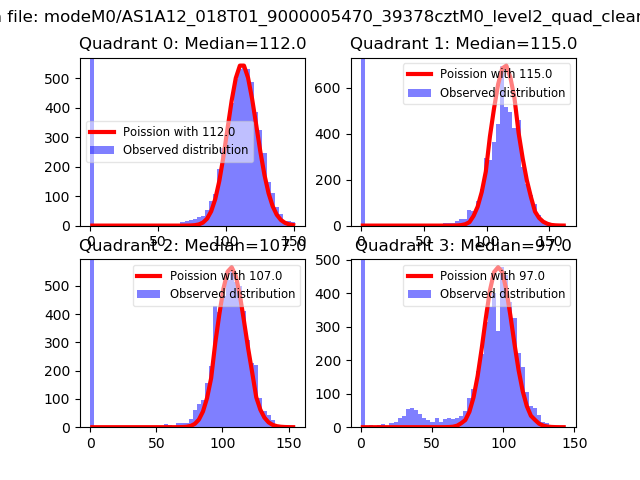 |
 |
| Quadrant-wise count rates Data is divided into 100 sec bins |
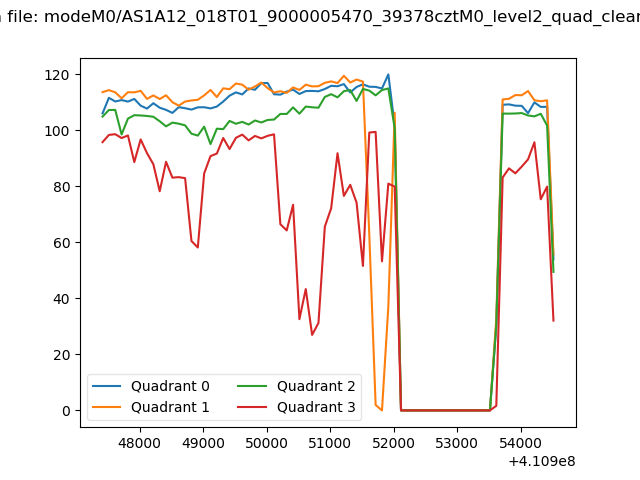 |
|
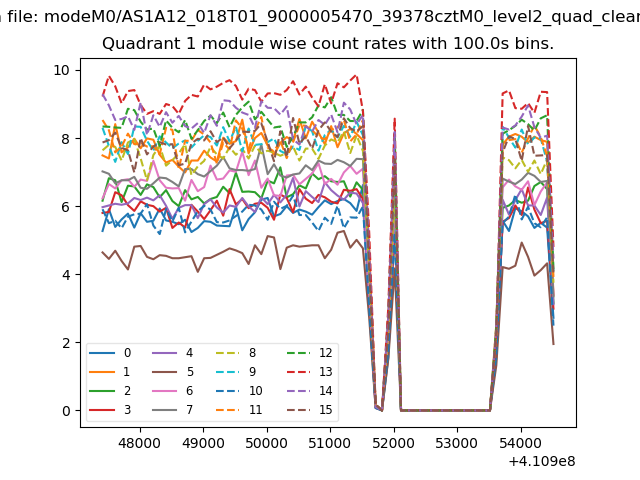
| Module-wise count rates for Quadrant A Data is divided into 100 sec bins |
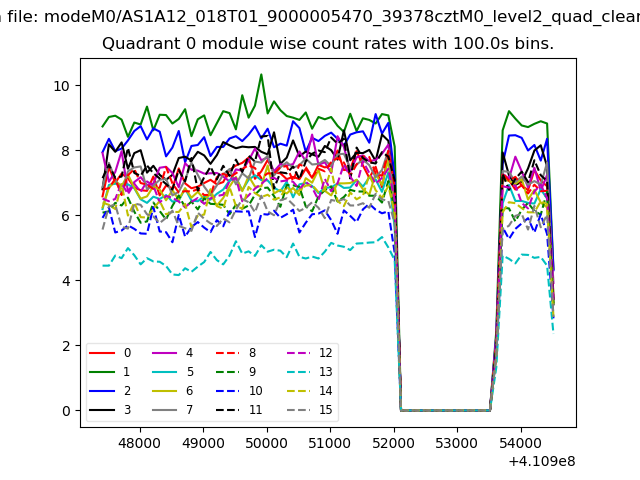 |
 |
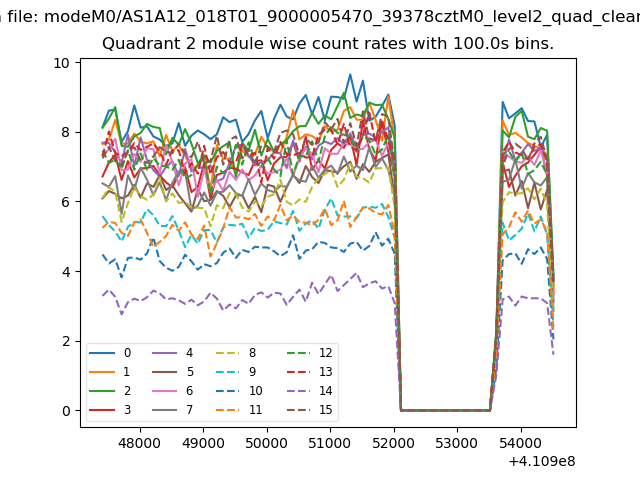
| Module-wise count rates for Quadrant B Data is divided into 100 sec bins |
 |
 |
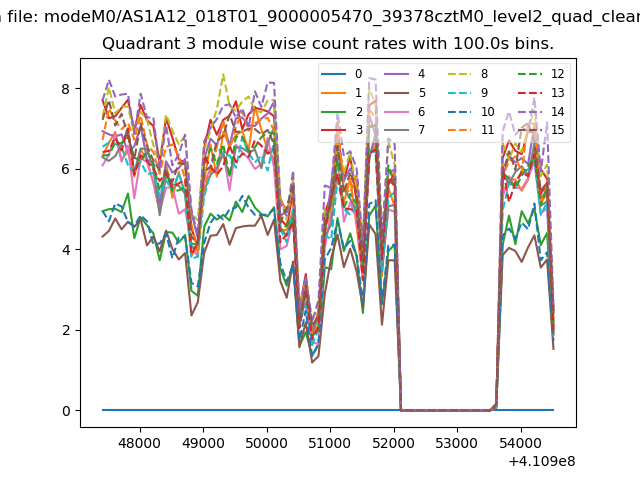
| Module-wise count rates for Quadrant C Data is divided into 100 sec bins |
 |
 |
| Module-wise count rates for Quadrant D Data is divided into 100 sec bins |
 |
 |
| Parameter | Plot |
|---|---|
| CZT HV Monitor | 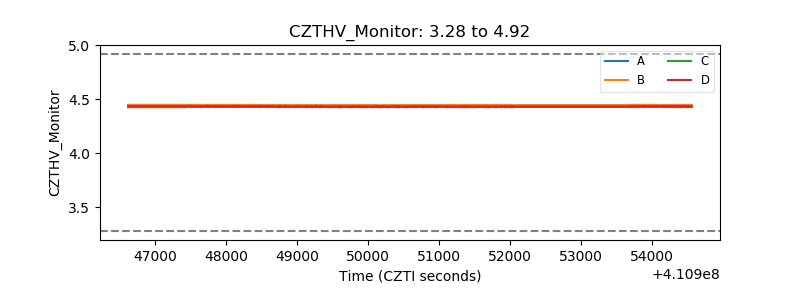 |
| D_VDD | 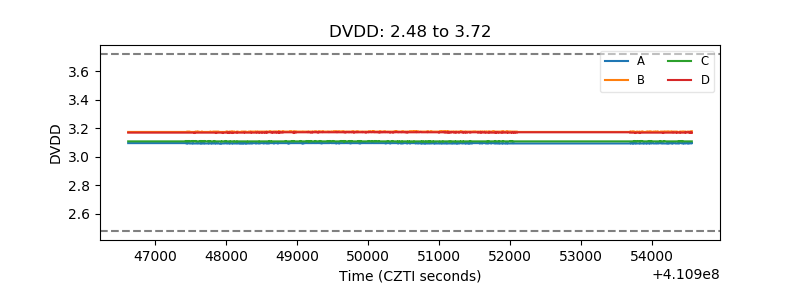 |
| Temperature 1 | 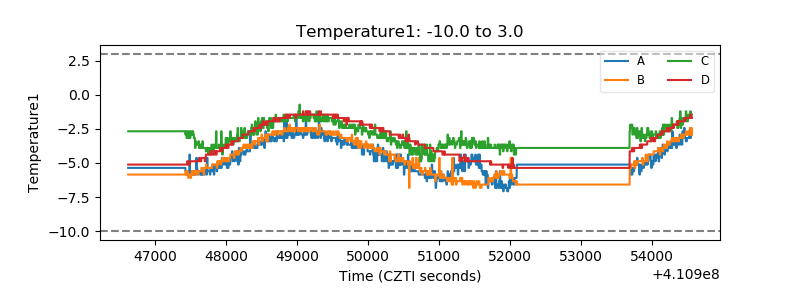 |
| Veto HV Monitor | 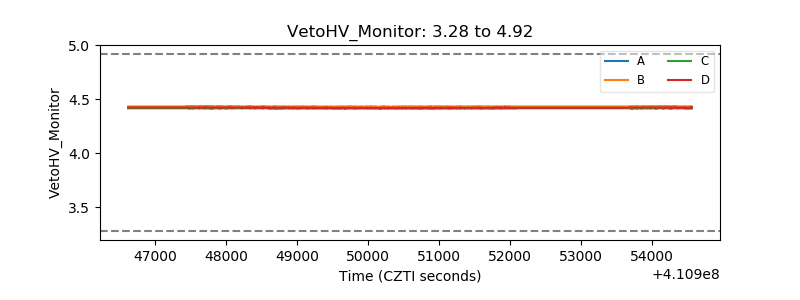 |
| Veto LLD | 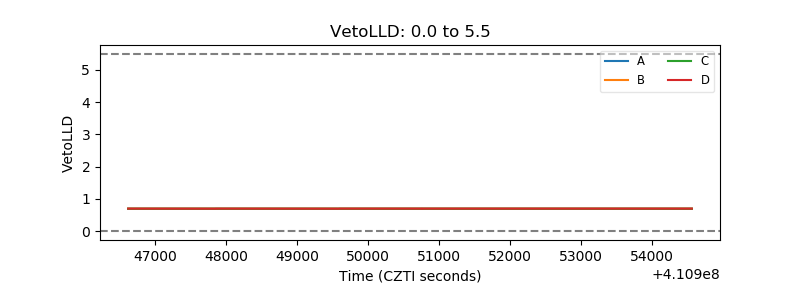 |
| Alpha Counter | 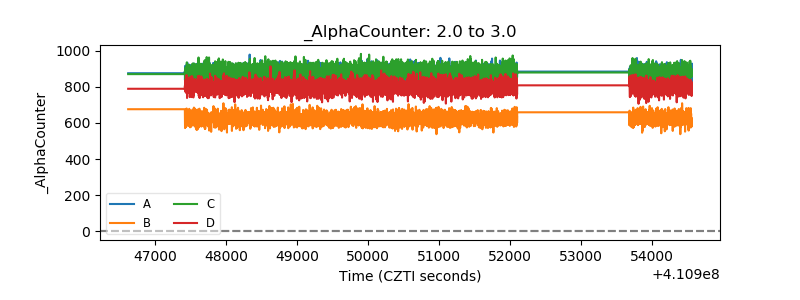 |
| _CPM_Rate | 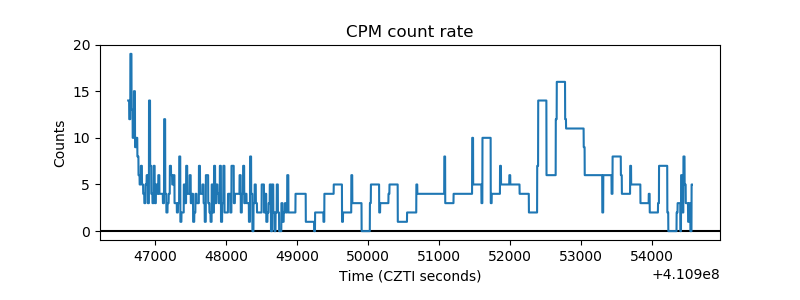 |
| CZT Counter | 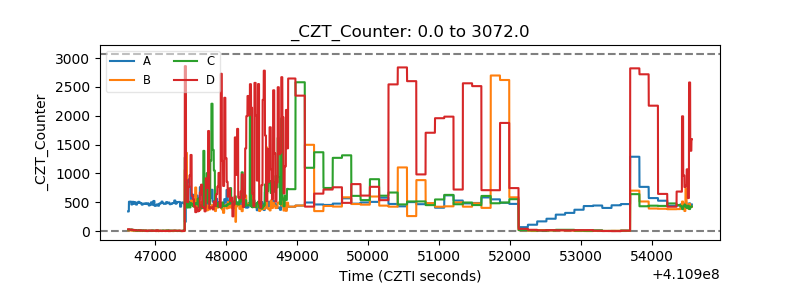 |
| +2.5 Volts monitor | 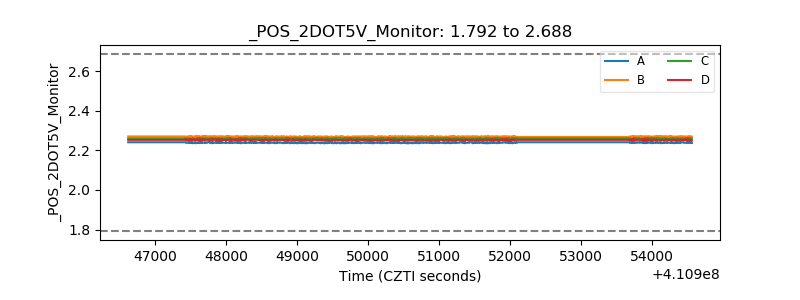 |
| +5 Volts monitor | 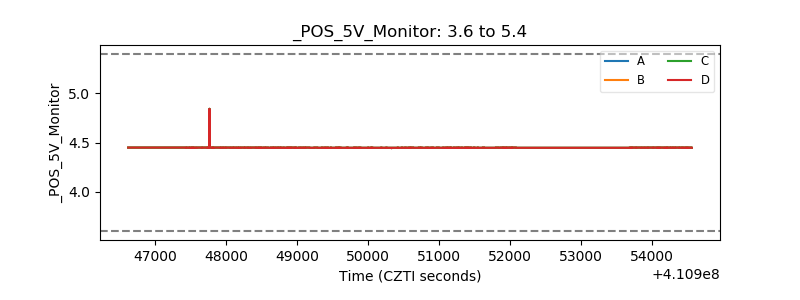 |
| _ROLL_ROT | 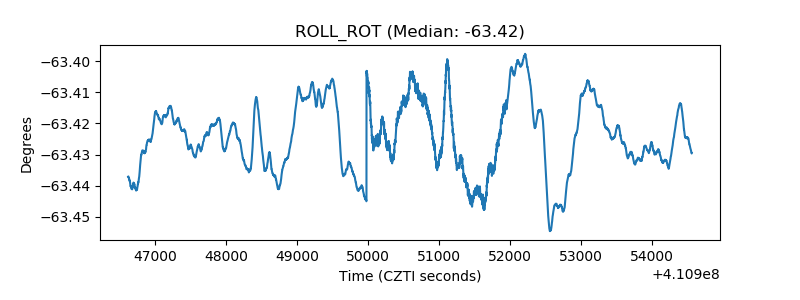 |
| _Roll_DEC | 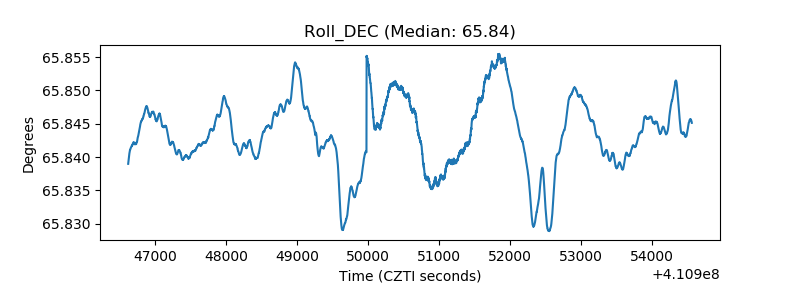 |
| _Roll_RA | 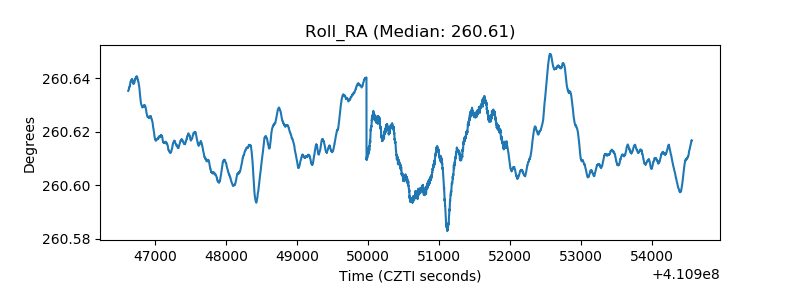 |
| Veto Counter | 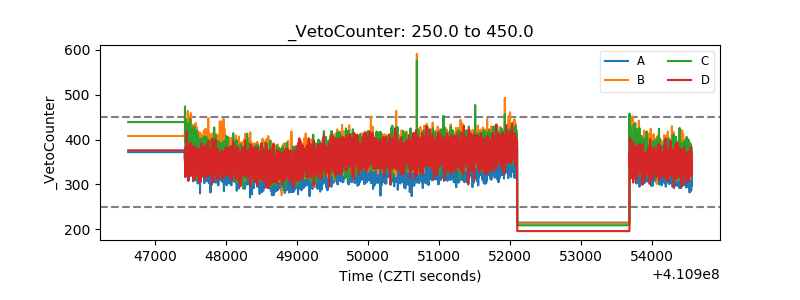 |