| Param | Original file | Final file |
|---|---|---|
| Filename | modeM0/AS1A12_018T01_9000005470_39379cztM0_level2.fits | modeM0/AS1A12_018T01_9000005470_39379cztM0_level2_quad_clean.evt |
| Size (bytes) | 543,620,160 | 88,009,920 |
| Size | 518.4 MB | 83.9 MB |
| Events in quadrant A | 2,887,396 | 644,015 |
| Events in quadrant B | 4,054,086 | 627,061 |
| Events in quadrant C | 2,747,432 | 616,498 |
| Events in quadrant D | 9,983,800 | 372,195 |
| Mode M9 | |||
|---|---|---|---|
| Quadrant | BADHDUFLAG | Total packets | Discarded packets |
| A | 0 | 14 | 0 |
| B | 0 | 14 | 0 |
| C | 0 | 14 | 0 |
| D | 0 | 14 | 0 |
| Mode SS | |||
|---|---|---|---|
| Quadrant | BADHDUFLAG | Total packets | Discarded packets |
| A | 0 | 116 | 0 |
| B | 0 | 116 | 0 |
| C | 0 | 116 | 0 |
| D | 0 | 116 | 0 |
| Mode M0 | |||
|---|---|---|---|
| Quadrant | BADHDUFLAG | Total packets | Discarded packets |
| A | 0 | 12039 | 2 |
| B | 0 | 15974 | 1 |
| C | 0 | 11842 | 1 |
| D | 0 | 33699 | 1 |
| Quadrant | Total seconds | Saturated seconds | Saturation percentage |
|---|---|---|---|
| A | 5795 | 8 | 0.138050% |
| B | 5795 | 362 | 6.246764% |
| C | 5795 | 4 | 0.069025% |
| D | 5795 | 2470 | 42.622951% |
Noise dominated data is calculated using 1-second bins in cleaned event files. If a bin has >2000 counts, and if more than 50% of those come from <1% of pixels, then it is considered to be noise-dominated and hence unusable.
| Quadrant | # 1 sec bins | Bins with >0 counts | Bins with >2000 counts | High rate bins dominated by noise | Noise dominated (total time) | Noise dominated (detector-on time) | Marked lightcurve |
|---|---|---|---|---|---|---|---|
| A | 7138 | 5796 | 3 | 3 | 0.04% | 0.05% | 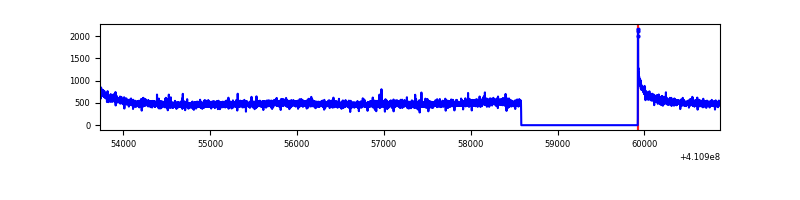 |
| B | 7138 | 5796 | 216 | 216 | 3.03% | 3.73% | 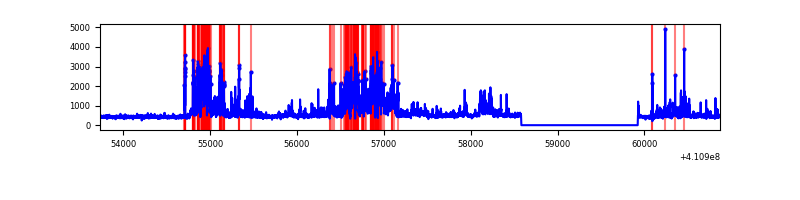 |
| C | 7138 | 5796 | 2 | 2 | 0.03% | 0.03% | 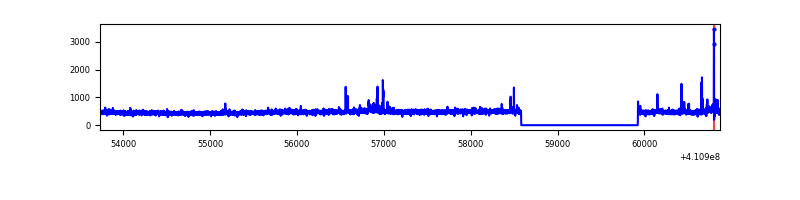 |
| D | 7138 | 5796 | 2029 | 2029 | 28.43% | 35.01% | 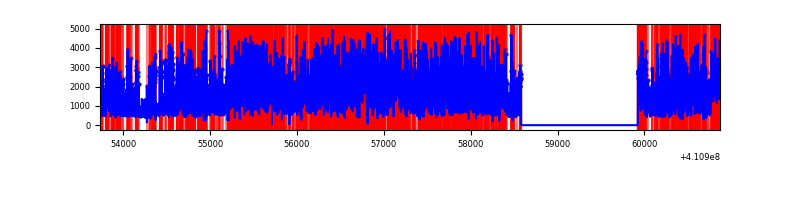 |
Top three noisy pixels from each quadrant. If the there are fewer than three noisy pixels in the level2.evt file, extra rows are filled as -1
| Pixel properties | Quadrant properties | ||||||
|---|---|---|---|---|---|---|---|
| Quadrant | DetID | PixID | Counts | Sigma | Mean | Median | Sigma |
| A | 10 | 83 | 430867 | 3341.67 | 633 | 620 | 128.8 |
| A | 13 | 254 | 8013 | 57.42 | 633 | 620 | 128.8 |
| A | 3 | 137 | 6867 | 48.52 | 633 | 620 | 128.8 |
| B | 5 | 200 | 1453837 | 12051.78 | 617 | 598 | 120.6 |
| B | 5 | 172 | 140298 | 1158.54 | 617 | 598 | 120.6 |
| B | 4 | 170 | 28324 | 229.93 | 617 | 598 | 120.6 |
| C | 15 | 214 | 244876 | 1707.63 | 613 | 617 | 143.0 |
| C | 9 | 187 | 58368 | 403.74 | 613 | 617 | 143.0 |
| C | 14 | 254 | 33593 | 230.54 | 613 | 617 | 143.0 |
| D | 12 | 235 | 7048947 | 56412.54 | 500 | 484 | 124.9 |
| D | 13 | 249 | 573314 | 4584.66 | 500 | 484 | 124.9 |
| D | 2 | 249 | 171972 | 1372.51 | 500 | 484 | 124.9 |
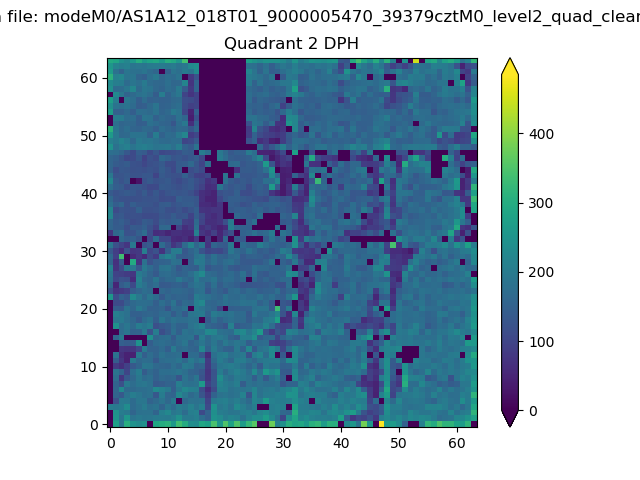
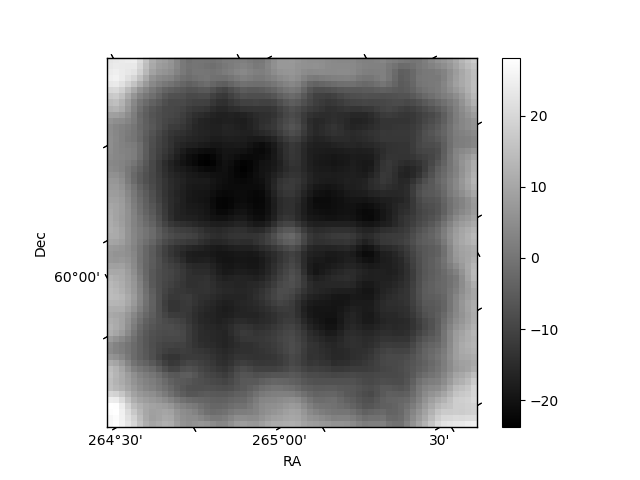
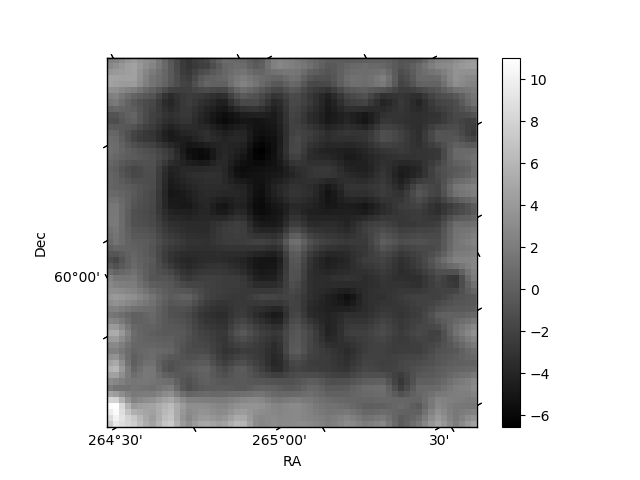
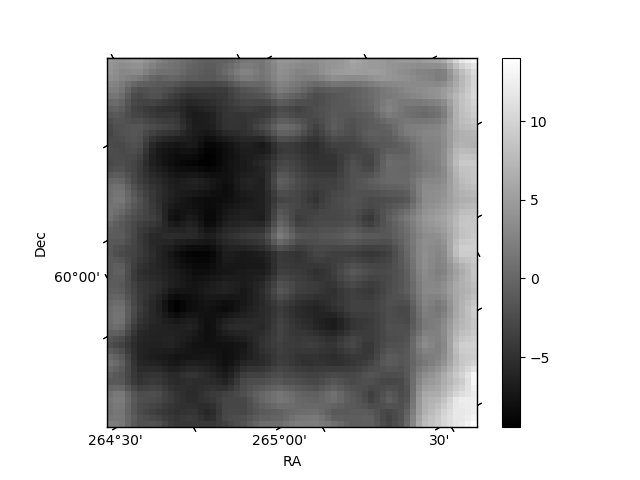
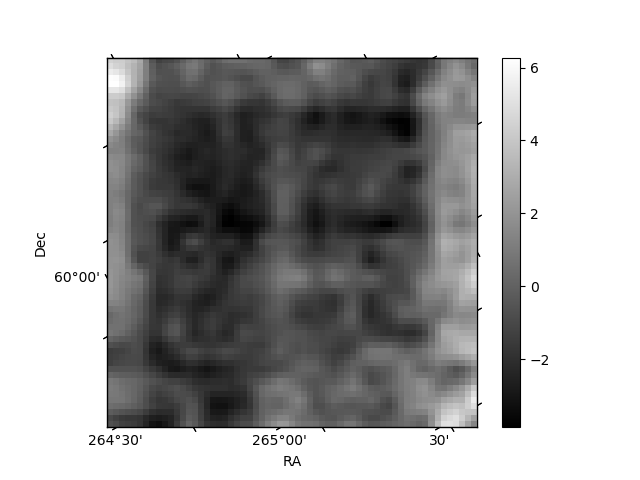
Histogram calculated using DETX and DETY for each event in the final _common_clean file
| Quadrant A | 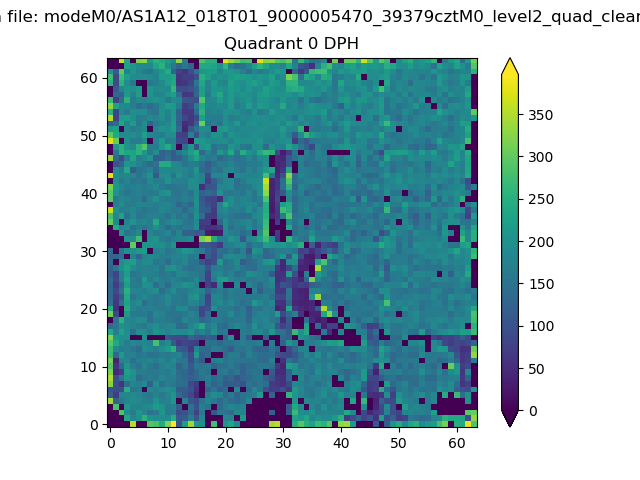 |
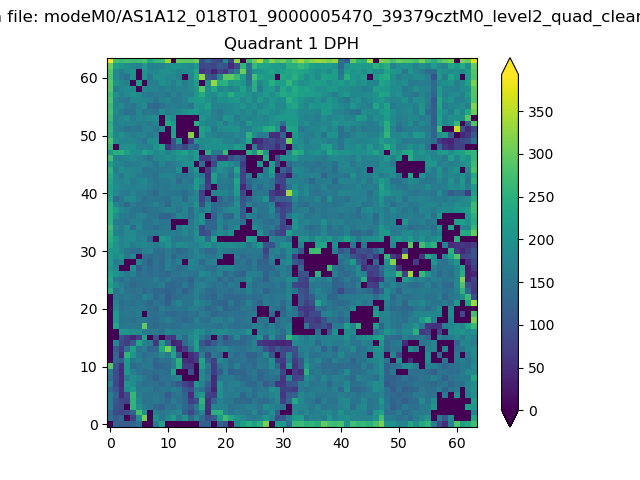 |
Quadrant B |
|---|---|---|---|
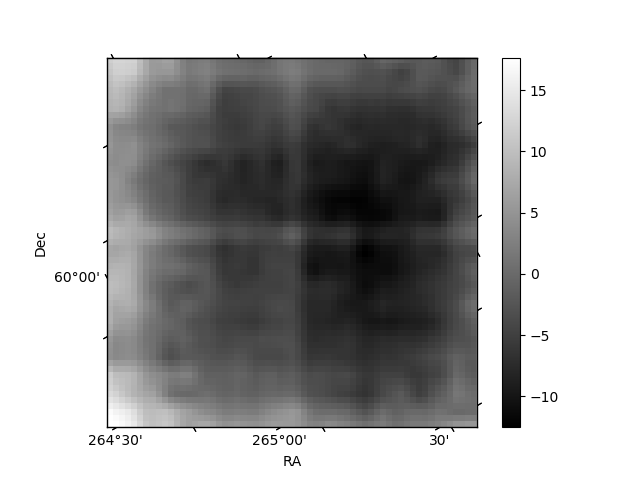
| Quadrant D | 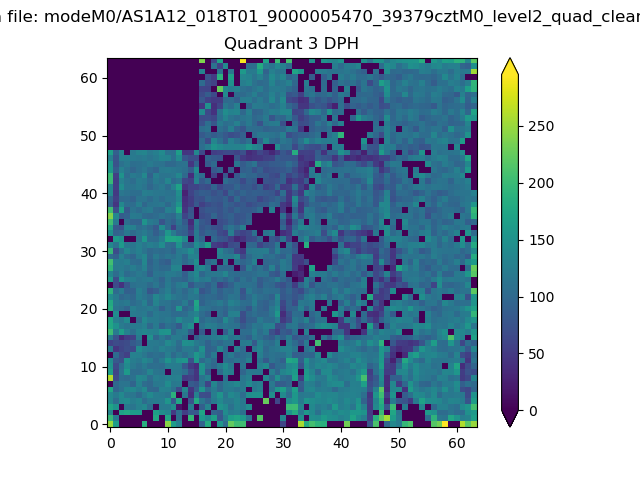 |
 |
Quadrant C |
| Plot type | Count rate plots | Images |
|---|---|---|
| Comparison with Poisson distribution Blue bars denote a histogram of data divided into 1 sec bins. Red curve is a Poisson curve with rate = median count rate of data. |
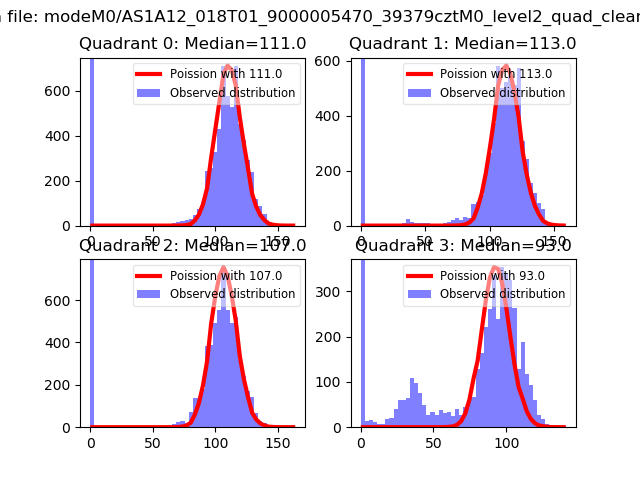 |
 |
| Quadrant-wise count rates Data is divided into 100 sec bins |
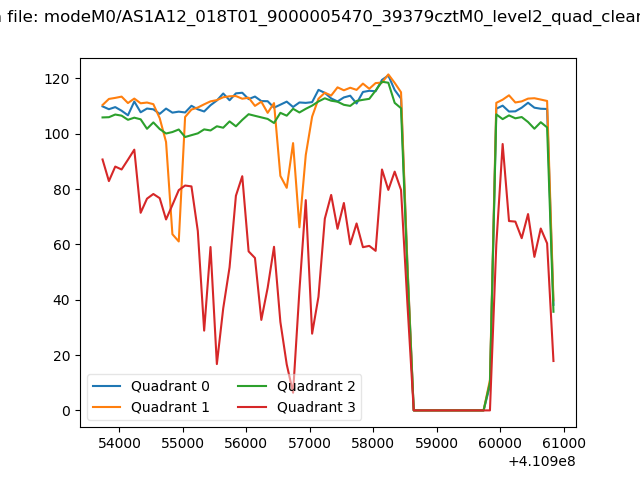 |
|
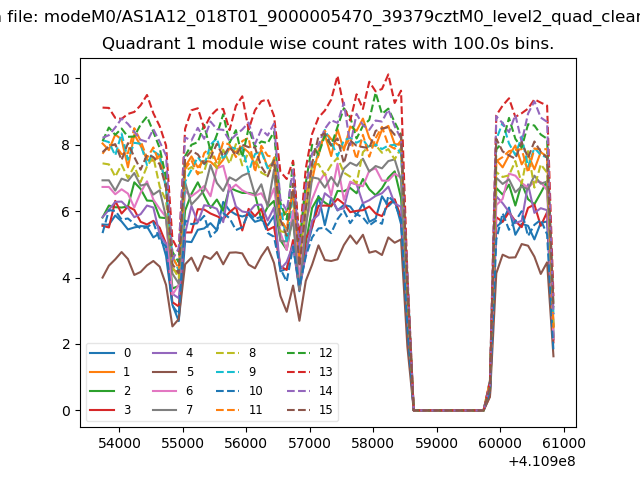
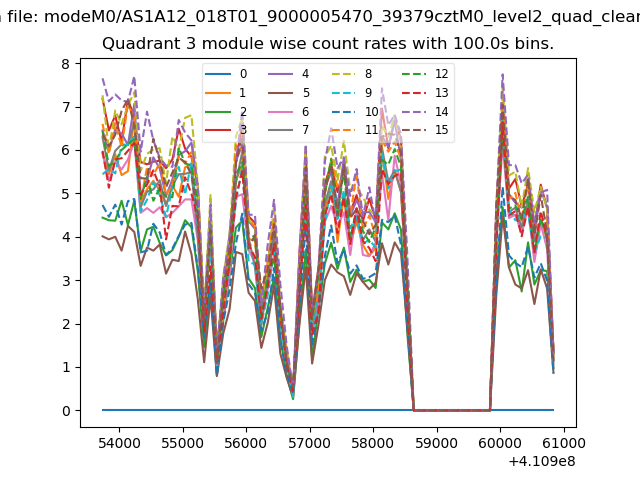
| Module-wise count rates for Quadrant A Data is divided into 100 sec bins |
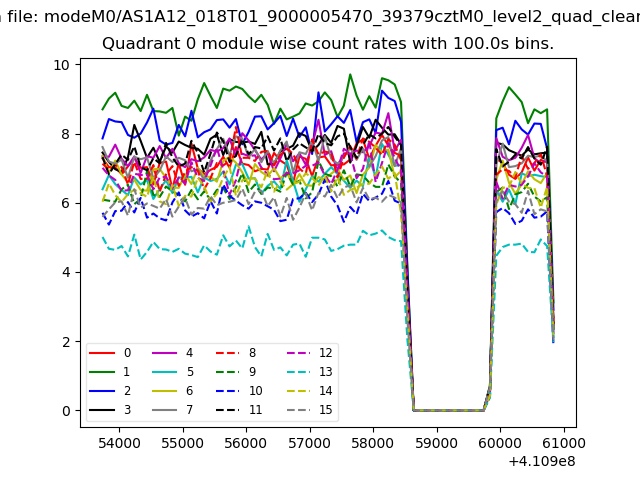 |
 |
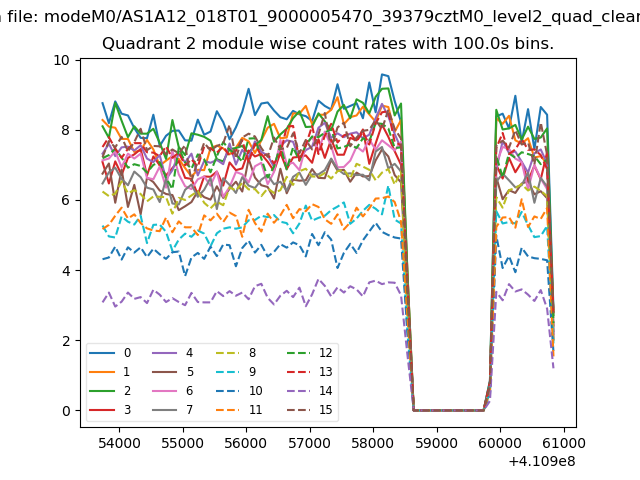
| Module-wise count rates for Quadrant B Data is divided into 100 sec bins |
 |
 |
| Module-wise count rates for Quadrant C Data is divided into 100 sec bins |
 |
 |
| Module-wise count rates for Quadrant D Data is divided into 100 sec bins |
 |
 |
| Parameter | Plot |
|---|---|
| CZT HV Monitor | 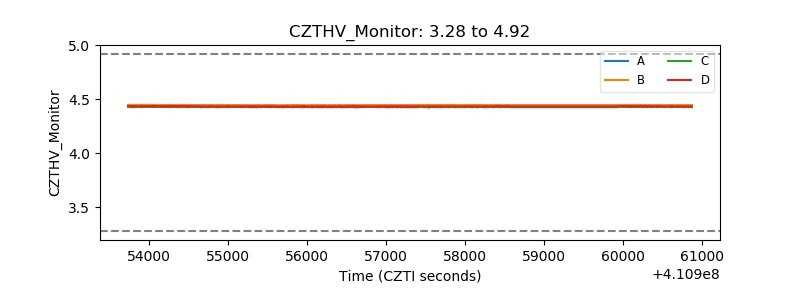 |
| D_VDD | 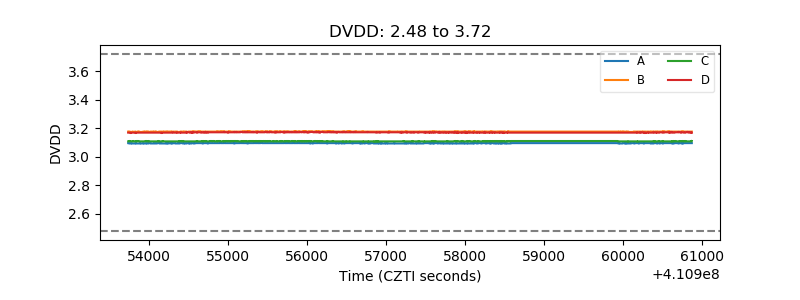 |
| Temperature 1 | 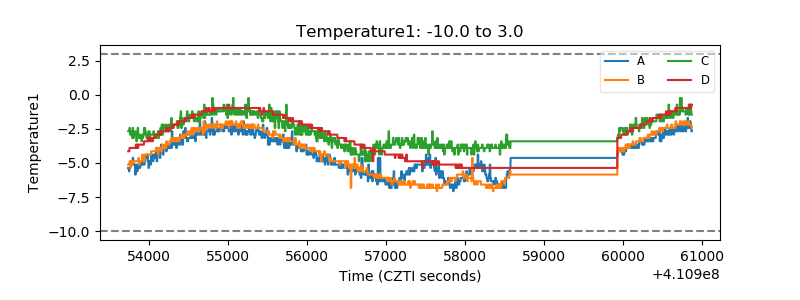 |
| Veto HV Monitor | 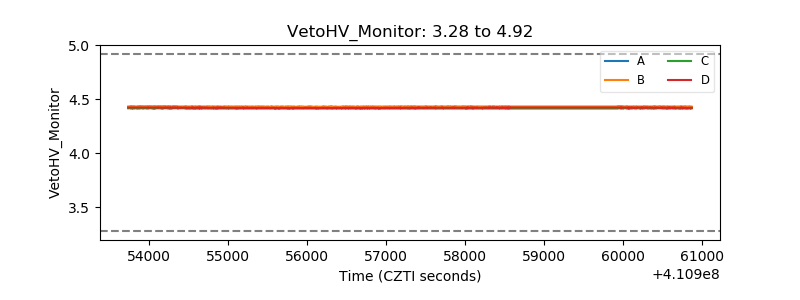 |
| Veto LLD | 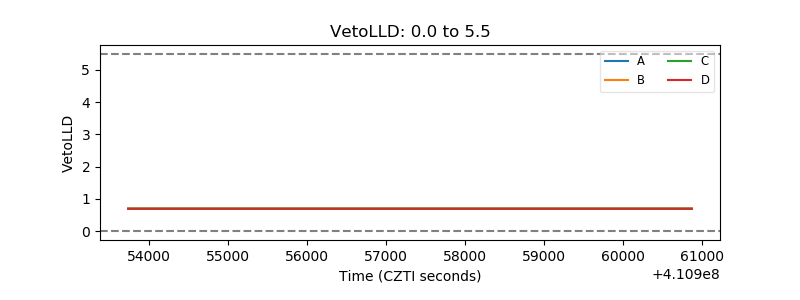 |
| Alpha Counter | 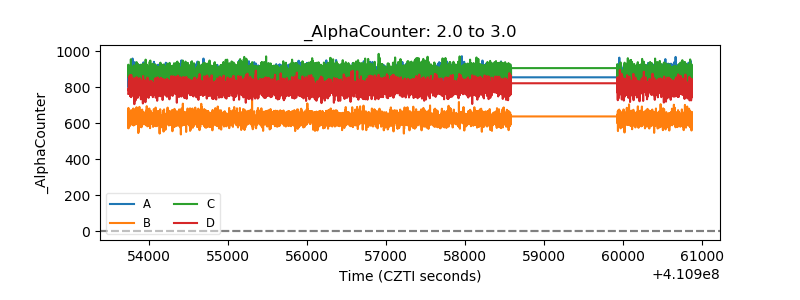 |
| _CPM_Rate | 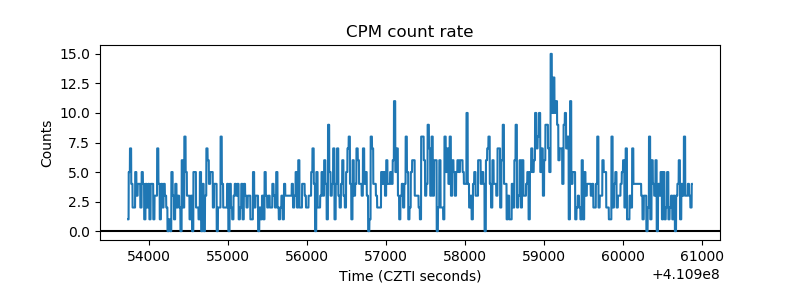 |
| CZT Counter | 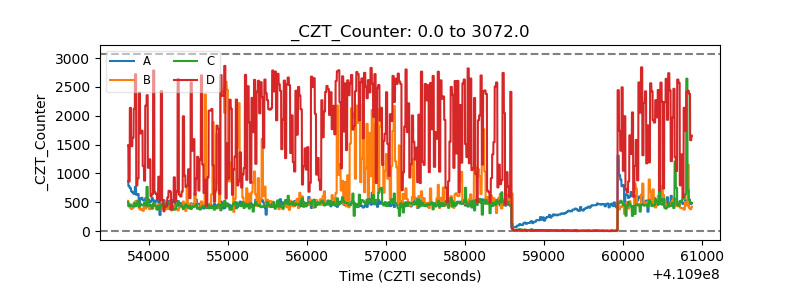 |
| +2.5 Volts monitor |  |
| +5 Volts monitor | 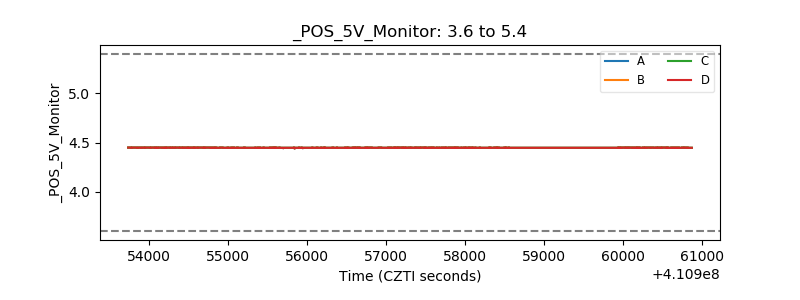 |
| _ROLL_ROT | 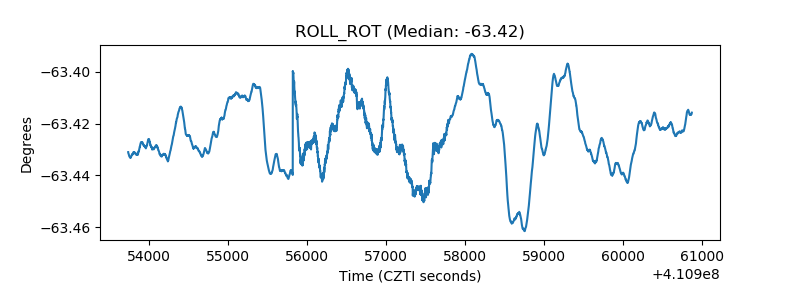 |
| _Roll_DEC | 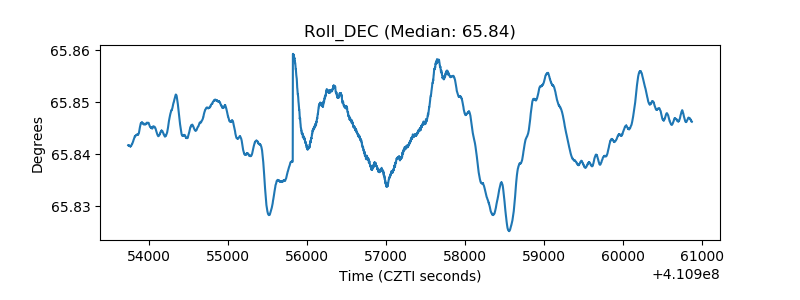 |
| _Roll_RA | 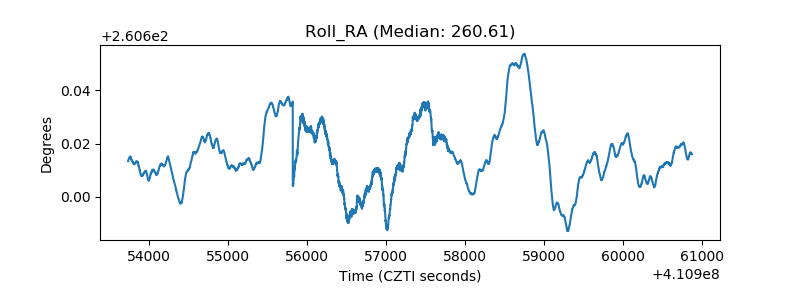 |
| Veto Counter | 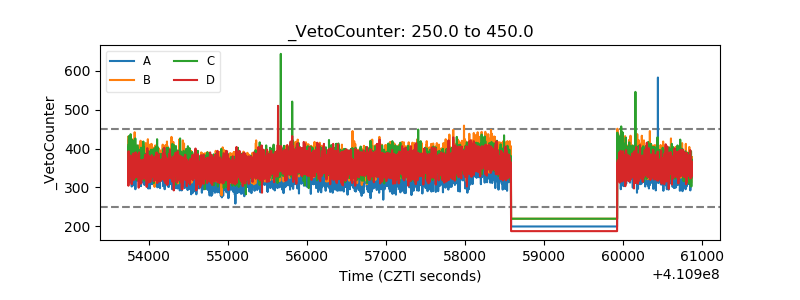 |