| Param | Original file | Final file |
|---|---|---|
| Filename | modeM0/AS1A12_018T01_9000005470_39380cztM0_level2.fits | modeM0/AS1A12_018T01_9000005470_39380cztM0_level2_quad_clean.evt |
| Size (bytes) | 612,564,480 | 88,107,840 |
| Size | 584.2 MB | 84.0 MB |
| Events in quadrant A | 3,084,605 | 664,639 |
| Events in quadrant B | 4,015,346 | 667,730 |
| Events in quadrant C | 2,957,146 | 636,866 |
| Events in quadrant D | 12,149,327 | 277,028 |
| Mode M9 | |||
|---|---|---|---|
| Quadrant | BADHDUFLAG | Total packets | Discarded packets |
| A | 0 | 15 | 0 |
| B | 0 | 15 | 0 |
| C | 0 | 15 | 0 |
| D | 0 | 16 | 0 |
| Mode SS | |||
|---|---|---|---|
| Quadrant | BADHDUFLAG | Total packets | Discarded packets |
| A | 0 | 122 | 0 |
| B | 0 | 122 | 0 |
| C | 0 | 122 | 0 |
| D | 0 | 122 | 0 |
| Mode M0 | |||
|---|---|---|---|
| Quadrant | BADHDUFLAG | Total packets | Discarded packets |
| A | 0 | 12712 | 3 |
| B | 0 | 15976 | 2 |
| C | 0 | 12489 | 2 |
| D | 0 | 40235 | 2 |
| Quadrant | Total seconds | Saturated seconds | Saturation percentage |
|---|---|---|---|
| A | 6032 | 12 | 0.198939% |
| B | 6032 | 208 | 3.448276% |
| C | 6032 | 14 | 0.232095% |
| D | 6032 | 3636 | 60.278515% |
Noise dominated data is calculated using 1-second bins in cleaned event files. If a bin has >2000 counts, and if more than 50% of those come from <1% of pixels, then it is considered to be noise-dominated and hence unusable.
| Quadrant | # 1 sec bins | Bins with >0 counts | Bins with >2000 counts | High rate bins dominated by noise | Noise dominated (total time) | Noise dominated (detector-on time) | Marked lightcurve |
|---|---|---|---|---|---|---|---|
| A | 7315 | 6033 | 6 | 6 | 0.08% | 0.10% | 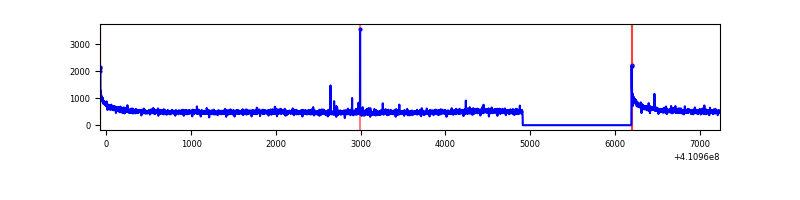 |
| B | 7315 | 6033 | 98 | 98 | 1.34% | 1.62% | 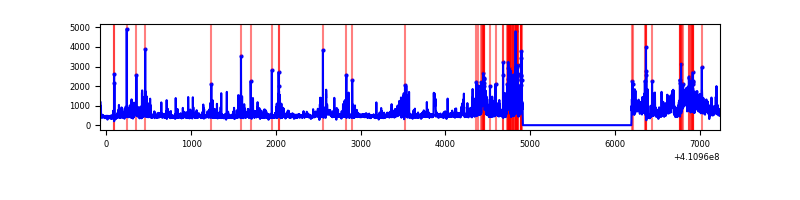 |
| C | 7315 | 6033 | 10 | 10 | 0.14% | 0.17% | 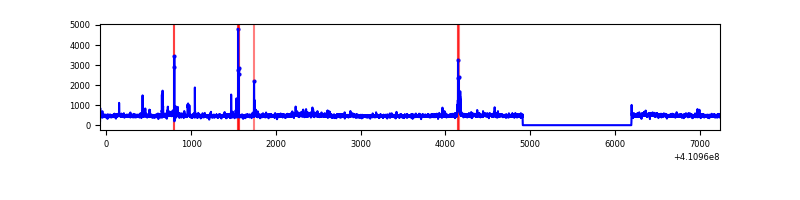 |
| D | 7315 | 6033 | 2969 | 2969 | 40.59% | 49.21% | 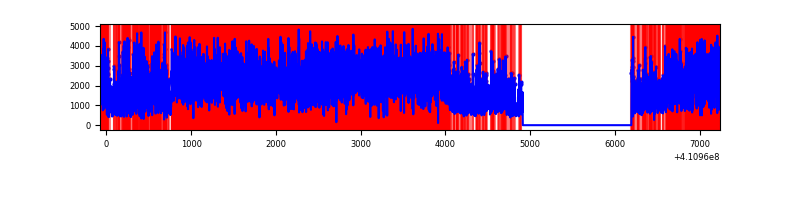 |
Top three noisy pixels from each quadrant. If the there are fewer than three noisy pixels in the level2.evt file, extra rows are filled as -1
| Pixel properties | Quadrant properties | ||||||
|---|---|---|---|---|---|---|---|
| Quadrant | DetID | PixID | Counts | Sigma | Mean | Median | Sigma |
| A | 10 | 83 | 479079 | 3487.52 | 665 | 651 | 137.2 |
| A | 2 | 79 | 24582 | 174.45 | 665 | 651 | 137.2 |
| A | 13 | 254 | 7968 | 53.34 | 665 | 651 | 137.2 |
| B | 5 | 200 | 585636 | 4587.67 | 654 | 635 | 127.5 |
| B | 5 | 172 | 530233 | 4153.19 | 654 | 635 | 127.5 |
| B | 6 | 203 | 305583 | 2391.45 | 654 | 635 | 127.5 |
| C | 15 | 214 | 255351 | 1692.02 | 643 | 647 | 150.5 |
| C | 14 | 254 | 102565 | 677.05 | 643 | 647 | 150.5 |
| C | 9 | 187 | 55286 | 362.97 | 643 | 647 | 150.5 |
| D | 12 | 235 | 9775548 | 82573.11 | 480 | 465 | 118.4 |
| D | 13 | 249 | 250884 | 2115.37 | 480 | 465 | 118.4 |
| D | 2 | 249 | 93703 | 787.61 | 480 | 465 | 118.4 |
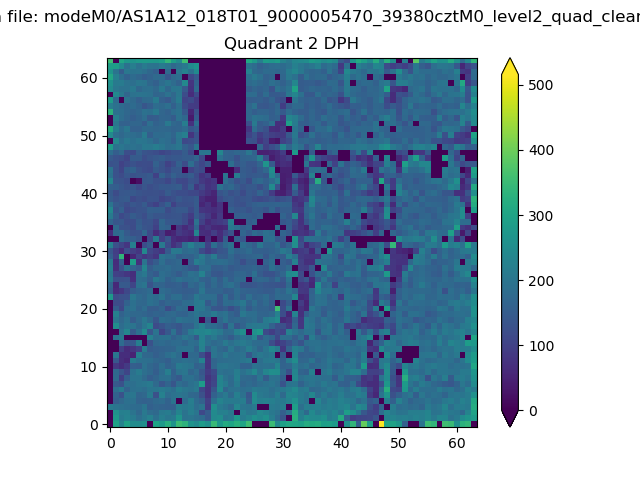
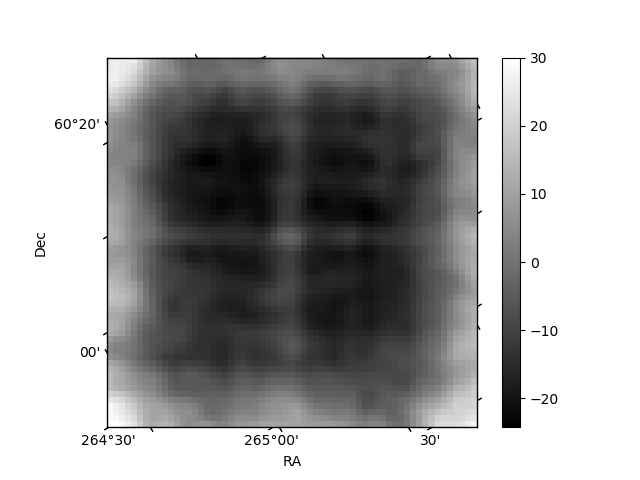
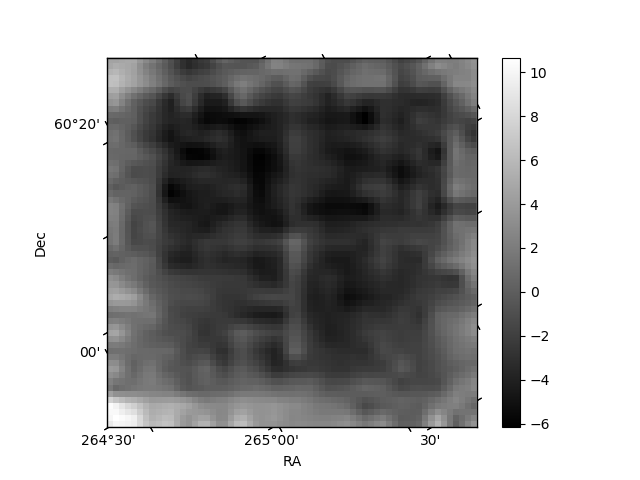
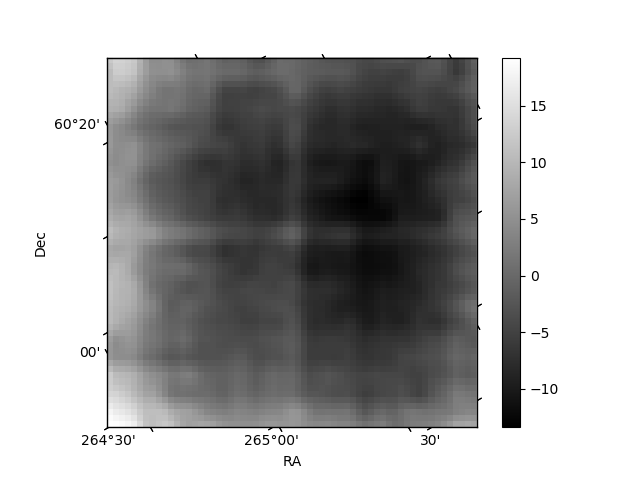
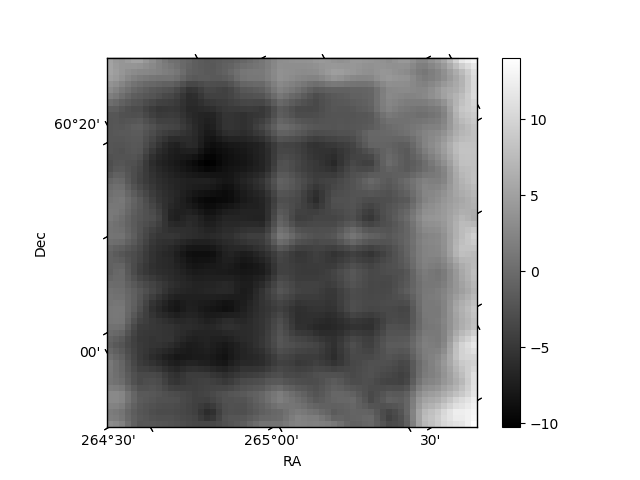
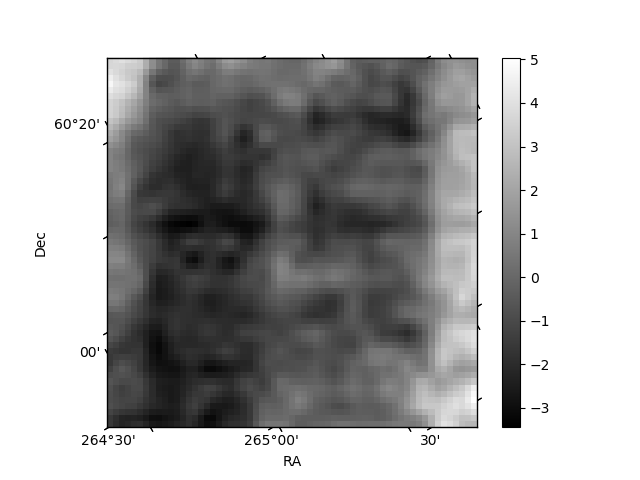
Histogram calculated using DETX and DETY for each event in the final _common_clean file
| Quadrant A | 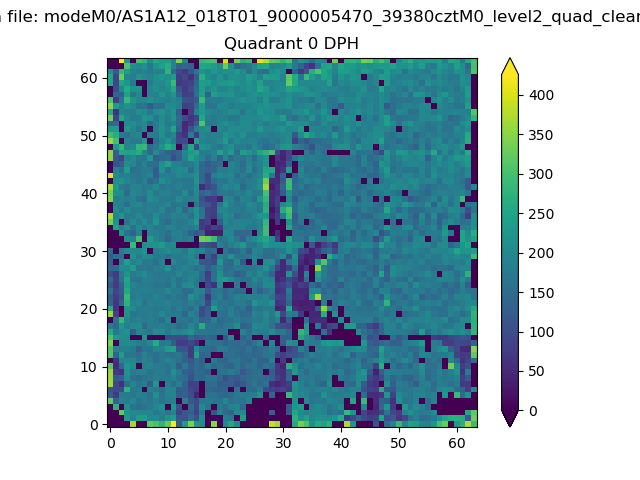 |
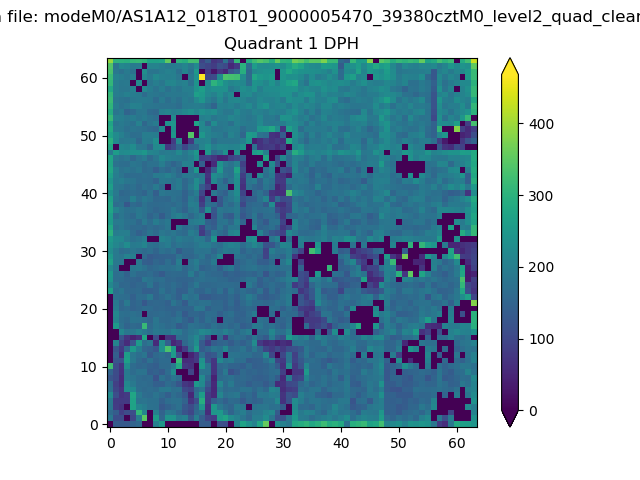 |
Quadrant B |
|---|---|---|---|
| Quadrant D | 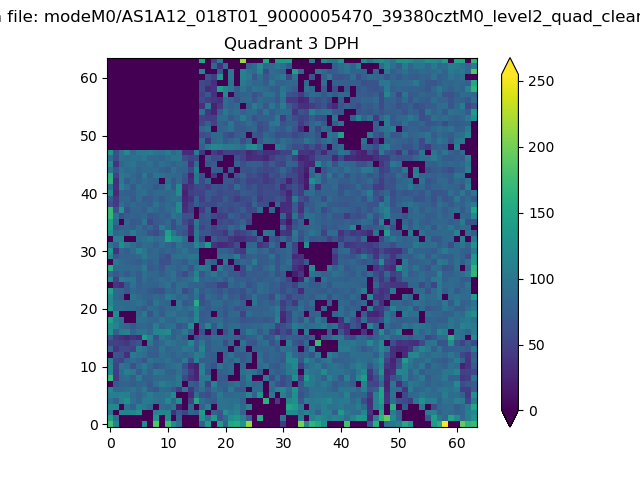 |
 |
Quadrant C |
| Plot type | Count rate plots | Images |
|---|---|---|
| Comparison with Poisson distribution Blue bars denote a histogram of data divided into 1 sec bins. Red curve is a Poisson curve with rate = median count rate of data. |
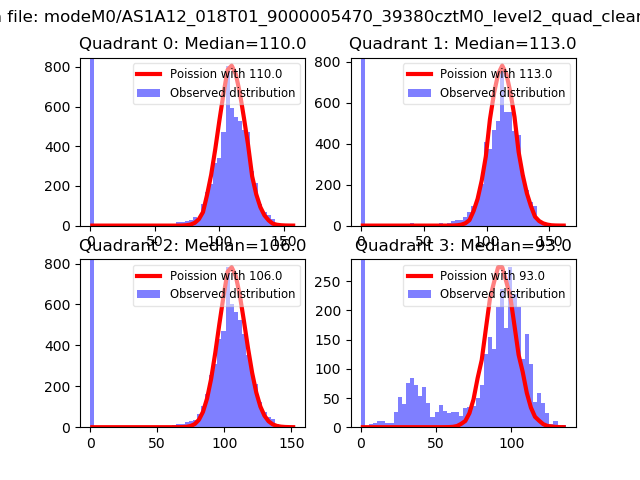 |
 |
| Quadrant-wise count rates Data is divided into 100 sec bins |
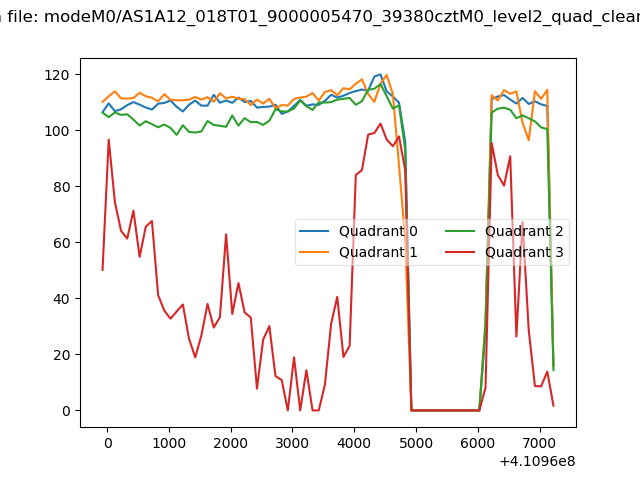 |
|
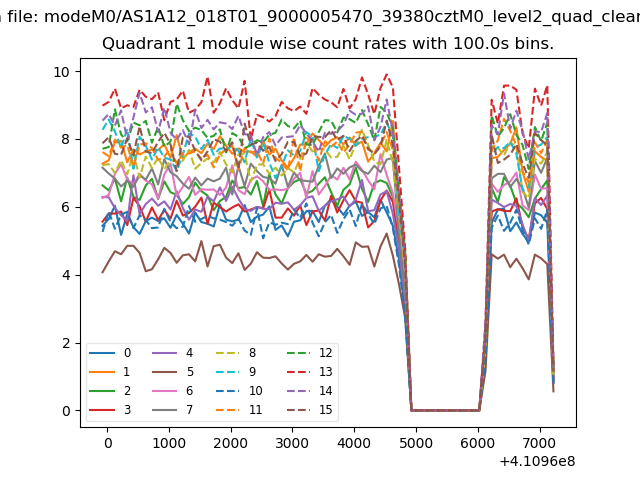
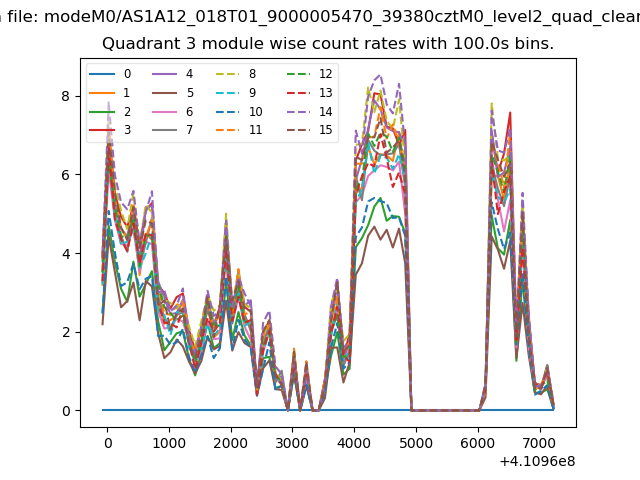
| Module-wise count rates for Quadrant A Data is divided into 100 sec bins |
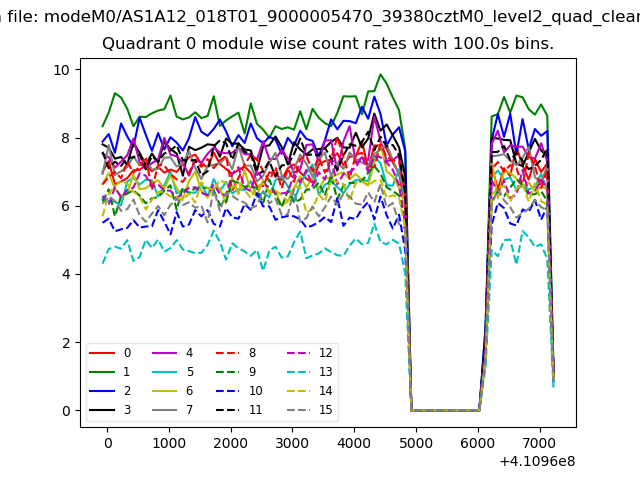 |
 |
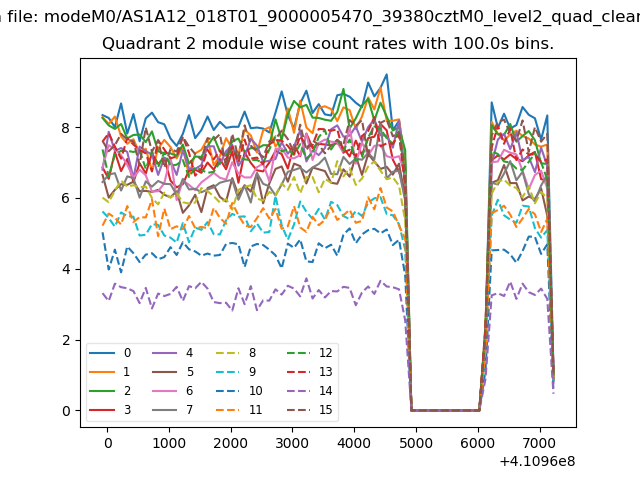
| Module-wise count rates for Quadrant B Data is divided into 100 sec bins |
 |
 |
| Module-wise count rates for Quadrant C Data is divided into 100 sec bins |
 |
 |
| Module-wise count rates for Quadrant D Data is divided into 100 sec bins |
 |
 |
| Parameter | Plot |
|---|---|
| CZT HV Monitor |  |
| D_VDD | 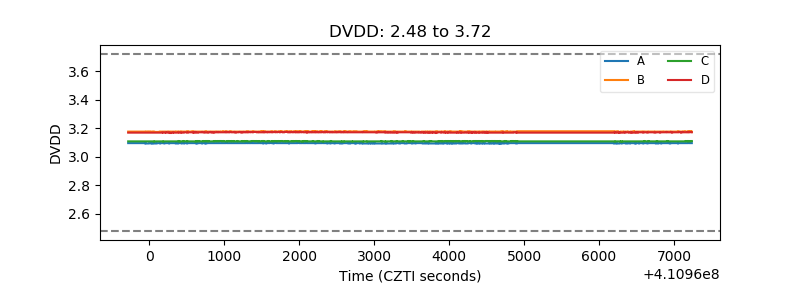 |
| Temperature 1 | 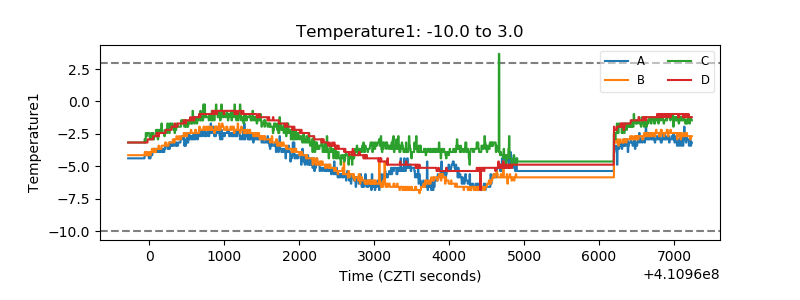 |
| Veto HV Monitor | 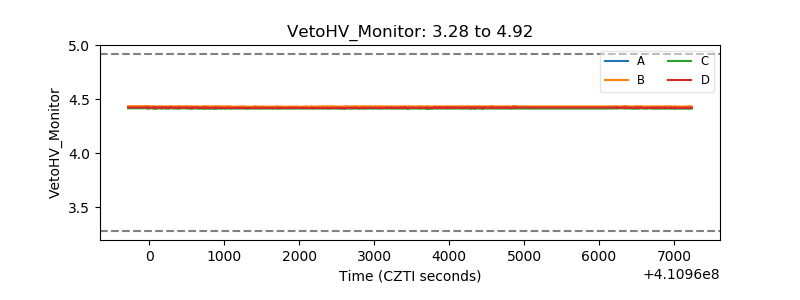 |
| Veto LLD | 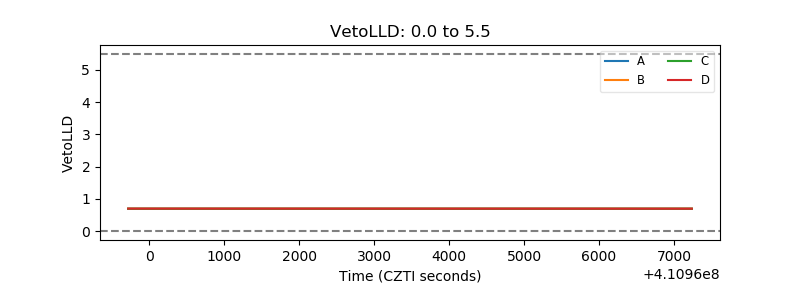 |
| Alpha Counter | 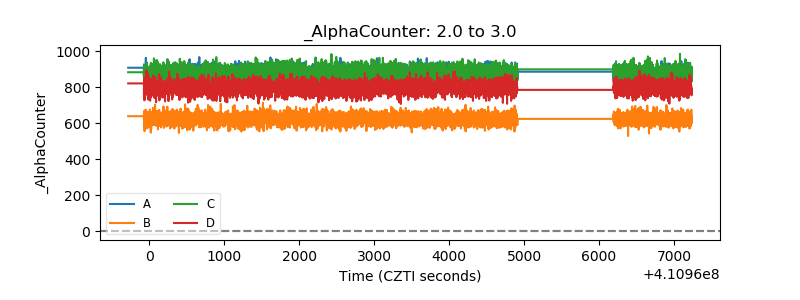 |
| _CPM_Rate | 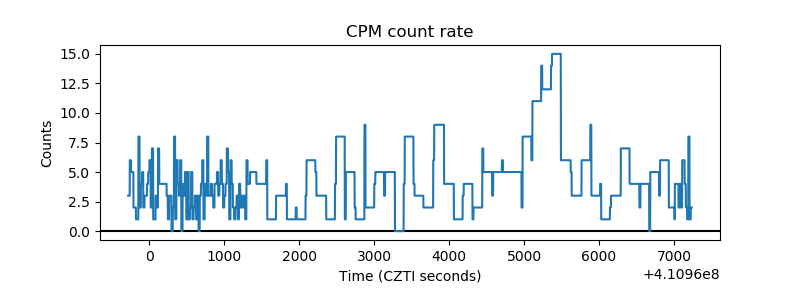 |
| CZT Counter | 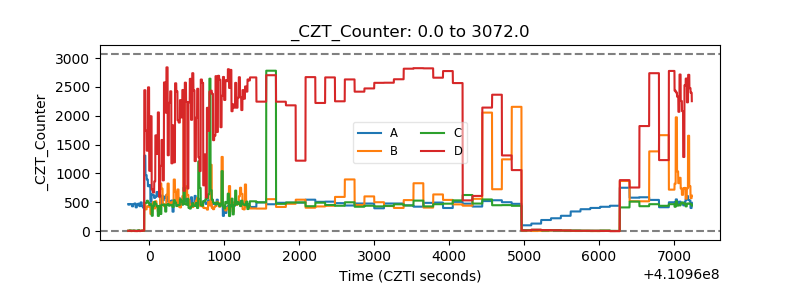 |
| +2.5 Volts monitor | 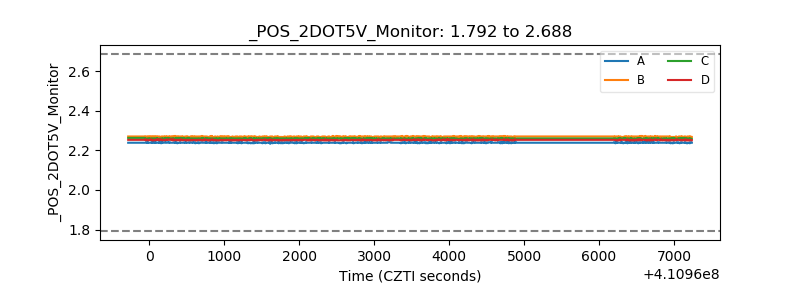 |
| +5 Volts monitor | 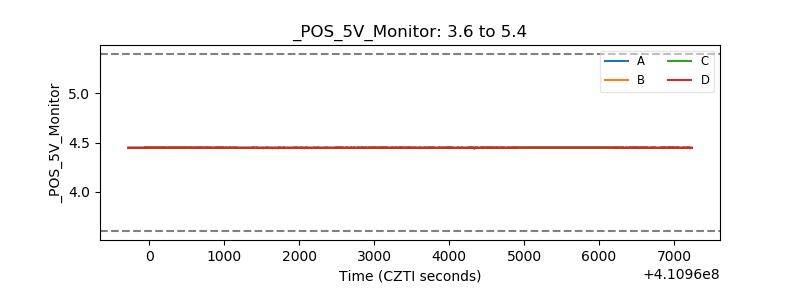 |
| _ROLL_ROT | 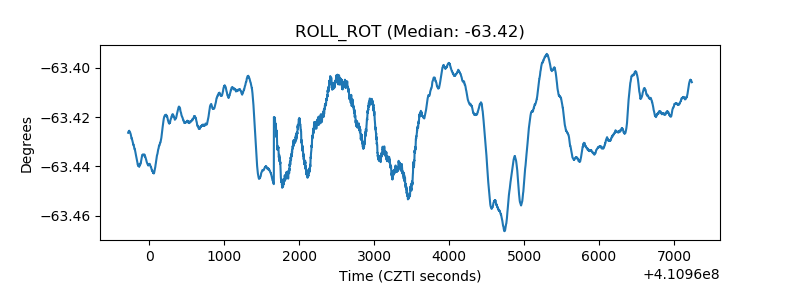 |
| _Roll_DEC | 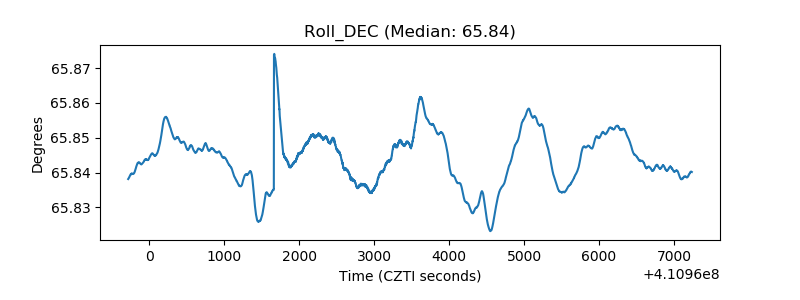 |
| _Roll_RA | 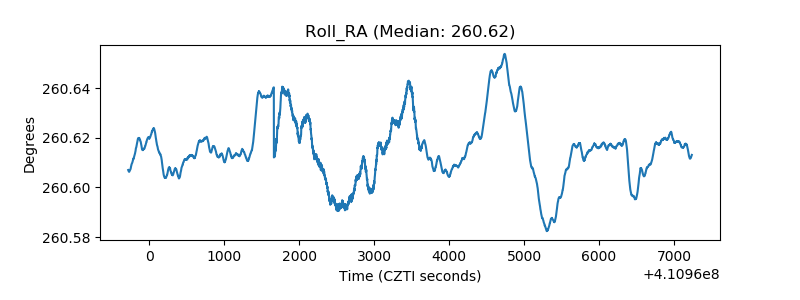 |
| Veto Counter | 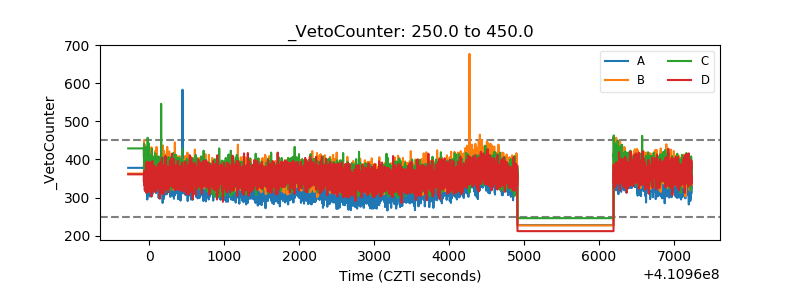 |