| Param | Original file | Final file |
|---|---|---|
| Filename | modeM0/AS1A12_018T01_9000005470_39382cztM0_level2.fits | modeM0/AS1A12_018T01_9000005470_39382cztM0_level2_quad_clean.evt |
| Size (bytes) | 748,730,880 | 127,434,240 |
| Size | 714.0 MB | 121.5 MB |
| Events in quadrant A | 4,213,175 | 918,348 |
| Events in quadrant B | 5,996,027 | 917,264 |
| Events in quadrant C | 3,944,587 | 883,509 |
| Events in quadrant D | 12,912,319 | 556,440 |
| Mode M9 | |||
|---|---|---|---|
| Quadrant | BADHDUFLAG | Total packets | Discarded packets |
| A | 0 | 13 | 0 |
| B | 0 | 13 | 0 |
| C | 0 | 13 | 0 |
| D | 0 | 13 | 0 |
| Mode SS | |||
|---|---|---|---|
| Quadrant | BADHDUFLAG | Total packets | Discarded packets |
| A | 0 | 172 | 0 |
| B | 0 | 172 | 0 |
| C | 0 | 172 | 0 |
| D | 0 | 172 | 0 |
| Mode M0 | |||
|---|---|---|---|
| Quadrant | BADHDUFLAG | Total packets | Discarded packets |
| A | 0 | 17597 | 2 |
| B | 0 | 23603 | 1 |
| C | 0 | 17023 | 1 |
| D | 0 | 44116 | 1 |
| Quadrant | Total seconds | Saturated seconds | Saturation percentage |
|---|---|---|---|
| A | 8381 | 20 | 0.238635% |
| B | 8381 | 308 | 3.674979% |
| C | 8381 | 12 | 0.143181% |
| D | 8381 | 3120 | 37.227061% |
Noise dominated data is calculated using 1-second bins in cleaned event files. If a bin has >2000 counts, and if more than 50% of those come from <1% of pixels, then it is considered to be noise-dominated and hence unusable.
| Quadrant | # 1 sec bins | Bins with >0 counts | Bins with >2000 counts | High rate bins dominated by noise | Noise dominated (total time) | Noise dominated (detector-on time) | Marked lightcurve |
|---|---|---|---|---|---|---|---|
| A | 9724 | 8382 | 8 | 8 | 0.08% | 0.10% | 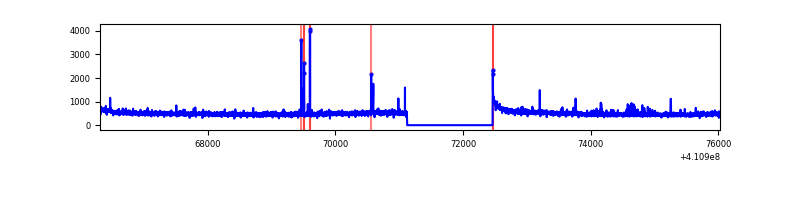 |
| B | 9724 | 8382 | 195 | 195 | 2.01% | 2.33% | 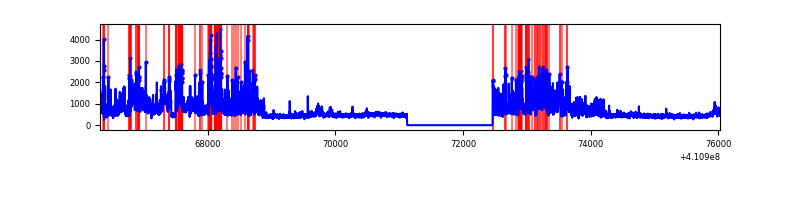 |
| C | 9724 | 8382 | 6 | 6 | 0.06% | 0.07% | 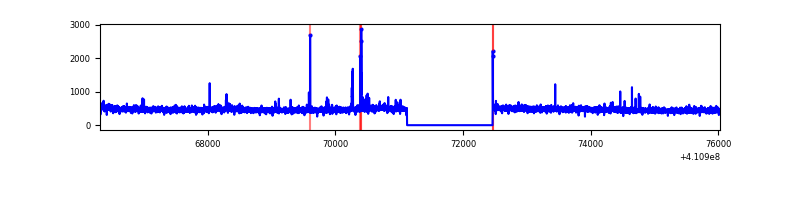 |
| D | 9724 | 8382 | 2578 | 2578 | 26.51% | 30.76% | 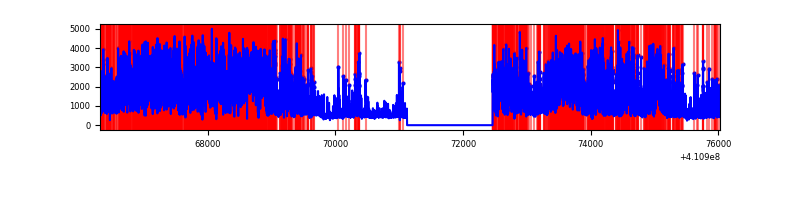 |
Top three noisy pixels from each quadrant. If the there are fewer than three noisy pixels in the level2.evt file, extra rows are filled as -1
| Pixel properties | Quadrant properties | ||||||
|---|---|---|---|---|---|---|---|
| Quadrant | DetID | PixID | Counts | Sigma | Mean | Median | Sigma |
| A | 10 | 83 | 544061 | 2911.73 | 912 | 893 | 186.5 |
| A | 2 | 79 | 90819 | 482.06 | 912 | 893 | 186.5 |
| A | 15 | 191 | 54202 | 285.77 | 912 | 893 | 186.5 |
| B | 6 | 203 | 1475334 | 8574.93 | 897 | 871 | 172.0 |
| B | 5 | 200 | 637542 | 3702.64 | 897 | 871 | 172.0 |
| B | 5 | 172 | 331311 | 1921.72 | 897 | 871 | 172.0 |
| C | 15 | 214 | 346566 | 1670.79 | 892 | 895 | 206.9 |
| C | 9 | 187 | 38478 | 181.66 | 892 | 895 | 206.9 |
| C | 14 | 254 | 24063 | 111.98 | 892 | 895 | 206.9 |
| D | 12 | 235 | 9232542 | 50153.41 | 752 | 730 | 184.1 |
| D | 13 | 249 | 592713 | 3216.05 | 752 | 730 | 184.1 |
| D | 2 | 249 | 90935 | 490.05 | 752 | 730 | 184.1 |
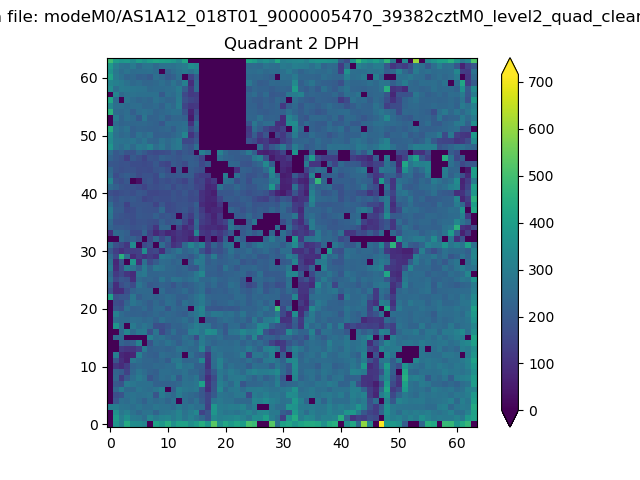
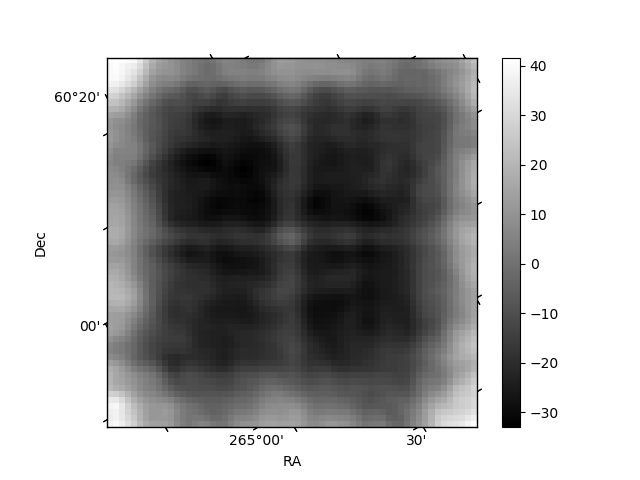
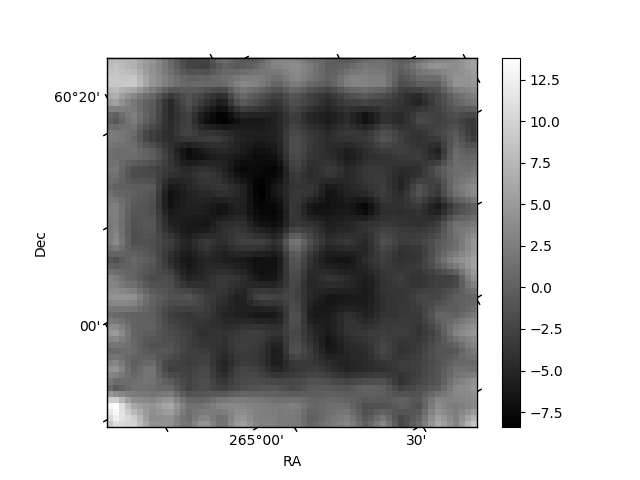
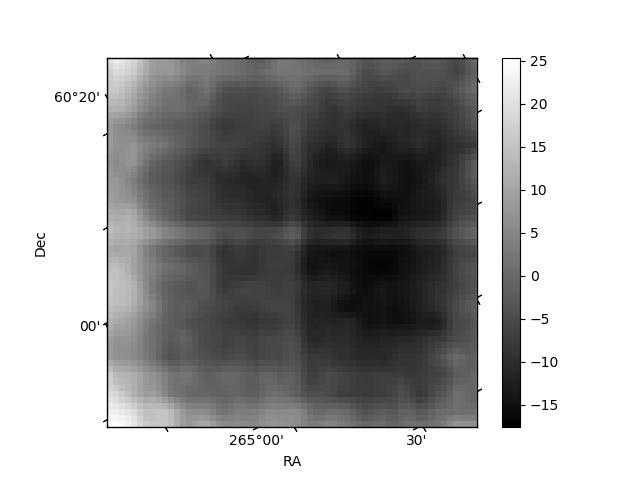
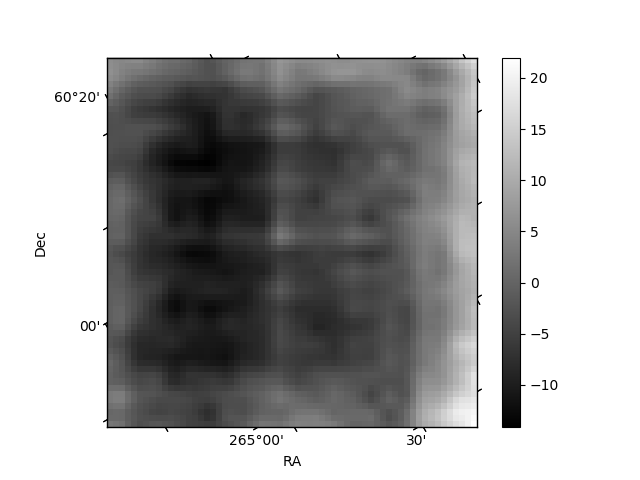
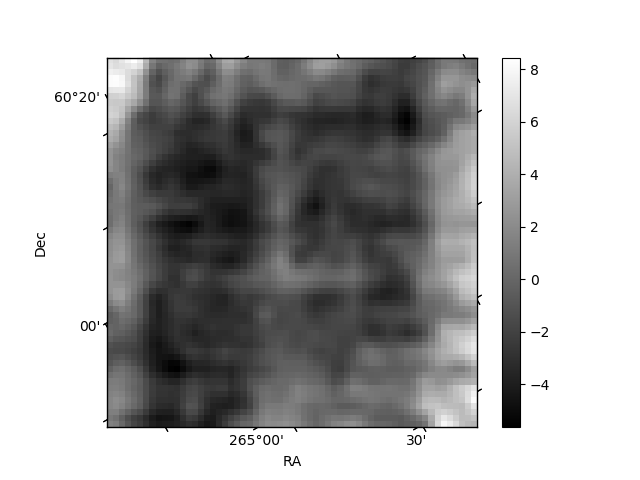
Histogram calculated using DETX and DETY for each event in the final _common_clean file
| Quadrant A | 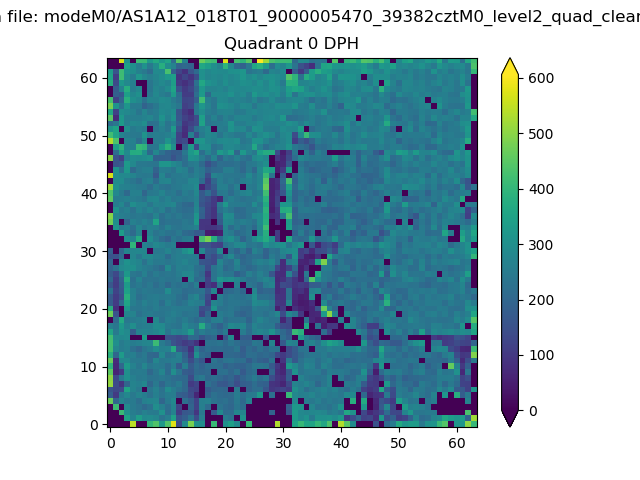 |
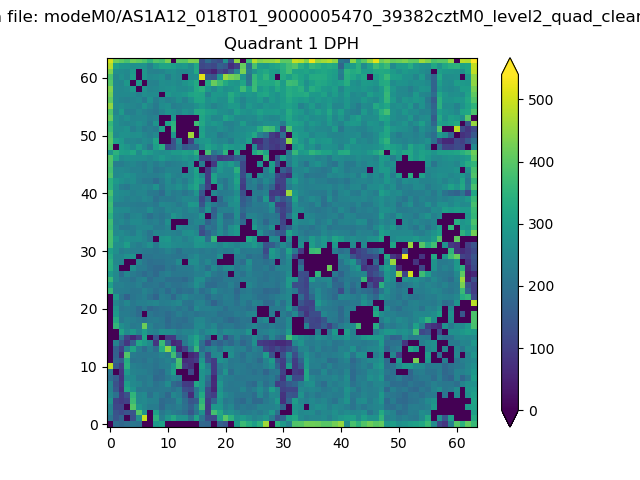 |
Quadrant B |
|---|---|---|---|
| Quadrant D | 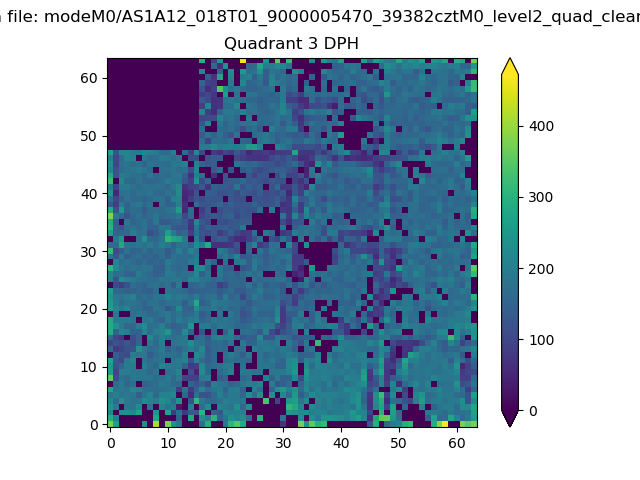 |
 |
Quadrant C |
| Plot type | Count rate plots | Images |
|---|---|---|
| Comparison with Poisson distribution Blue bars denote a histogram of data divided into 1 sec bins. Red curve is a Poisson curve with rate = median count rate of data. |
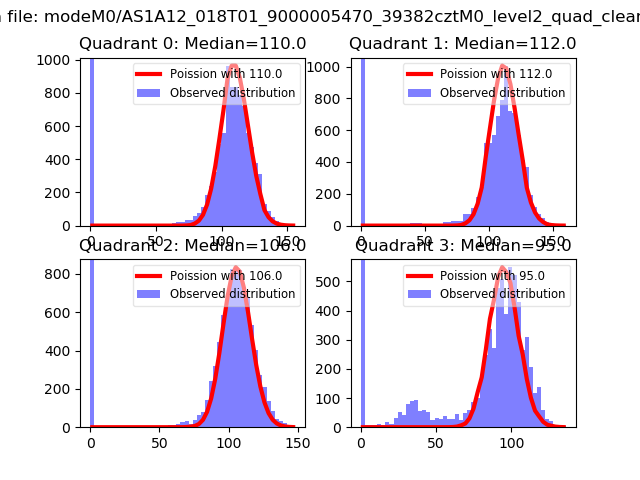 |
 |
| Quadrant-wise count rates Data is divided into 100 sec bins |
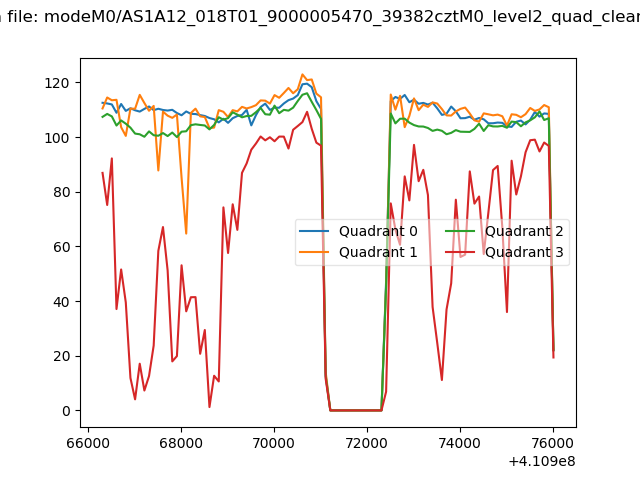 |
|
| Module-wise count rates for Quadrant A Data is divided into 100 sec bins |
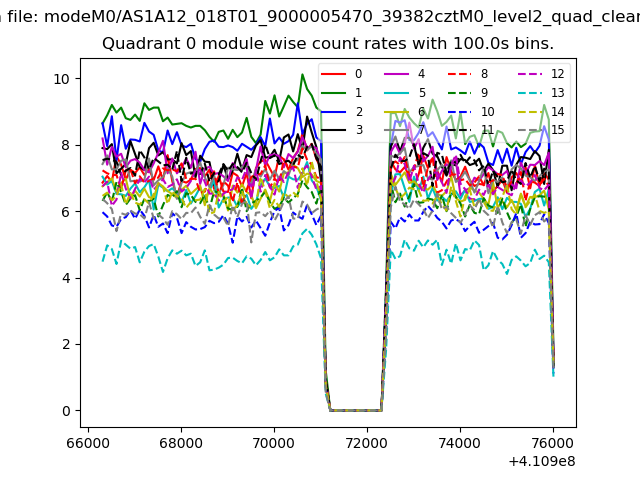 |
 |
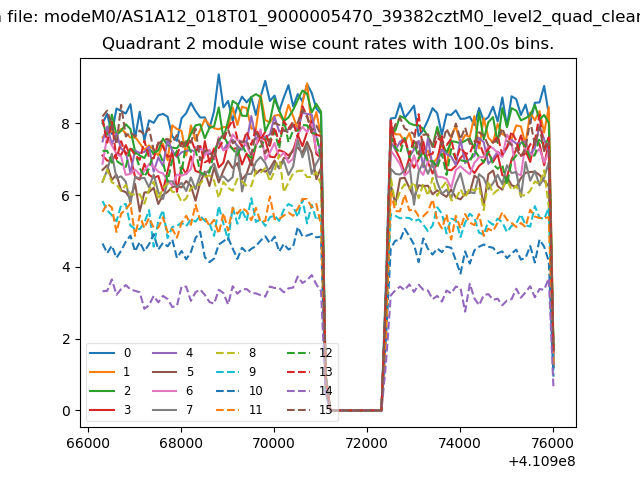
| Module-wise count rates for Quadrant B Data is divided into 100 sec bins |
 |
 |
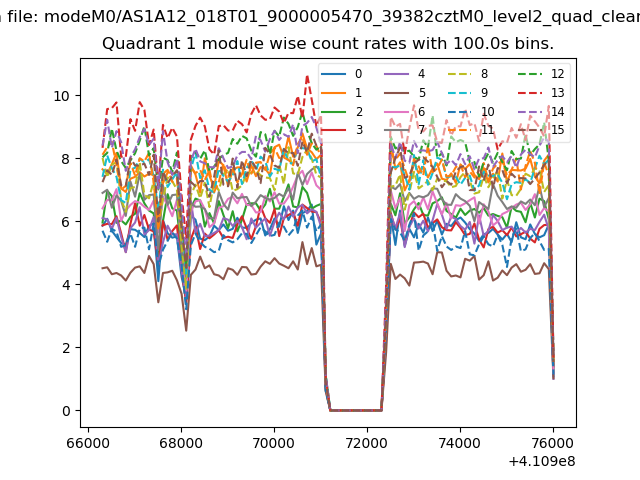
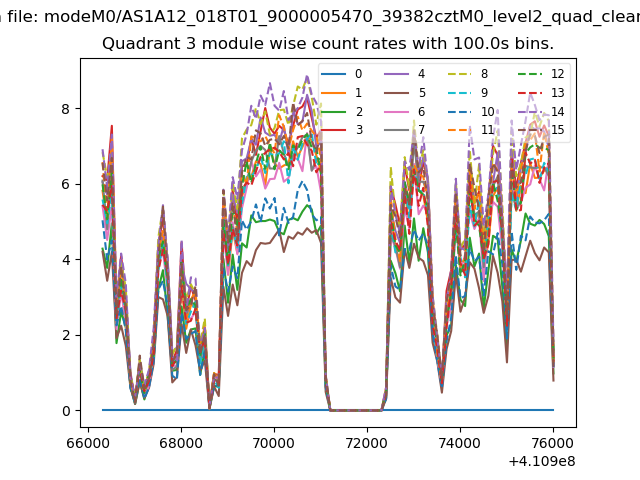
| Module-wise count rates for Quadrant C Data is divided into 100 sec bins |
 |
 |
| Module-wise count rates for Quadrant D Data is divided into 100 sec bins |
 |
 |
| Parameter | Plot |
|---|---|
| CZT HV Monitor | 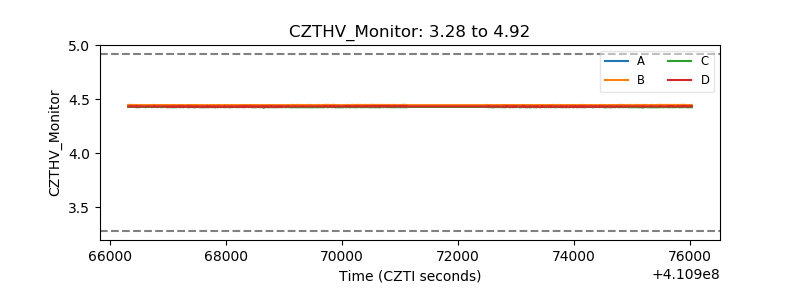 |
| D_VDD | 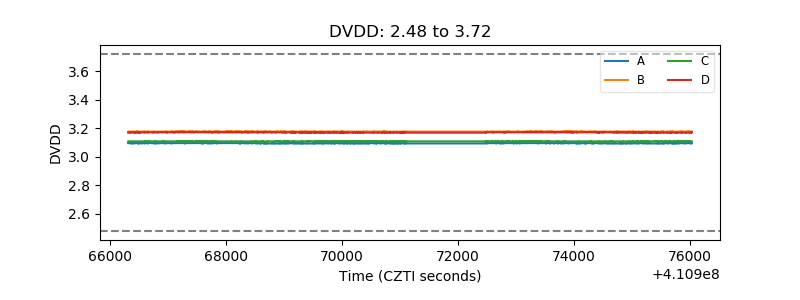 |
| Temperature 1 | 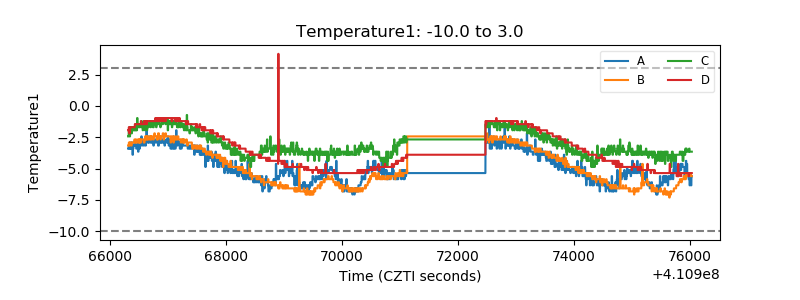 |
| Veto HV Monitor | 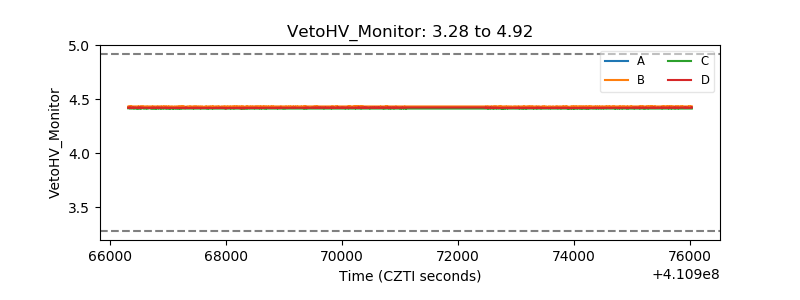 |
| Veto LLD | 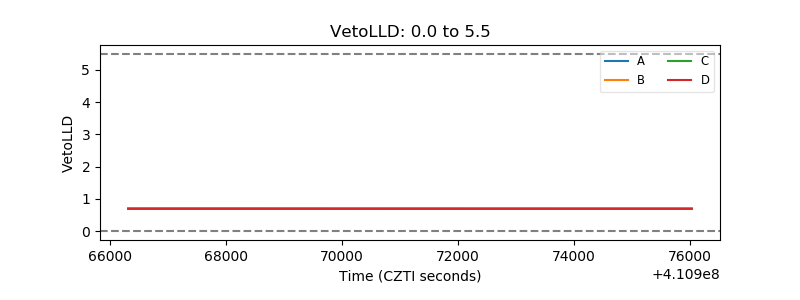 |
| Alpha Counter | 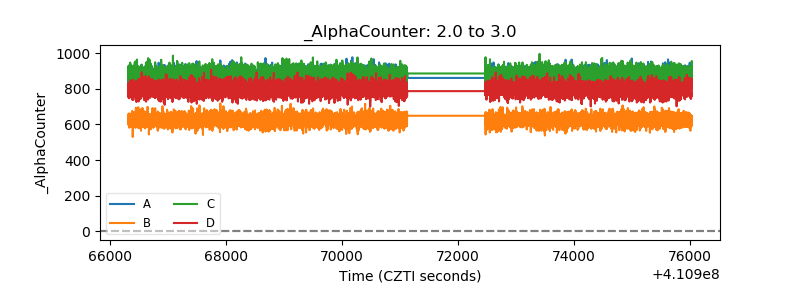 |
| _CPM_Rate | 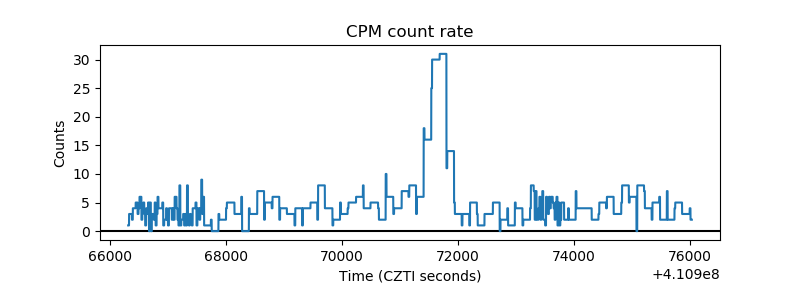 |
| CZT Counter | 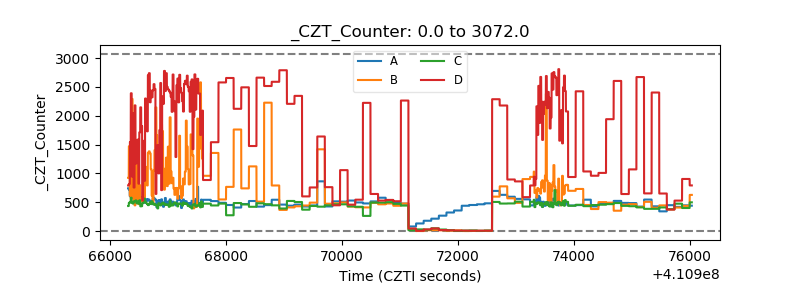 |
| +2.5 Volts monitor |  |
| +5 Volts monitor | 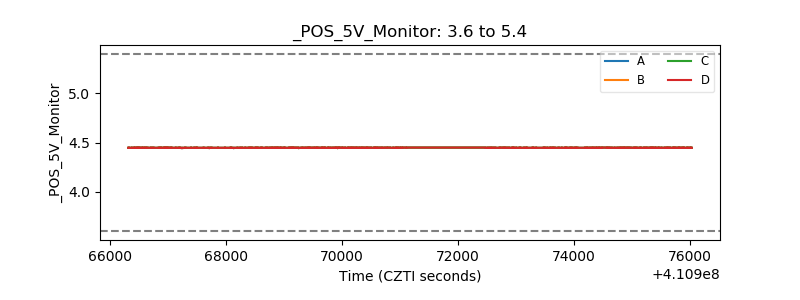 |
| _ROLL_ROT | 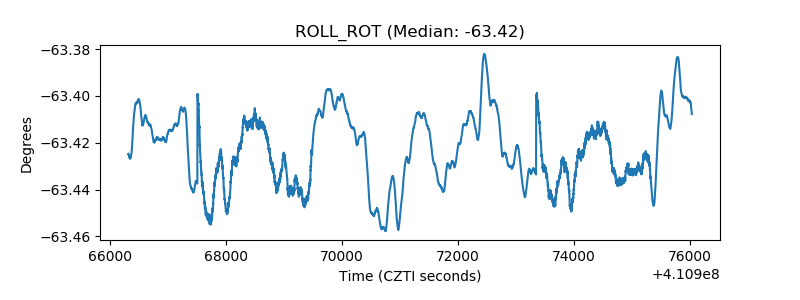 |
| _Roll_DEC | 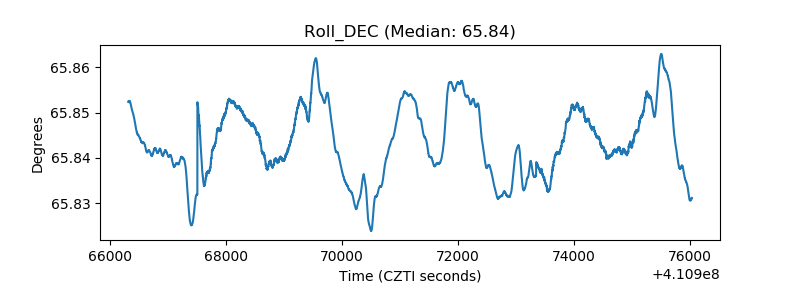 |
| _Roll_RA | 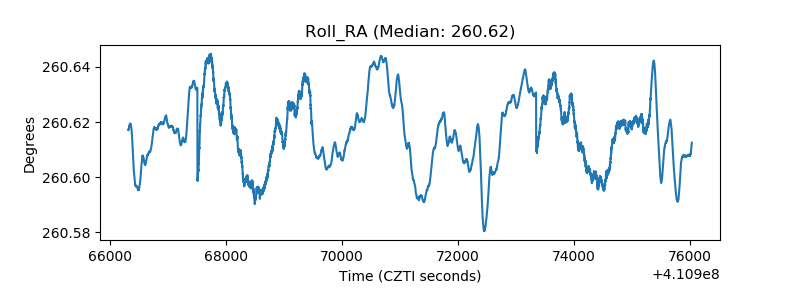 |
| Veto Counter | 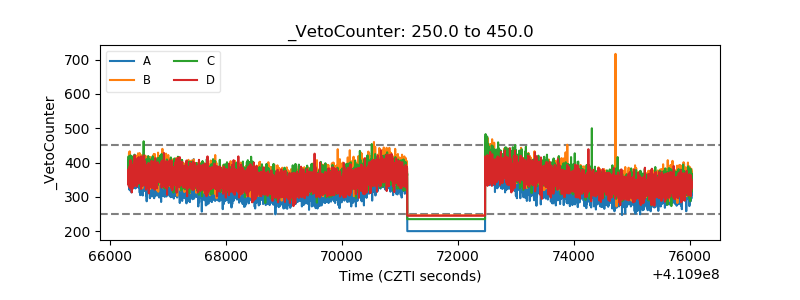 |