| Param | Original file | Final file |
|---|---|---|
| Filename | modeM0/AS1A12_018T01_9000005470_39383cztM0_level2.fits | modeM0/AS1A12_018T01_9000005470_39383cztM0_level2_quad_clean.evt |
| Size (bytes) | 621,368,640 | 114,307,200 |
| Size | 592.6 MB | 109.0 MB |
| Events in quadrant A | 3,762,204 | 821,089 |
| Events in quadrant B | 5,999,397 | 723,359 |
| Events in quadrant C | 3,618,372 | 796,687 |
| Events in quadrant D | 9,046,873 | 604,720 |
| Mode M9 | |||
|---|---|---|---|
| Quadrant | BADHDUFLAG | Total packets | Discarded packets |
| A | 0 | 30 | 0 |
| B | 0 | 30 | 0 |
| C | 0 | 30 | 0 |
| D | 0 | 30 | 0 |
| Mode SS | |||
|---|---|---|---|
| Quadrant | BADHDUFLAG | Total packets | Discarded packets |
| A | 0 | 152 | 0 |
| B | 0 | 152 | 0 |
| C | 0 | 152 | 0 |
| D | 0 | 152 | 0 |
| Mode M0 | |||
|---|---|---|---|
| Quadrant | BADHDUFLAG | Total packets | Discarded packets |
| A | 0 | 15766 | 3 |
| B | 0 | 22703 | 2 |
| C | 0 | 15396 | 2 |
| D | 0 | 32004 | 2 |
| Quadrant | Total seconds | Saturated seconds | Saturation percentage |
|---|---|---|---|
| A | 7400 | 22 | 0.297297% |
| B | 7400 | 1118 | 15.108108% |
| C | 7400 | 15 | 0.202703% |
| D | 7400 | 1609 | 21.743243% |
Noise dominated data is calculated using 1-second bins in cleaned event files. If a bin has >2000 counts, and if more than 50% of those come from <1% of pixels, then it is considered to be noise-dominated and hence unusable.
| Quadrant | # 1 sec bins | Bins with >0 counts | Bins with >2000 counts | High rate bins dominated by noise | Noise dominated (total time) | Noise dominated (detector-on time) | Marked lightcurve |
|---|---|---|---|---|---|---|---|
| A | 10386 | 7402 | 4 | 4 | 0.04% | 0.05% | 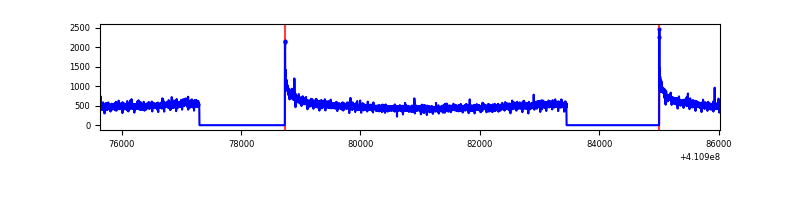 |
| B | 10386 | 7402 | 971 | 971 | 9.35% | 13.12% | 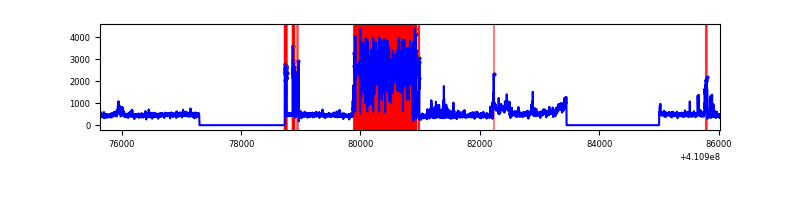 |
| C | 10386 | 7402 | 8 | 8 | 0.08% | 0.11% | 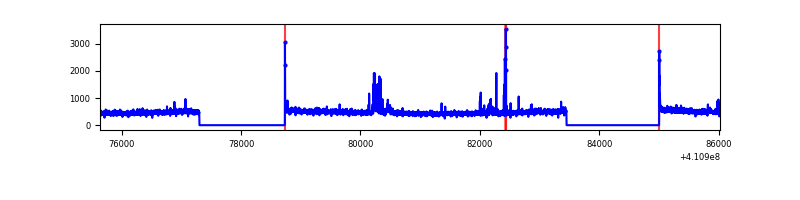 |
| D | 10386 | 7402 | 1285 | 1285 | 12.37% | 17.36% | 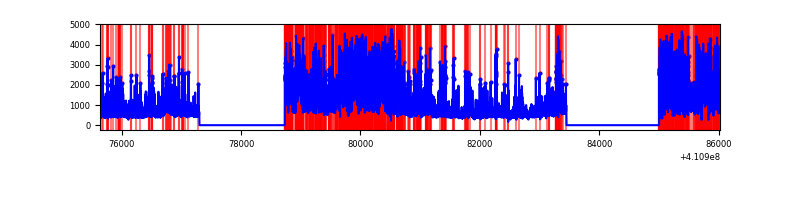 |
Top three noisy pixels from each quadrant. If the there are fewer than three noisy pixels in the level2.evt file, extra rows are filled as -1
| Pixel properties | Quadrant properties | ||||||
|---|---|---|---|---|---|---|---|
| Quadrant | DetID | PixID | Counts | Sigma | Mean | Median | Sigma |
| A | 10 | 83 | 535126 | 3195.15 | 825 | 809 | 167.2 |
| A | 15 | 191 | 23554 | 136.01 | 825 | 809 | 167.2 |
| A | 13 | 254 | 9728 | 53.33 | 825 | 809 | 167.2 |
| B | 5 | 200 | 2458723 | 16764.16 | 753 | 732 | 146.6 |
| B | 6 | 203 | 384808 | 2619.5 | 753 | 732 | 146.6 |
| B | 5 | 172 | 180715 | 1227.53 | 753 | 732 | 146.6 |
| C | 15 | 214 | 306913 | 1630.73 | 803 | 808 | 187.7 |
| C | 9 | 187 | 98255 | 519.13 | 803 | 808 | 187.7 |
| C | 14 | 254 | 44321 | 231.81 | 803 | 808 | 187.7 |
| D | 12 | 235 | 5054384 | 28140.93 | 727 | 705 | 179.6 |
| D | 13 | 249 | 811900 | 4517.06 | 727 | 705 | 179.6 |
| D | 12 | 233 | 139704 | 774.0 | 727 | 705 | 179.6 |
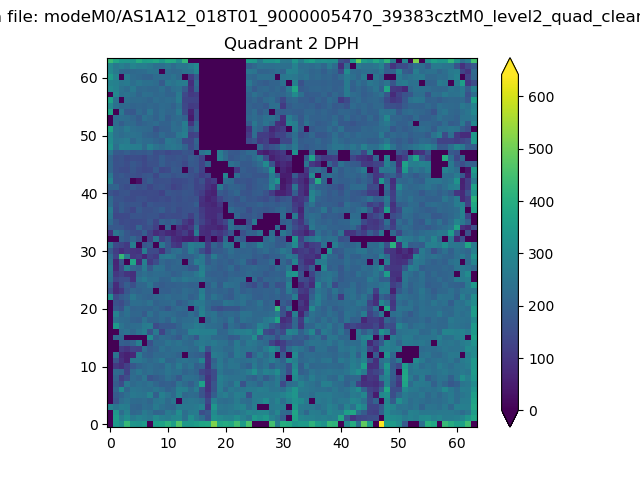
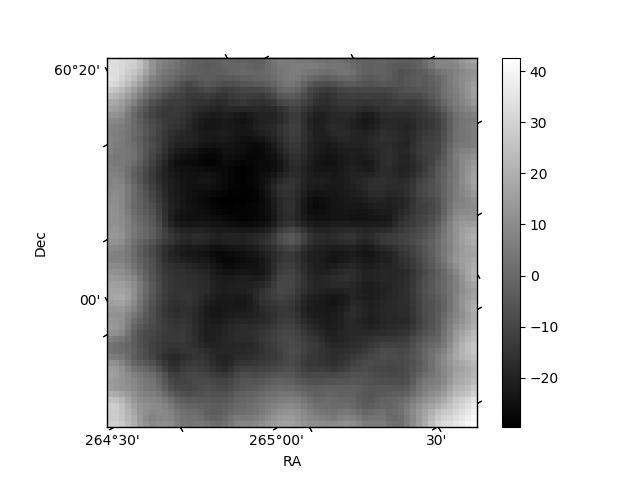
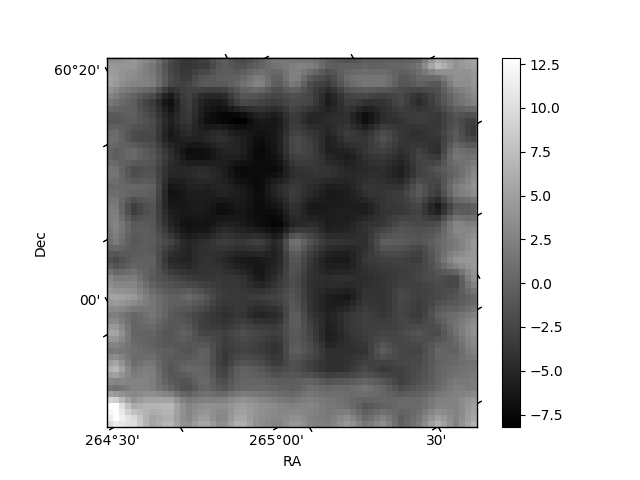
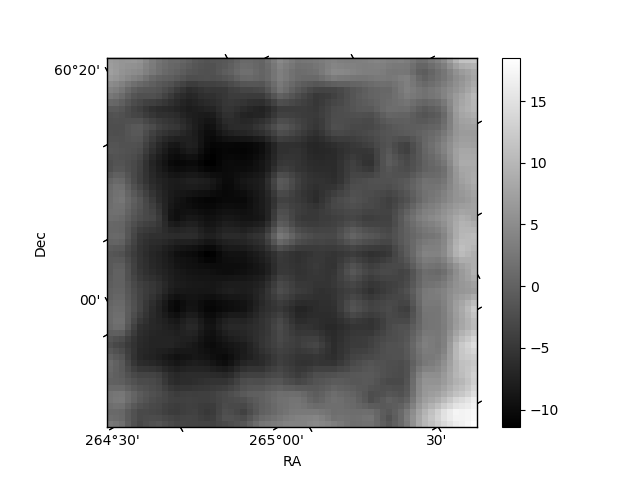
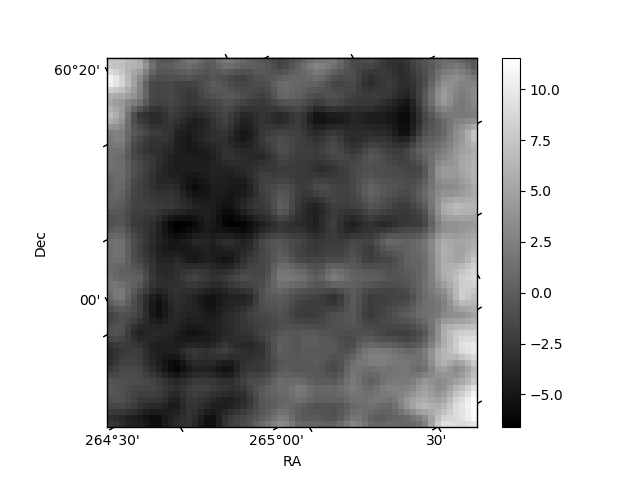
Histogram calculated using DETX and DETY for each event in the final _common_clean file
| Quadrant A | 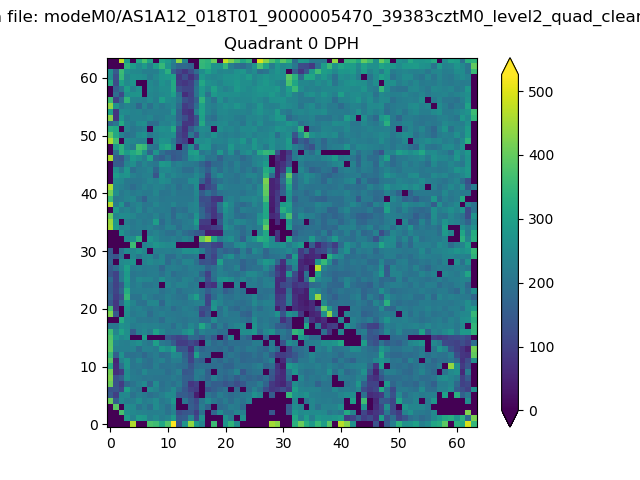 |
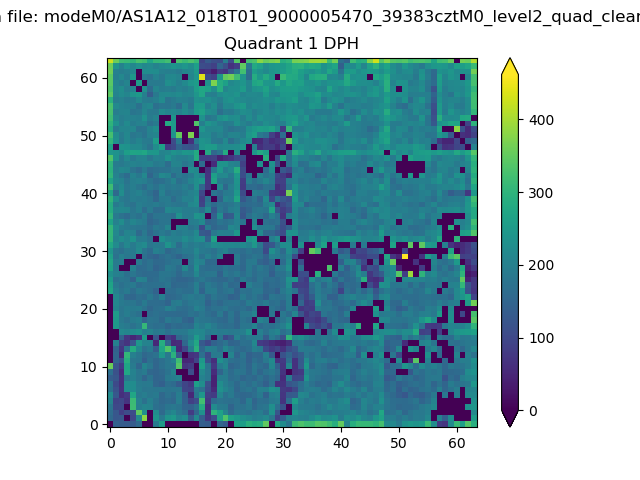 |
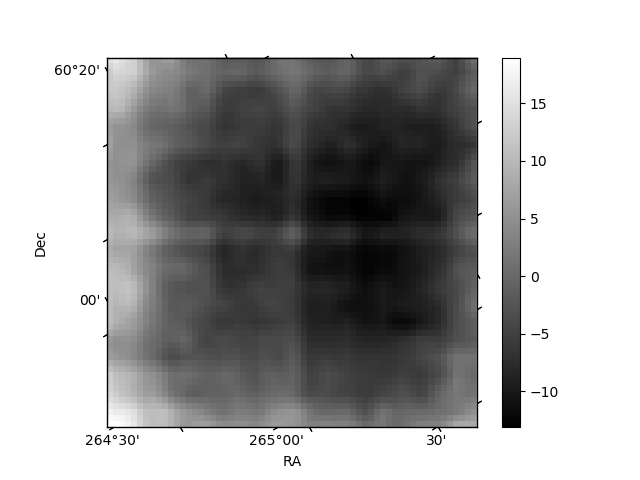
Quadrant B |
|---|---|---|---|
| Quadrant D | 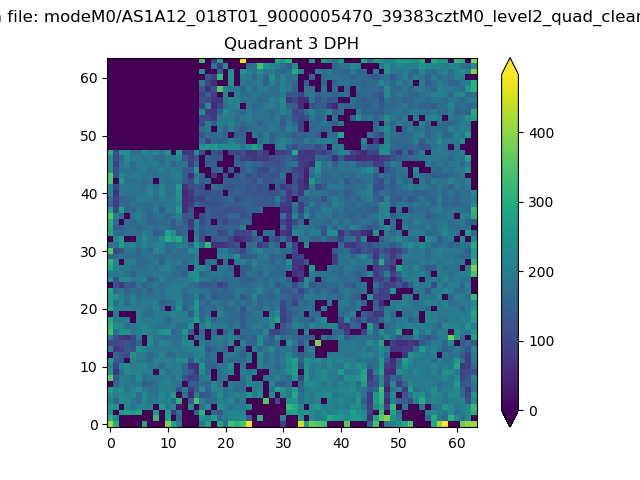 |
 |
Quadrant C |
| Plot type | Count rate plots | Images |
|---|---|---|
| Comparison with Poisson distribution Blue bars denote a histogram of data divided into 1 sec bins. Red curve is a Poisson curve with rate = median count rate of data. |
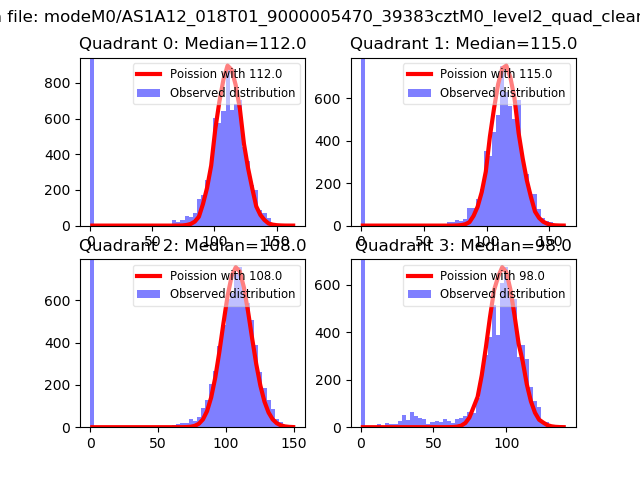 |
 |
| Quadrant-wise count rates Data is divided into 100 sec bins |
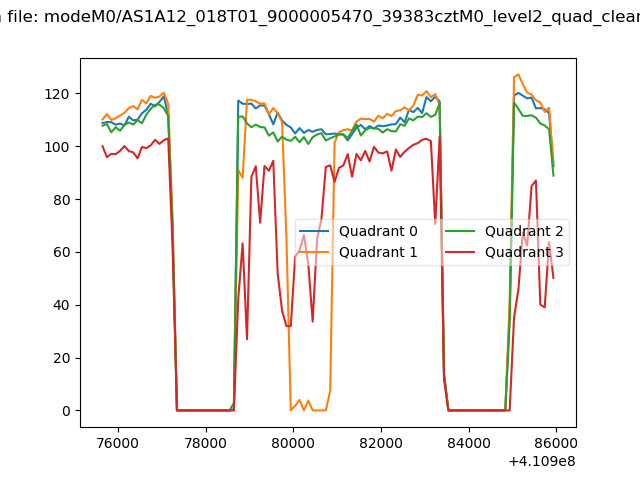 |
|
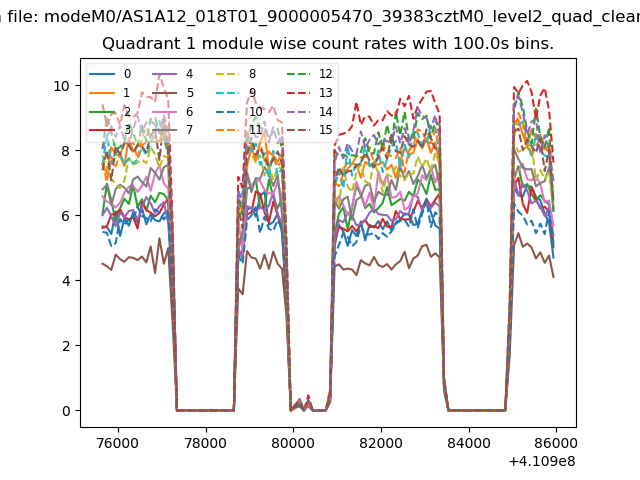
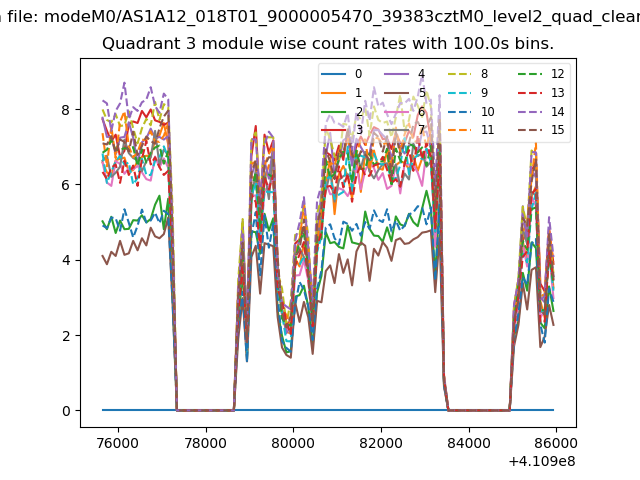
| Module-wise count rates for Quadrant A Data is divided into 100 sec bins |
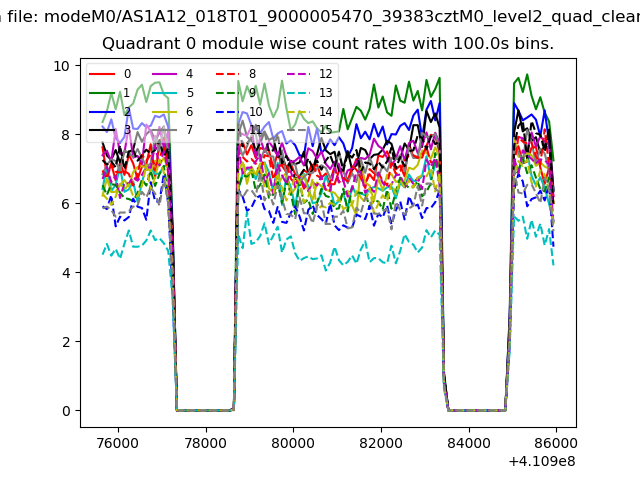 |
 |
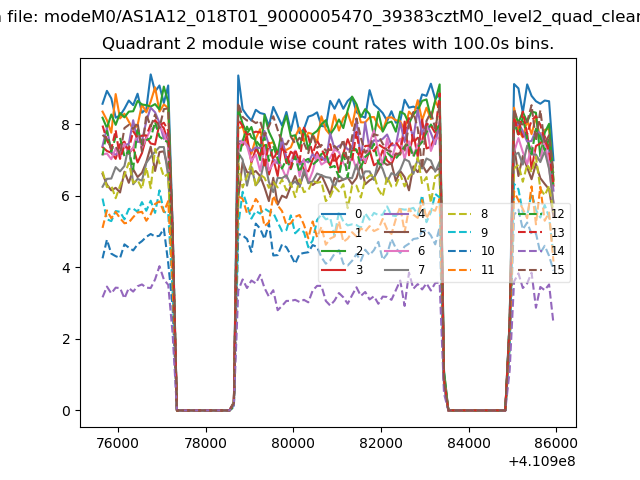
| Module-wise count rates for Quadrant B Data is divided into 100 sec bins |
 |
 |
| Module-wise count rates for Quadrant C Data is divided into 100 sec bins |
 |
 |
| Module-wise count rates for Quadrant D Data is divided into 100 sec bins |
 |
 |
| Parameter | Plot |
|---|---|
| CZT HV Monitor | 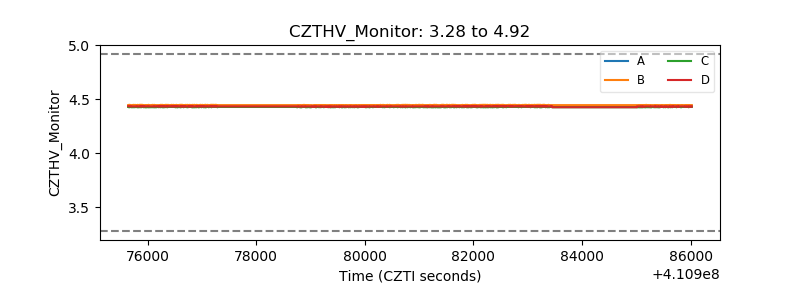 |
| D_VDD | 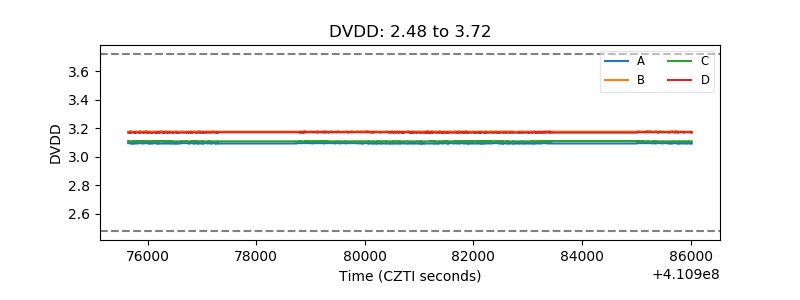 |
| Temperature 1 | 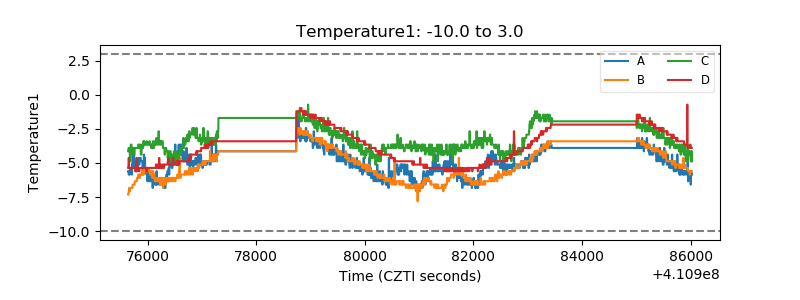 |
| Veto HV Monitor | 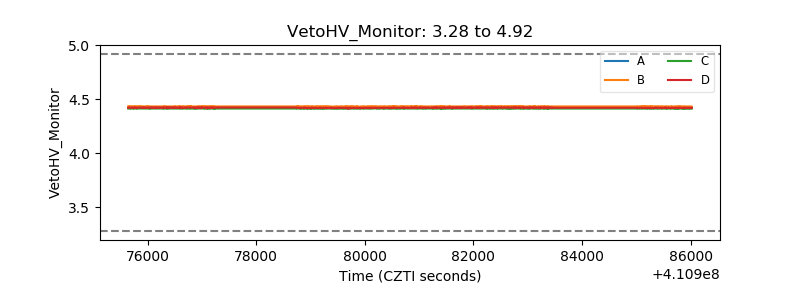 |
| Veto LLD | 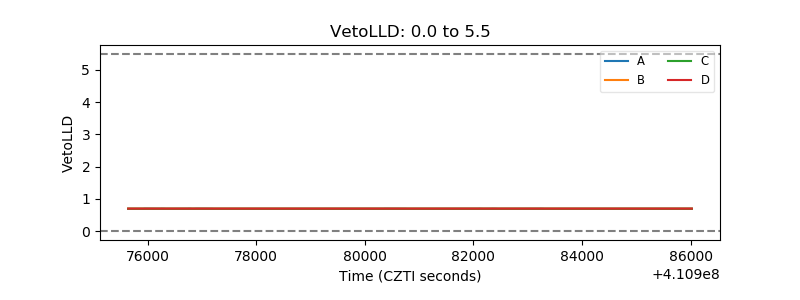 |
| Alpha Counter |  |
| _CPM_Rate | 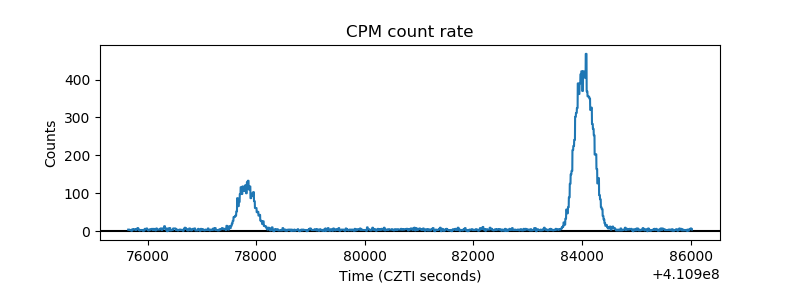 |
| CZT Counter | 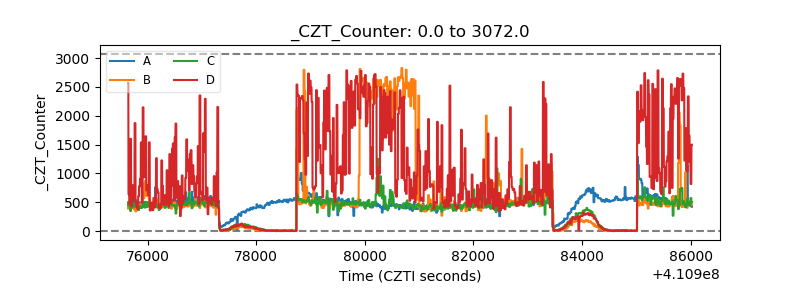 |
| +2.5 Volts monitor | 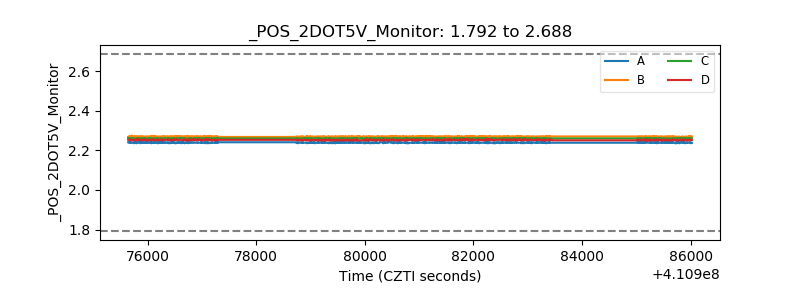 |
| +5 Volts monitor | 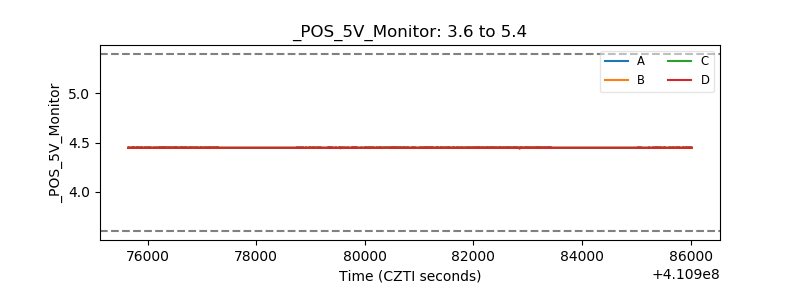 |
| _ROLL_ROT | 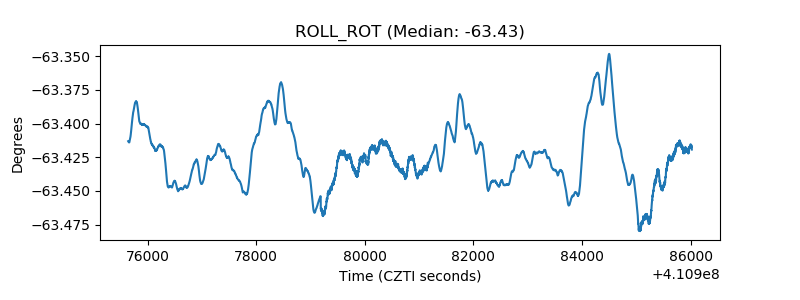 |
| _Roll_DEC | 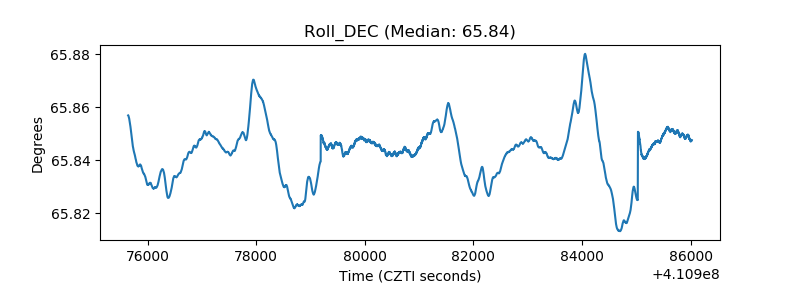 |
| _Roll_RA | 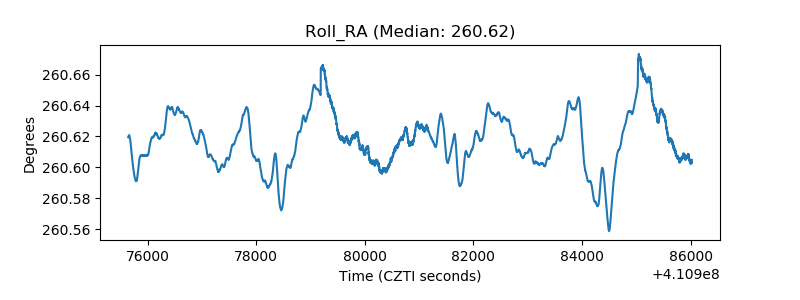 |
| Veto Counter | 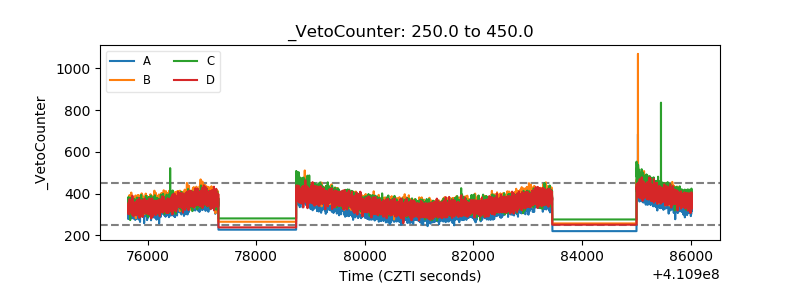 |