| Param | Original file | Final file |
|---|---|---|
| Filename | modeM0/AS1A12_018T01_9000005470_39384cztM0_level2.fits | modeM0/AS1A12_018T01_9000005470_39384cztM0_level2_quad_clean.evt |
| Size (bytes) | 412,090,560 | 86,287,680 |
| Size | 393.0 MB | 82.3 MB |
| Events in quadrant A | 2,678,959 | 597,638 |
| Events in quadrant B | 2,557,942 | 612,622 |
| Events in quadrant C | 2,632,280 | 583,118 |
| Events in quadrant D | 6,969,003 | 445,154 |
| Mode M9 | |||
|---|---|---|---|
| Quadrant | BADHDUFLAG | Total packets | Discarded packets |
| A | 0 | 17 | 0 |
| B | 0 | 17 | 0 |
| C | 0 | 17 | 0 |
| D | 0 | 17 | 0 |
| Mode SS | |||
|---|---|---|---|
| Quadrant | BADHDUFLAG | Total packets | Discarded packets |
| A | 0 | 108 | 0 |
| B | 0 | 108 | 0 |
| C | 0 | 108 | 0 |
| D | 0 | 108 | 0 |
| Mode M0 | |||
|---|---|---|---|
| Quadrant | BADHDUFLAG | Total packets | Discarded packets |
| A | 0 | 11393 | 2 |
| B | 0 | 11216 | 1 |
| C | 0 | 11215 | 1 |
| D | 0 | 24407 | 1 |
| Quadrant | Total seconds | Saturated seconds | Saturation percentage |
|---|---|---|---|
| A | 5345 | 8 | 0.149673% |
| B | 5345 | 24 | 0.449018% |
| C | 5345 | 10 | 0.187091% |
| D | 5345 | 1223 | 22.881197% |
Noise dominated data is calculated using 1-second bins in cleaned event files. If a bin has >2000 counts, and if more than 50% of those come from <1% of pixels, then it is considered to be noise-dominated and hence unusable.
| Quadrant | # 1 sec bins | Bins with >0 counts | Bins with >2000 counts | High rate bins dominated by noise | Noise dominated (total time) | Noise dominated (detector-on time) | Marked lightcurve |
|---|---|---|---|---|---|---|---|
| A | 7018 | 5346 | 2 | 2 | 0.03% | 0.04% | 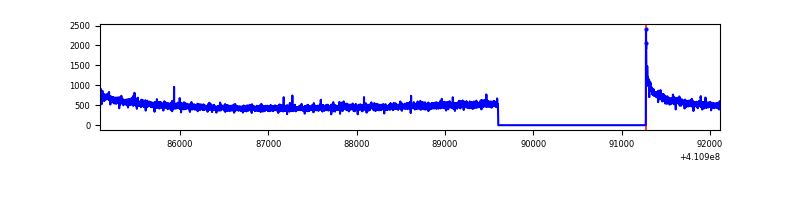 |
| B | 7018 | 5346 | 7 | 7 | 0.10% | 0.13% | 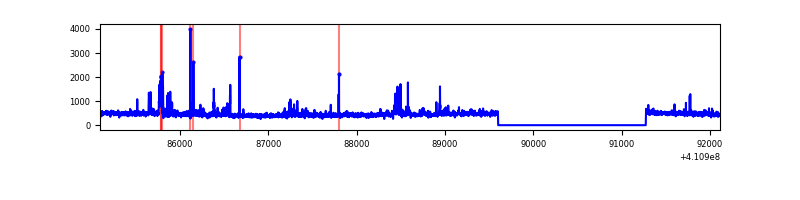 |
| C | 7018 | 5346 | 2 | 2 | 0.03% | 0.04% | 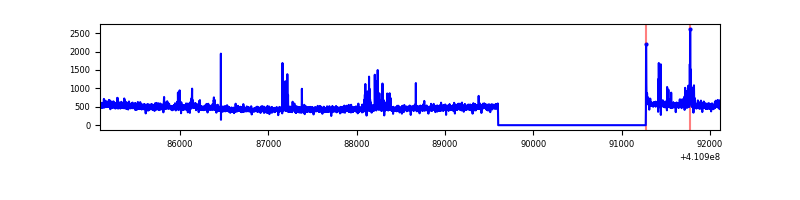 |
| D | 7018 | 5346 | 1047 | 1047 | 14.92% | 19.58% | 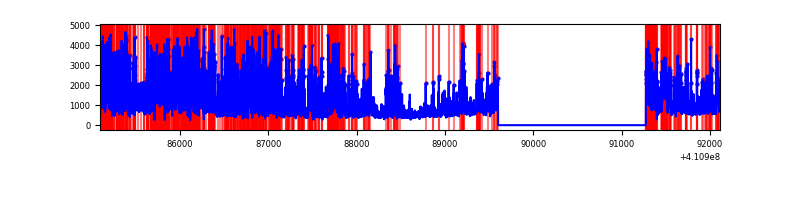 |
Top three noisy pixels from each quadrant. If the there are fewer than three noisy pixels in the level2.evt file, extra rows are filled as -1
| Pixel properties | Quadrant properties | ||||||
|---|---|---|---|---|---|---|---|
| Quadrant | DetID | PixID | Counts | Sigma | Mean | Median | Sigma |
| A | 10 | 83 | 387106 | 3212.96 | 589 | 576 | 120.3 |
| A | 13 | 254 | 7059 | 53.89 | 589 | 576 | 120.3 |
| A | 3 | 137 | 6651 | 50.5 | 589 | 576 | 120.3 |
| B | 5 | 172 | 220473 | 1926.03 | 588 | 570 | 114.2 |
| B | 12 | 111 | 14557 | 122.51 | 588 | 570 | 114.2 |
| B | 11 | 111 | 13522 | 113.44 | 588 | 570 | 114.2 |
| C | 15 | 214 | 227523 | 1665.4 | 581 | 584 | 136.3 |
| C | 14 | 254 | 79793 | 581.28 | 581 | 584 | 136.3 |
| C | 9 | 187 | 37678 | 272.22 | 581 | 584 | 136.3 |
| D | 12 | 235 | 4535756 | 35473.91 | 523 | 506 | 127.8 |
| D | 13 | 249 | 190163 | 1483.46 | 523 | 506 | 127.8 |
| D | 12 | 233 | 181668 | 1417.02 | 523 | 506 | 127.8 |
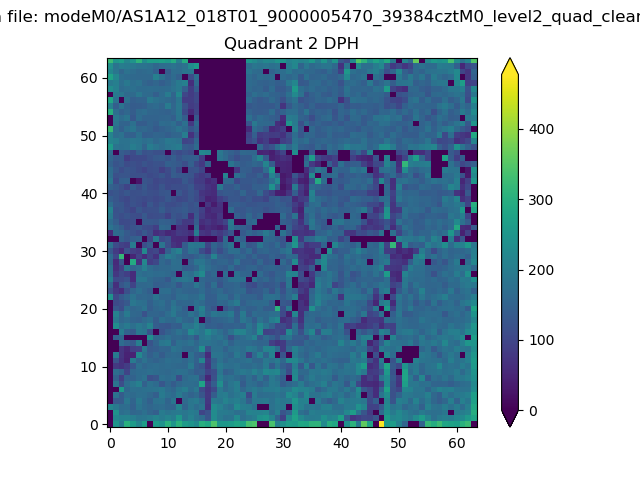
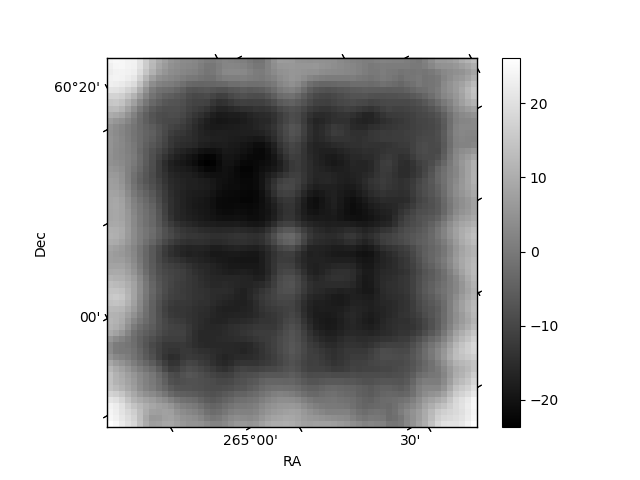
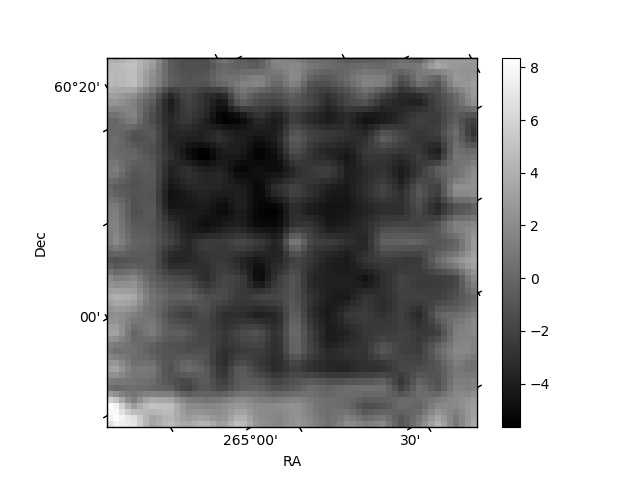
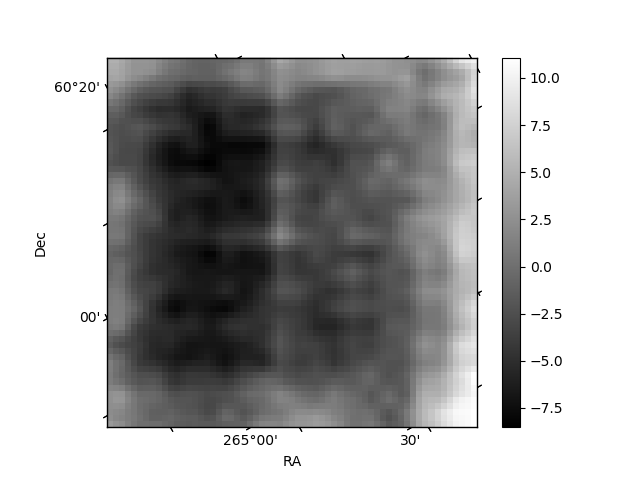
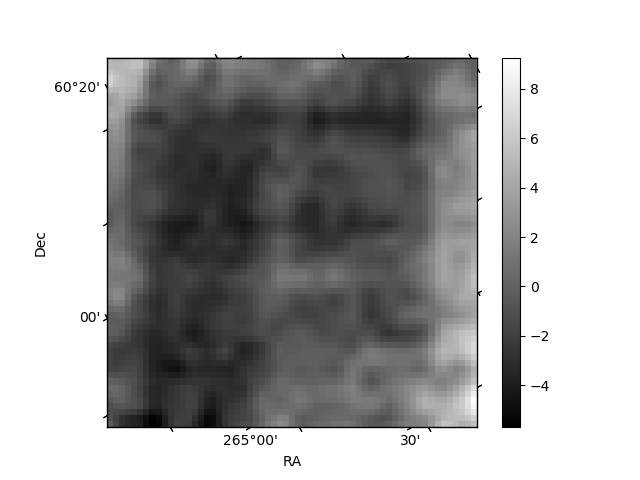
Histogram calculated using DETX and DETY for each event in the final _common_clean file
| Quadrant A | 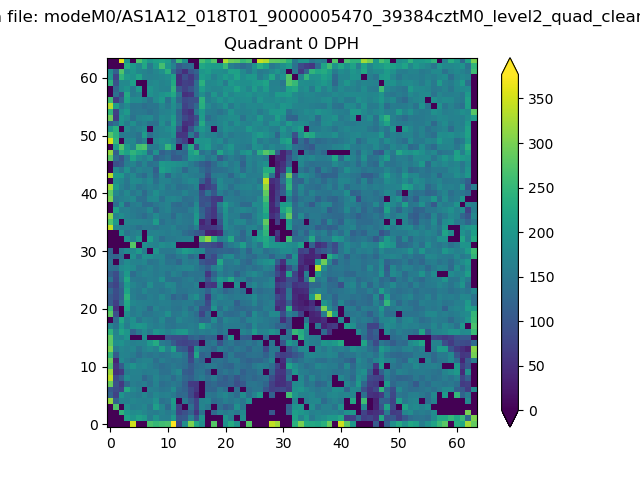 |
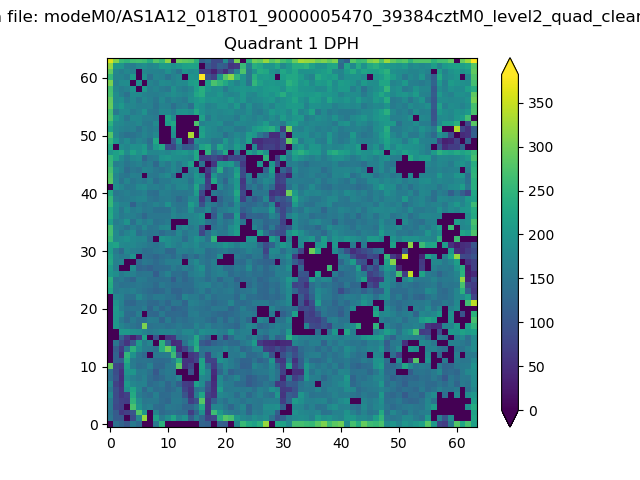 |
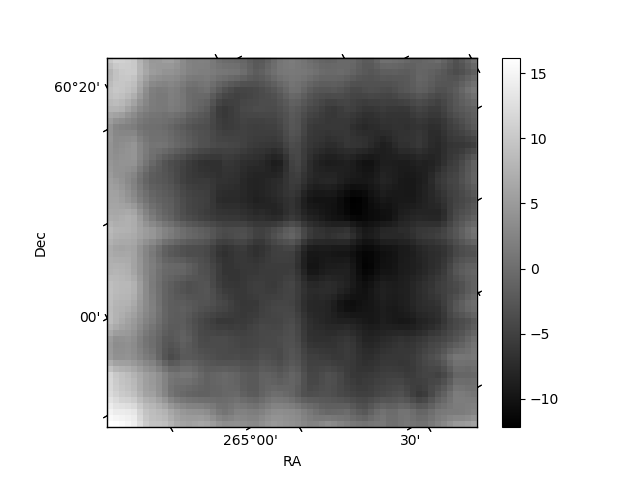
Quadrant B |
|---|---|---|---|
| Quadrant D | 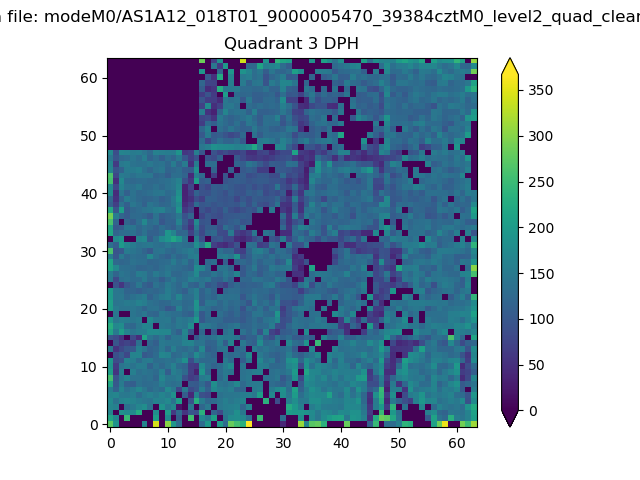 |
 |
Quadrant C |
| Plot type | Count rate plots | Images |
|---|---|---|
| Comparison with Poisson distribution Blue bars denote a histogram of data divided into 1 sec bins. Red curve is a Poisson curve with rate = median count rate of data. |
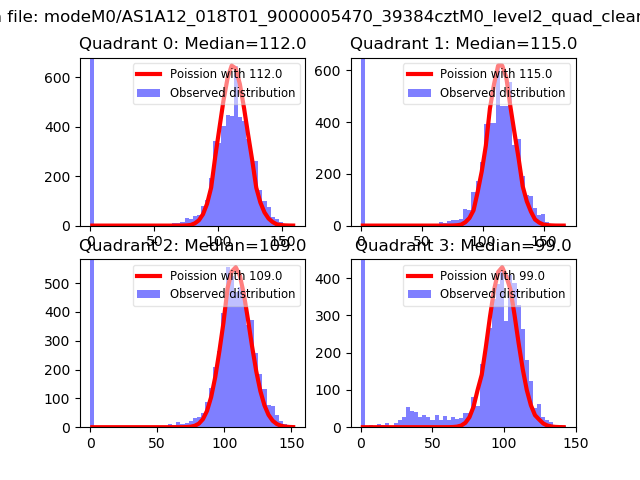 |
 |
| Quadrant-wise count rates Data is divided into 100 sec bins |
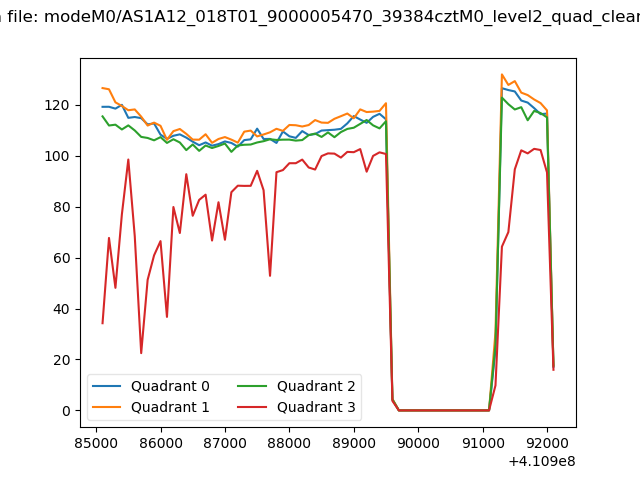 |
|
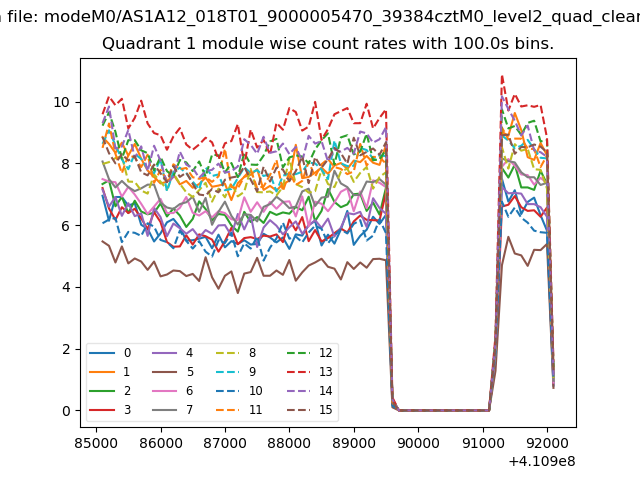
| Module-wise count rates for Quadrant A Data is divided into 100 sec bins |
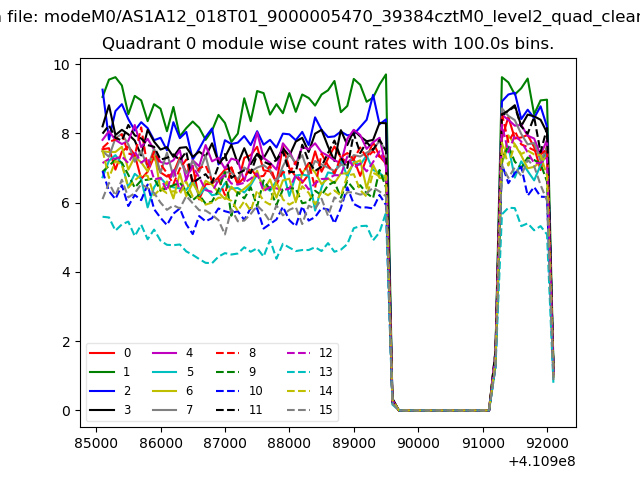 |
 |
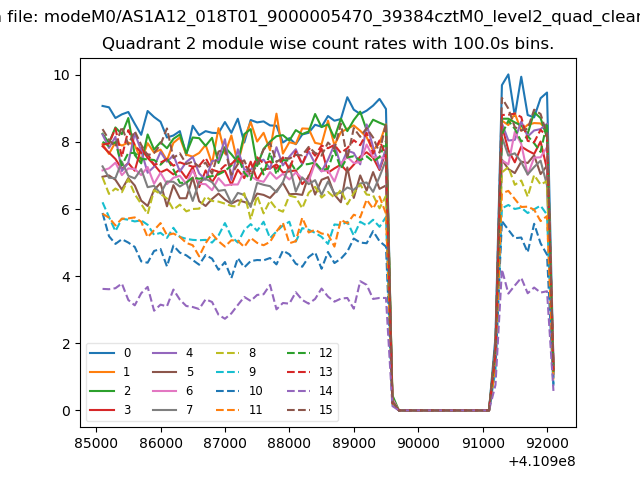
| Module-wise count rates for Quadrant B Data is divided into 100 sec bins |
 |
 |
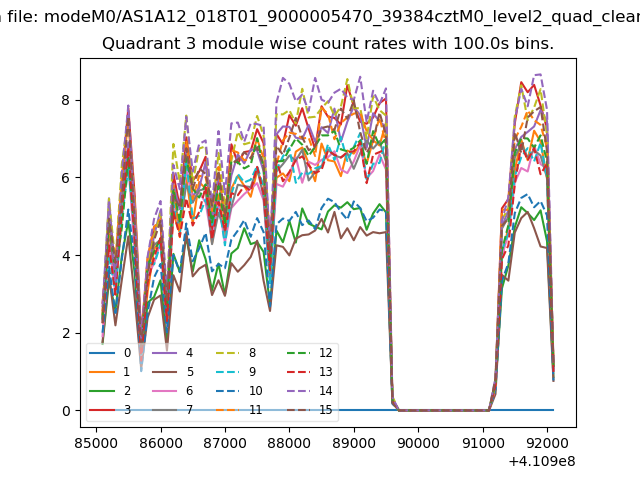
| Module-wise count rates for Quadrant C Data is divided into 100 sec bins |
 |
 |
| Module-wise count rates for Quadrant D Data is divided into 100 sec bins |
 |
 |
| Parameter | Plot |
|---|---|
| CZT HV Monitor |  |
| D_VDD | 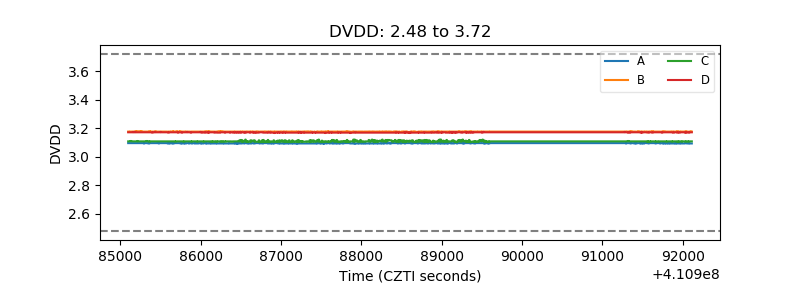 |
| Temperature 1 | 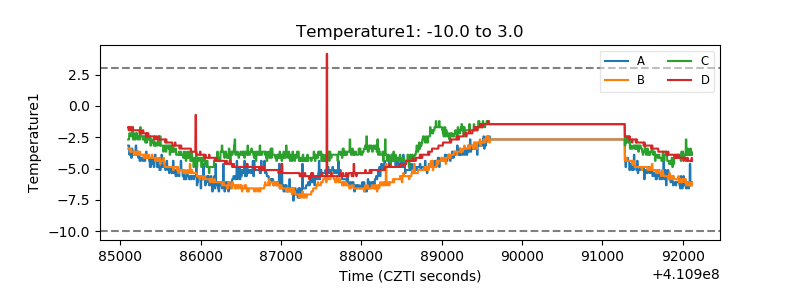 |
| Veto HV Monitor | 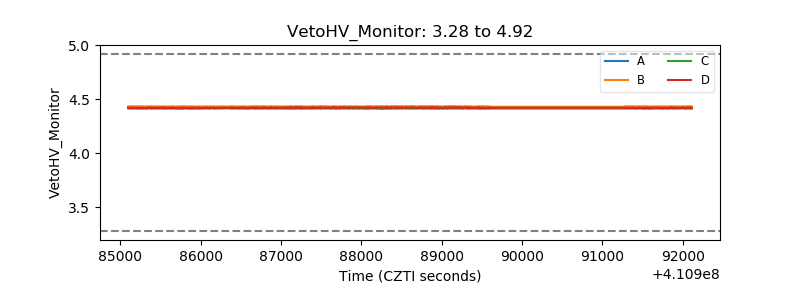 |
| Veto LLD | 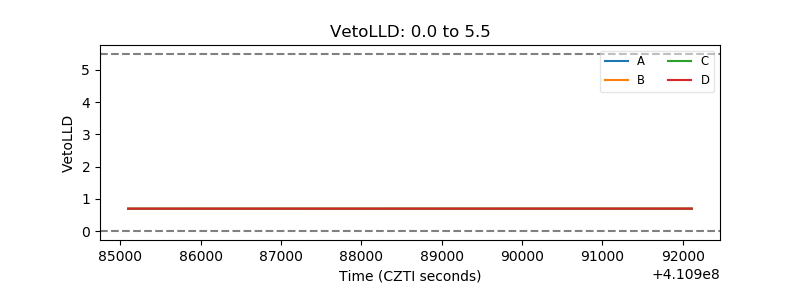 |
| Alpha Counter | 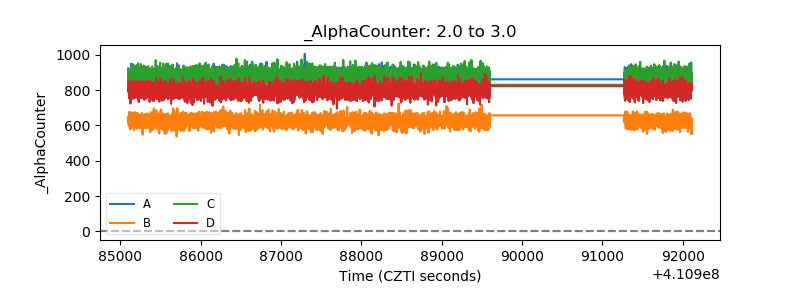 |
| _CPM_Rate | 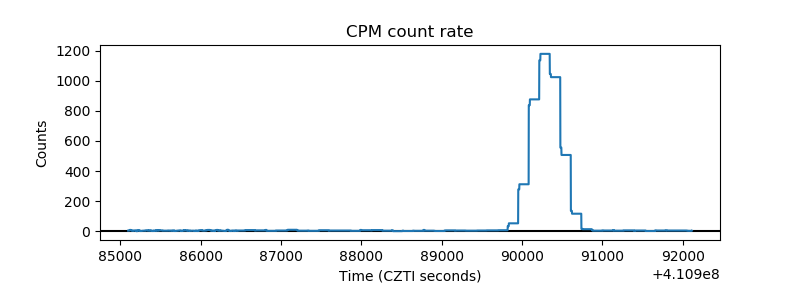 |
| CZT Counter | 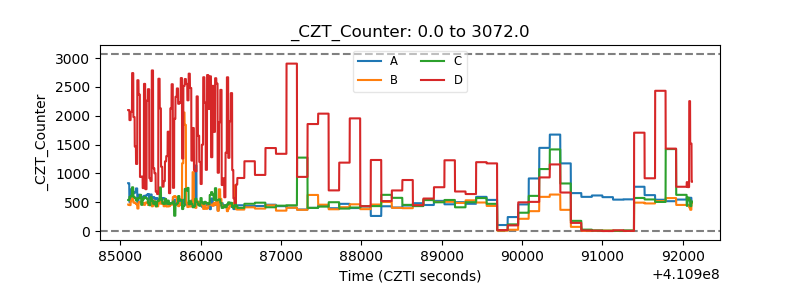 |
| +2.5 Volts monitor | 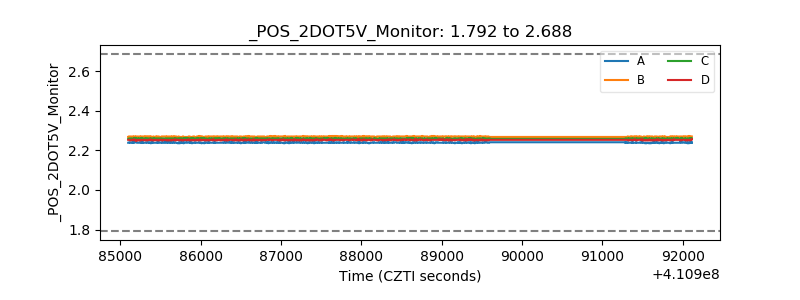 |
| +5 Volts monitor | 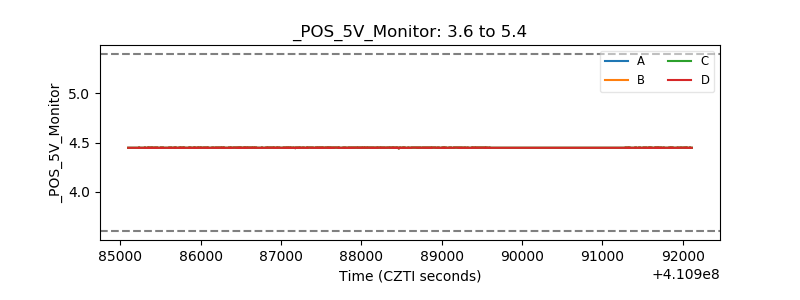 |
| _ROLL_ROT | 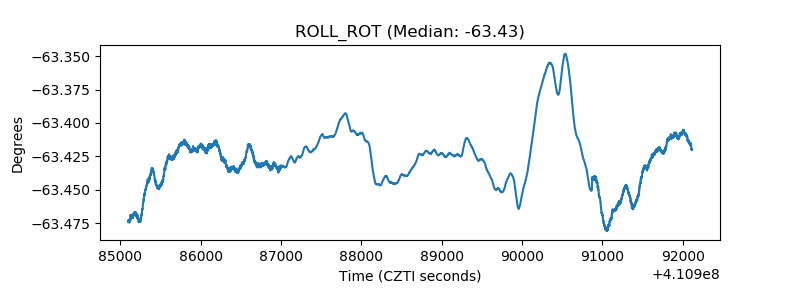 |
| _Roll_DEC | 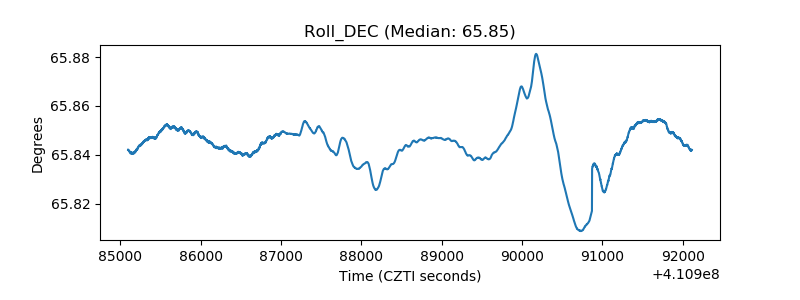 |
| _Roll_RA | 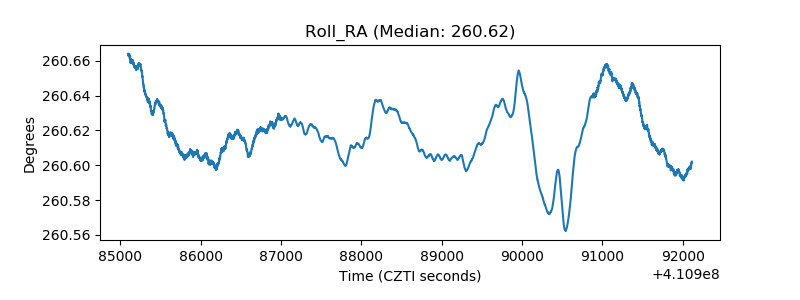 |
| Veto Counter | 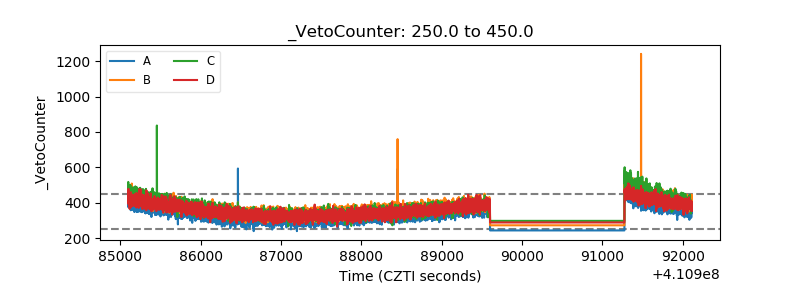 |