| Param | Original file | Final file |
|---|---|---|
| Filename | modeM0/AS1A12_018T01_9000005470_39386cztM0_level2.fits | modeM0/AS1A12_018T01_9000005470_39386cztM0_level2_quad_clean.evt |
| Size (bytes) | 330,903,360 | 86,641,920 |
| Size | 315.6 MB | 82.6 MB |
| Events in quadrant A | 2,667,454 | 586,874 |
| Events in quadrant B | 2,689,044 | 583,127 |
| Events in quadrant C | 2,479,093 | 577,433 |
| Events in quadrant D | 4,015,508 | 518,336 |
| Mode M9 | |||
|---|---|---|---|
| Quadrant | BADHDUFLAG | Total packets | Discarded packets |
| A | 0 | 18 | 0 |
| B | 0 | 18 | 0 |
| C | 0 | 18 | 0 |
| D | 0 | 18 | 0 |
| Mode SS | |||
|---|---|---|---|
| Quadrant | BADHDUFLAG | Total packets | Discarded packets |
| A | 0 | 104 | 0 |
| B | 0 | 104 | 0 |
| C | 0 | 104 | 0 |
| D | 0 | 104 | 0 |
| Mode M0 | |||
|---|---|---|---|
| Quadrant | BADHDUFLAG | Total packets | Discarded packets |
| A | 0 | 11166 | 2 |
| B | 0 | 11475 | 1 |
| C | 0 | 10704 | 1 |
| D | 0 | 15481 | 1 |
| Quadrant | Total seconds | Saturated seconds | Saturation percentage |
|---|---|---|---|
| A | 5106 | 9 | 0.176263% |
| B | 5106 | 199 | 3.897376% |
| C | 5106 | 8 | 0.156678% |
| D | 5106 | 230 | 4.504505% |
Noise dominated data is calculated using 1-second bins in cleaned event files. If a bin has >2000 counts, and if more than 50% of those come from <1% of pixels, then it is considered to be noise-dominated and hence unusable.
| Quadrant | # 1 sec bins | Bins with >0 counts | Bins with >2000 counts | High rate bins dominated by noise | Noise dominated (total time) | Noise dominated (detector-on time) | Marked lightcurve |
|---|---|---|---|---|---|---|---|
| A | 6929 | 5107 | 4 | 4 | 0.06% | 0.08% | 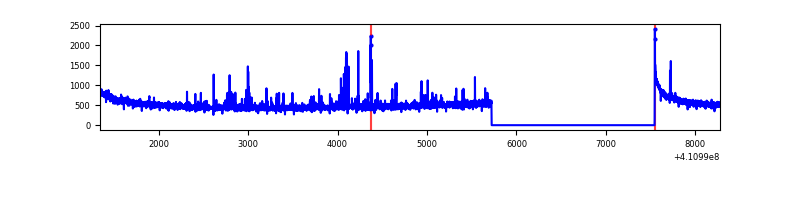 |
| B | 6929 | 5107 | 130 | 130 | 1.88% | 2.55% | 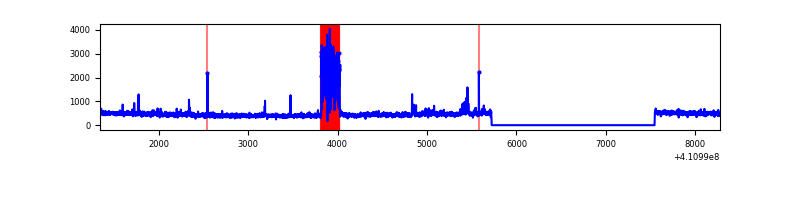 |
| C | 6929 | 5107 | 1 | 1 | 0.01% | 0.02% | 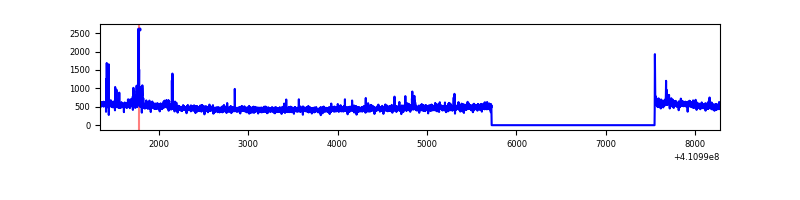 |
| D | 6929 | 5107 | 204 | 204 | 2.94% | 3.99% | 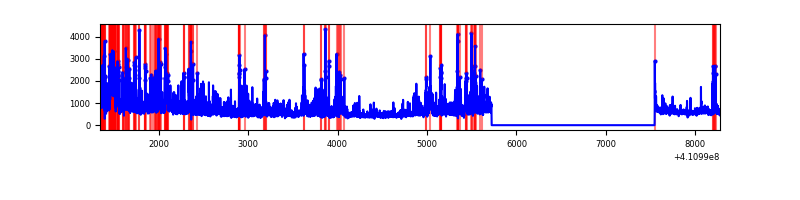 |
Top three noisy pixels from each quadrant. If the there are fewer than three noisy pixels in the level2.evt file, extra rows are filled as -1
| Pixel properties | Quadrant properties | ||||||
|---|---|---|---|---|---|---|---|
| Quadrant | DetID | PixID | Counts | Sigma | Mean | Median | Sigma |
| A | 10 | 83 | 374329 | 3253.72 | 565 | 553 | 114.9 |
| A | 2 | 79 | 101928 | 882.47 | 565 | 553 | 114.9 |
| A | 13 | 254 | 7987 | 64.71 | 565 | 553 | 114.9 |
| B | 5 | 200 | 413673 | 3793.54 | 556 | 539 | 108.9 |
| B | 5 | 172 | 61502 | 559.78 | 556 | 539 | 108.9 |
| B | 0 | 230 | 22149 | 198.43 | 556 | 539 | 108.9 |
| C | 15 | 214 | 215863 | 1655.41 | 557 | 560 | 130.1 |
| C | 9 | 187 | 39859 | 302.16 | 557 | 560 | 130.1 |
| C | 14 | 254 | 39196 | 297.06 | 557 | 560 | 130.1 |
| D | 12 | 235 | 1471473 | 11123.78 | 544 | 529 | 132.2 |
| D | 13 | 249 | 160864 | 1212.51 | 544 | 529 | 132.2 |
| D | 12 | 233 | 136898 | 1031.27 | 544 | 529 | 132.2 |
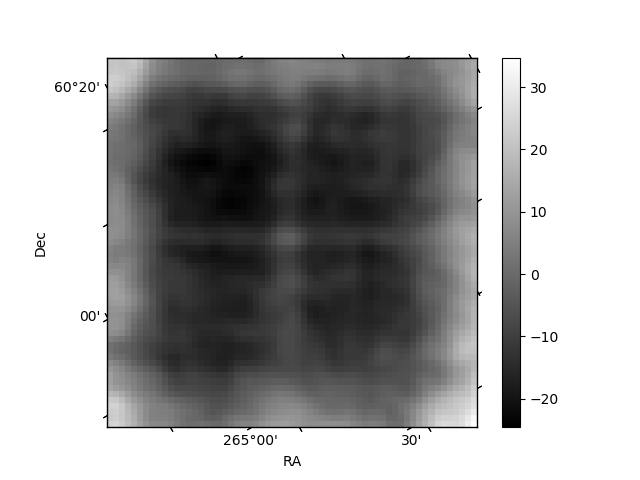
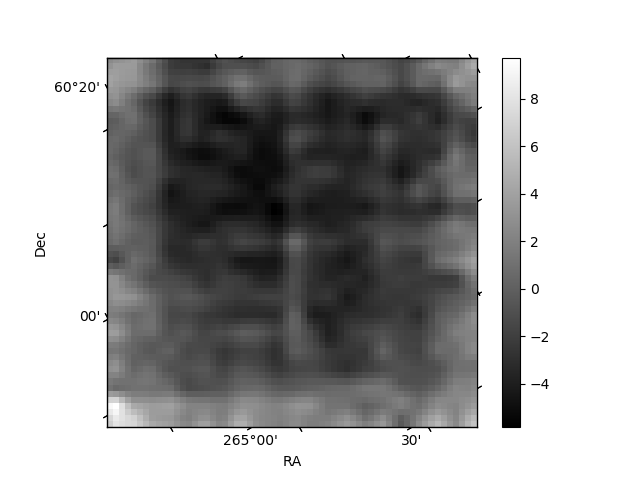
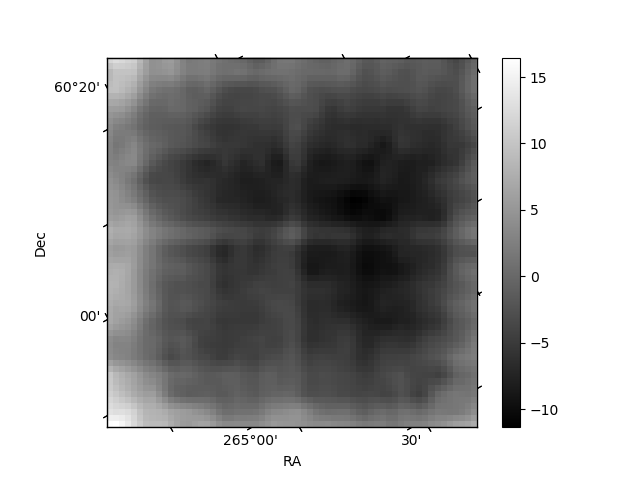
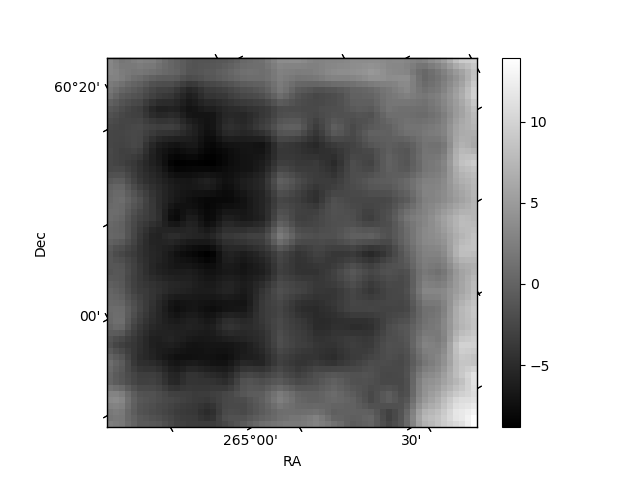
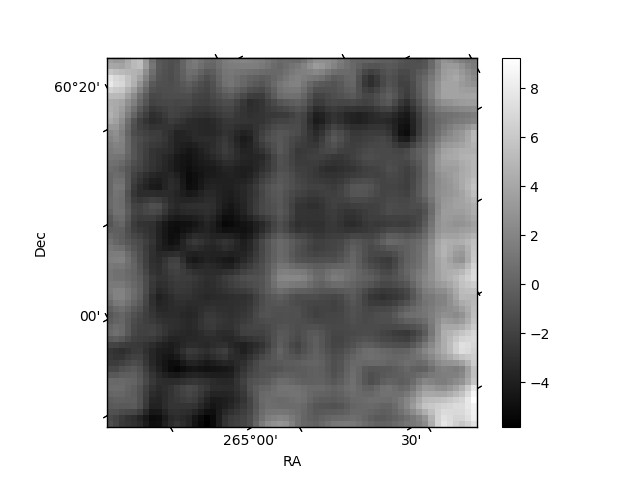
Histogram calculated using DETX and DETY for each event in the final _common_clean file
| Quadrant A | 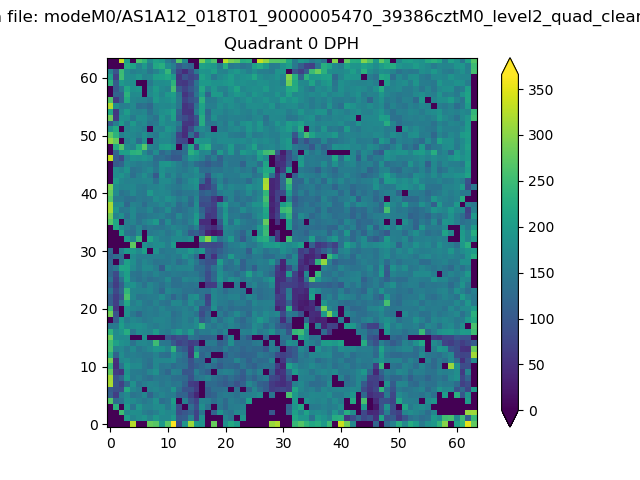 |
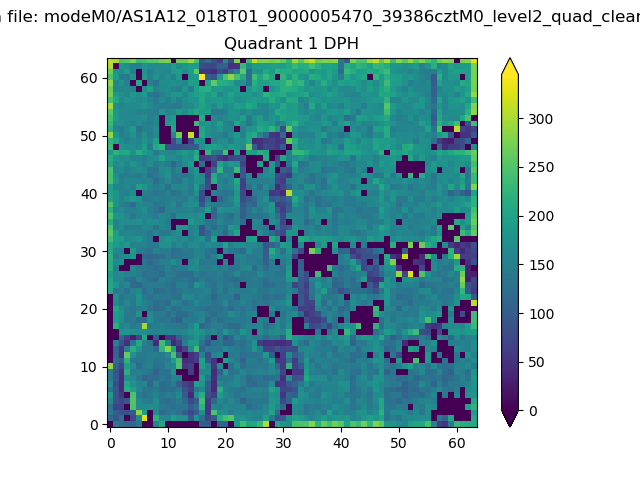 |
Quadrant B |
|---|---|---|---|
| Quadrant D | 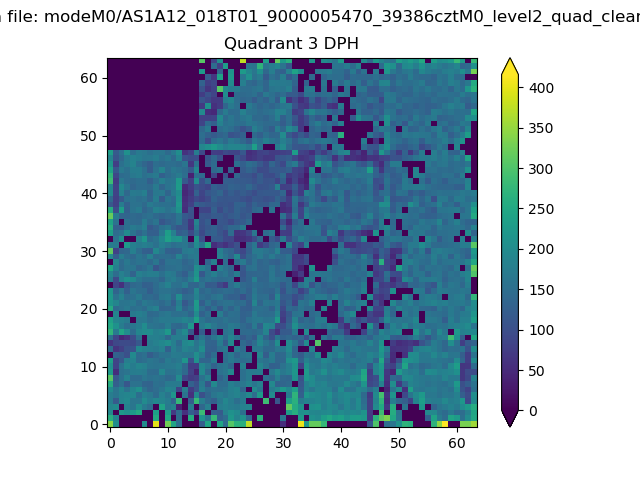 |
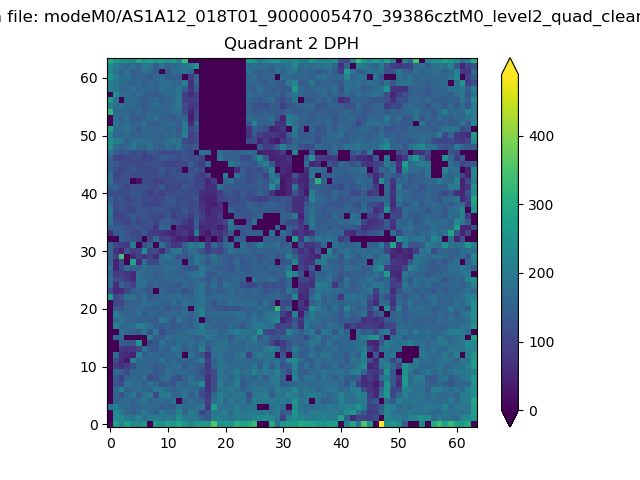 |
Quadrant C |
| Plot type | Count rate plots | Images |
|---|---|---|
| Comparison with Poisson distribution Blue bars denote a histogram of data divided into 1 sec bins. Red curve is a Poisson curve with rate = median count rate of data. |
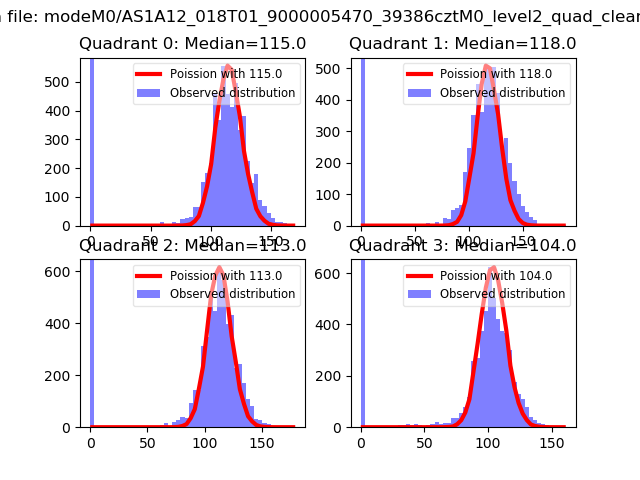 |
 |
| Quadrant-wise count rates Data is divided into 100 sec bins |
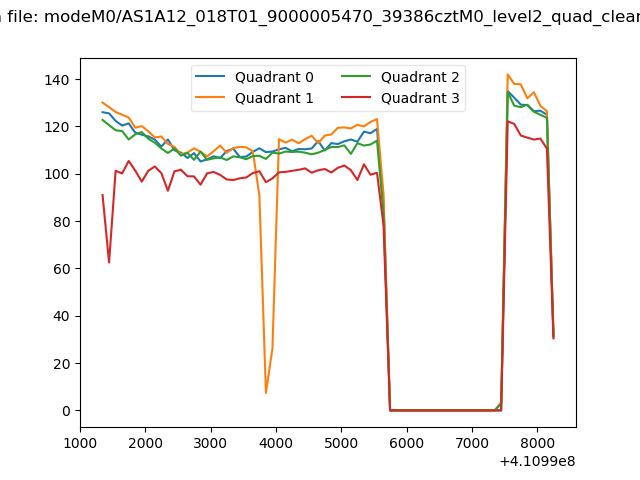 |
|
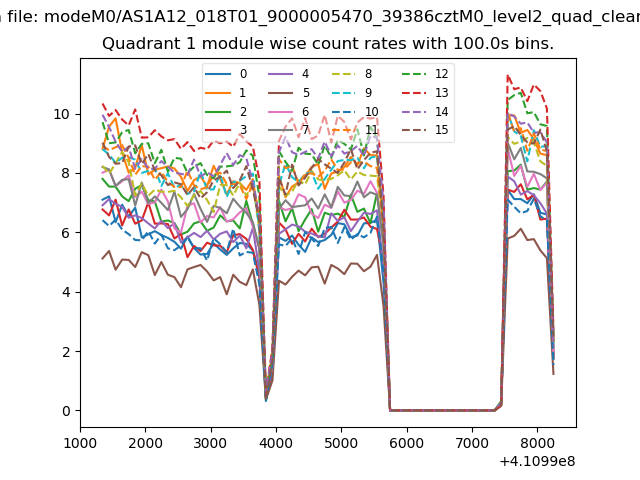
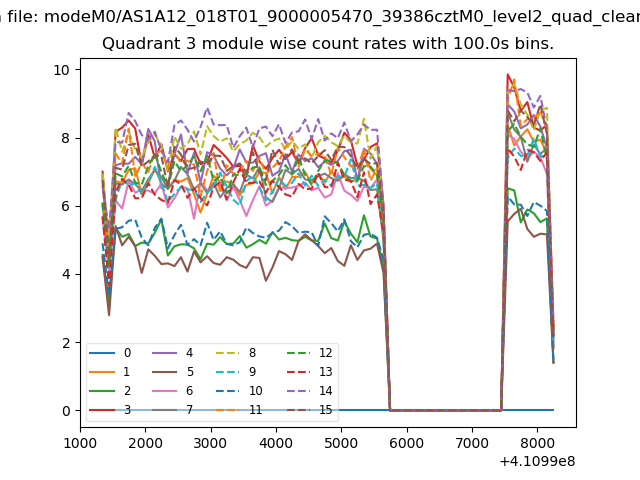
| Module-wise count rates for Quadrant A Data is divided into 100 sec bins |
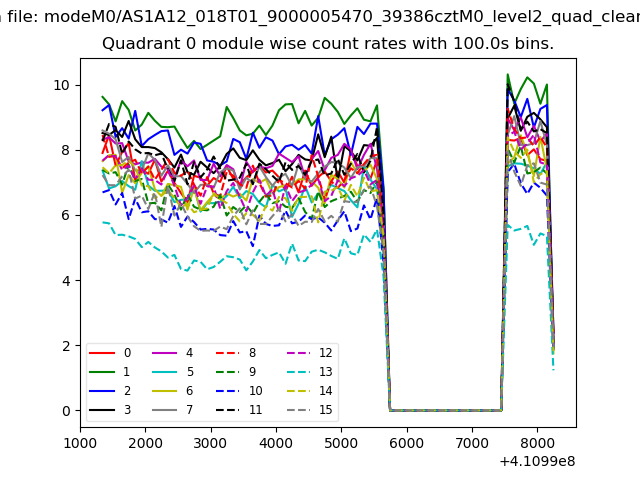 |
 |
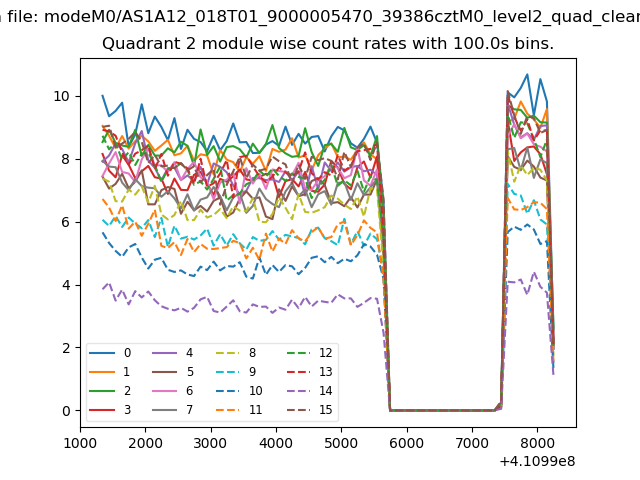
| Module-wise count rates for Quadrant B Data is divided into 100 sec bins |
 |
 |
| Module-wise count rates for Quadrant C Data is divided into 100 sec bins |
 |
 |
| Module-wise count rates for Quadrant D Data is divided into 100 sec bins |
 |
 |
| Parameter | Plot |
|---|---|
| CZT HV Monitor | 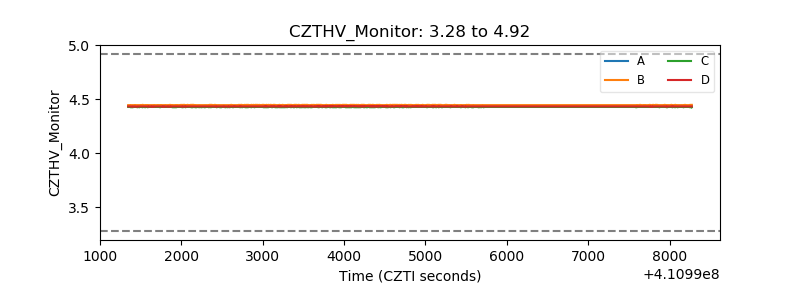 |
| D_VDD | 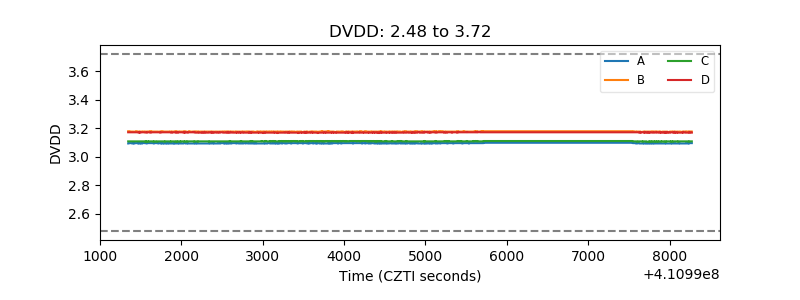 |
| Temperature 1 | 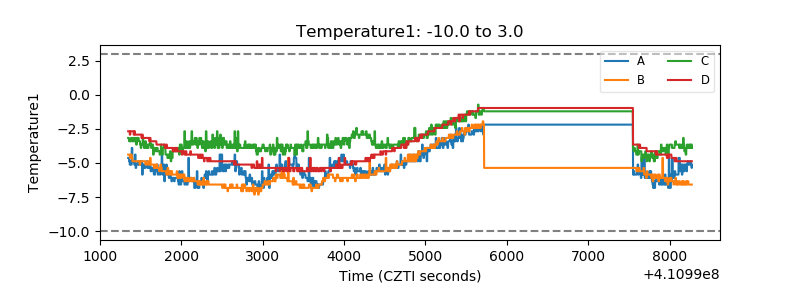 |
| Veto HV Monitor | 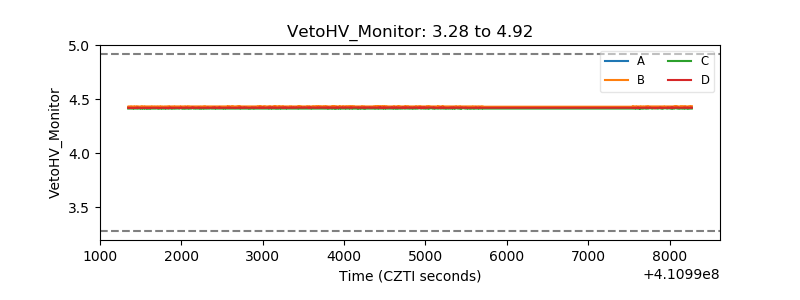 |
| Veto LLD | 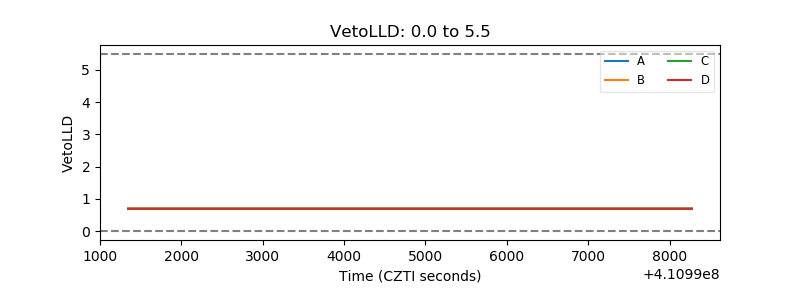 |
| Alpha Counter | 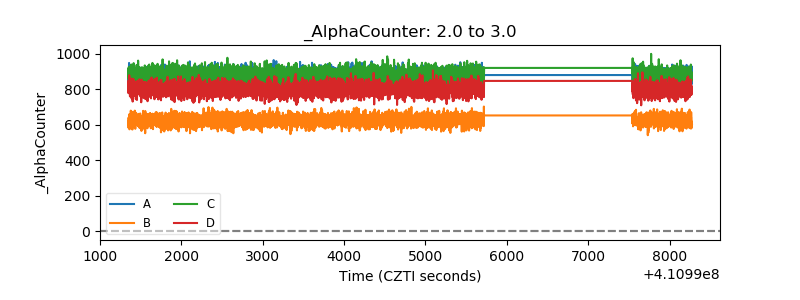 |
| _CPM_Rate | 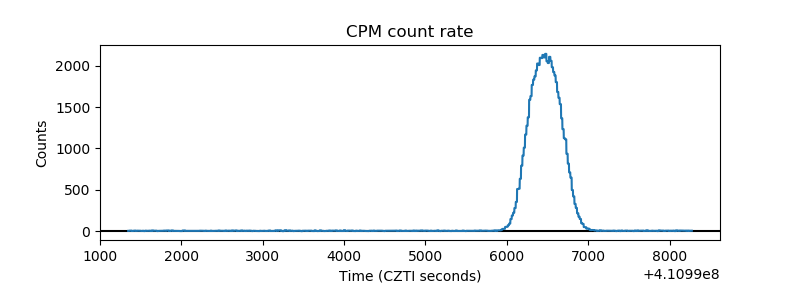 |
| CZT Counter | 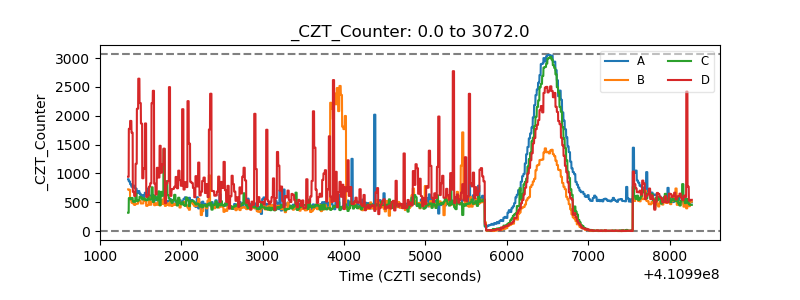 |
| +2.5 Volts monitor |  |
| +5 Volts monitor | 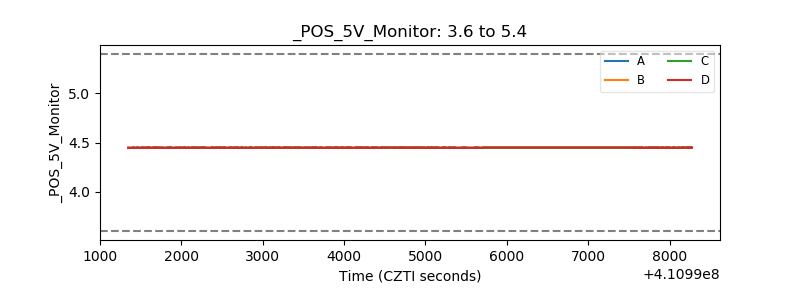 |
| _ROLL_ROT | 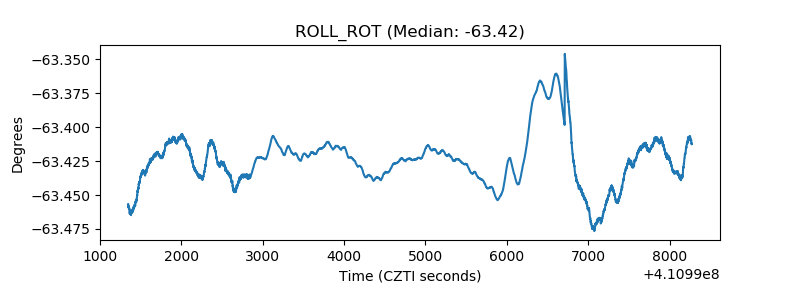 |
| _Roll_DEC | 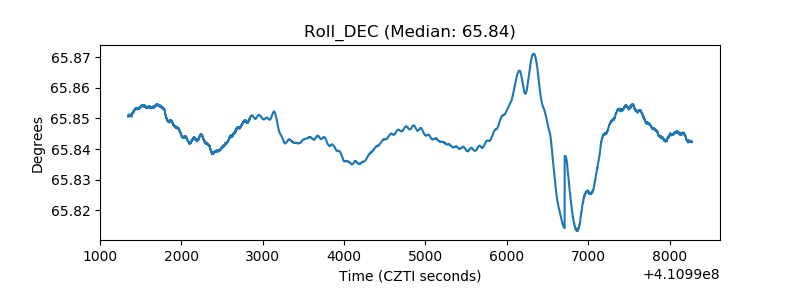 |
| _Roll_RA | 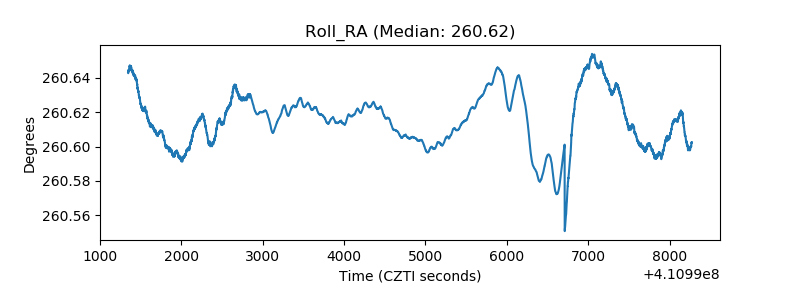 |
| Veto Counter | 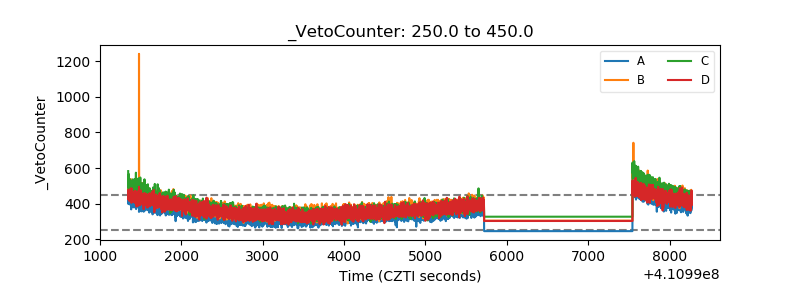 |