| Param | Original file | Final file |
|---|---|---|
| Filename | modeM0/AS1A12_018T01_9000005470_39388cztM0_level2.fits | modeM0/AS1A12_018T01_9000005470_39388cztM0_level2_quad_clean.evt |
| Size (bytes) | 609,952,320 | 169,067,520 |
| Size | 581.7 MB | 161.2 MB |
| Events in quadrant A | 4,937,211 | 1,152,299 |
| Events in quadrant B | 4,432,284 | 1,197,019 |
| Events in quadrant C | 4,797,941 | 1,130,490 |
| Events in quadrant D | 7,665,613 | 973,798 |
| Mode M9 | |||
|---|---|---|---|
| Quadrant | BADHDUFLAG | Total packets | Discarded packets |
| A | 0 | 48 | 0 |
| B | 0 | 48 | 0 |
| C | 0 | 48 | 0 |
| D | 0 | 49 | 0 |
| Mode SS | |||
|---|---|---|---|
| Quadrant | BADHDUFLAG | Total packets | Discarded packets |
| A | 0 | 196 | 0 |
| B | 0 | 196 | 0 |
| C | 0 | 196 | 0 |
| D | 0 | 196 | 0 |
| Mode M0 | |||
|---|---|---|---|
| Quadrant | BADHDUFLAG | Total packets | Discarded packets |
| A | 0 | 20542 | 3 |
| B | 0 | 19604 | 2 |
| C | 0 | 20173 | 2 |
| D | 0 | 29346 | 2 |
| Quadrant | Total seconds | Saturated seconds | Saturation percentage |
|---|---|---|---|
| A | 9607 | 17 | 0.176954% |
| B | 9607 | 16 | 0.166545% |
| C | 9607 | 14 | 0.145727% |
| D | 9607 | 712 | 7.411263% |
Noise dominated data is calculated using 1-second bins in cleaned event files. If a bin has >2000 counts, and if more than 50% of those come from <1% of pixels, then it is considered to be noise-dominated and hence unusable.
| Quadrant | # 1 sec bins | Bins with >0 counts | Bins with >2000 counts | High rate bins dominated by noise | Noise dominated (total time) | Noise dominated (detector-on time) | Marked lightcurve |
|---|---|---|---|---|---|---|---|
| A | 13612 | 9609 | 5 | 5 | 0.04% | 0.05% | 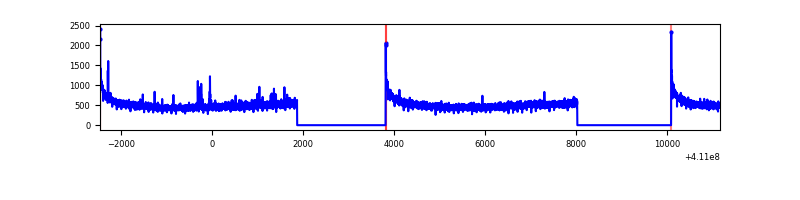 |
| B | 13612 | 9609 | 9 | 9 | 0.07% | 0.09% | 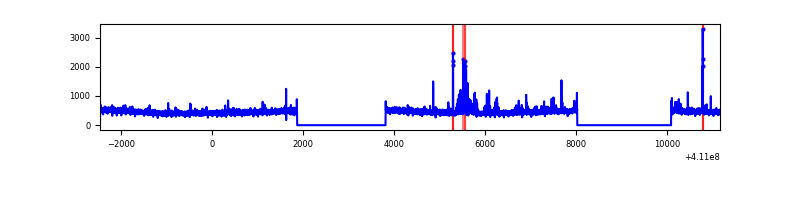 |
| C | 13612 | 9609 | 8 | 8 | 0.06% | 0.08% | 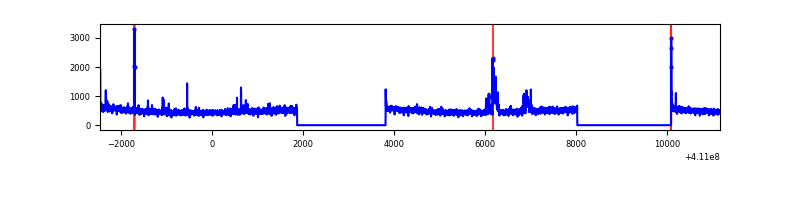 |
| D | 13612 | 9608 | 645 | 645 | 4.74% | 6.71% | 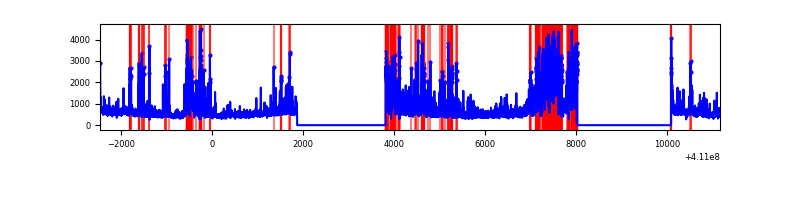 |
Top three noisy pixels from each quadrant. If the there are fewer than three noisy pixels in the level2.evt file, extra rows are filled as -1
| Pixel properties | Quadrant properties | ||||||
|---|---|---|---|---|---|---|---|
| Quadrant | DetID | PixID | Counts | Sigma | Mean | Median | Sigma |
| A | 10 | 83 | 706987 | 3248.4 | 1081 | 1059 | 217.3 |
| A | 2 | 79 | 39739 | 177.99 | 1081 | 1059 | 217.3 |
| A | 13 | 254 | 13232 | 56.02 | 1081 | 1059 | 217.3 |
| B | 5 | 172 | 126597 | 617.42 | 1083 | 1055 | 203.3 |
| B | 12 | 111 | 25761 | 121.5 | 1083 | 1055 | 203.3 |
| B | 5 | 200 | 23227 | 109.04 | 1083 | 1055 | 203.3 |
| C | 15 | 214 | 415019 | 1711.95 | 1055 | 1062 | 241.8 |
| C | 9 | 187 | 207348 | 853.11 | 1055 | 1062 | 241.8 |
| C | 0 | 10 | 26330 | 104.5 | 1055 | 1062 | 241.8 |
| D | 12 | 235 | 2589495 | 10538.74 | 1007 | 977 | 245.6 |
| D | 2 | 120 | 610570 | 2481.86 | 1007 | 977 | 245.6 |
| D | 13 | 249 | 444239 | 1804.67 | 1007 | 977 | 245.6 |
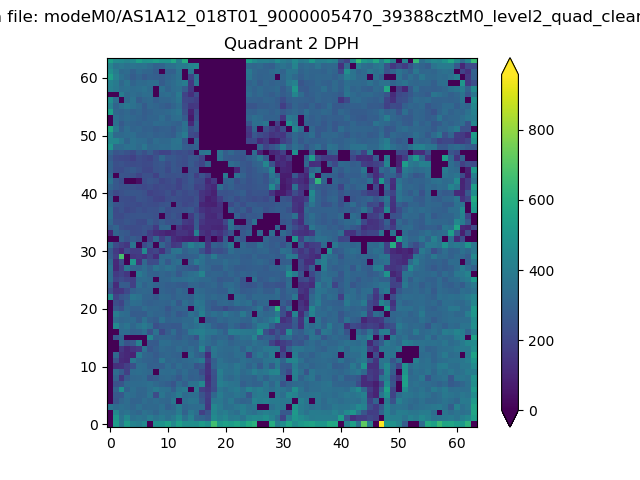
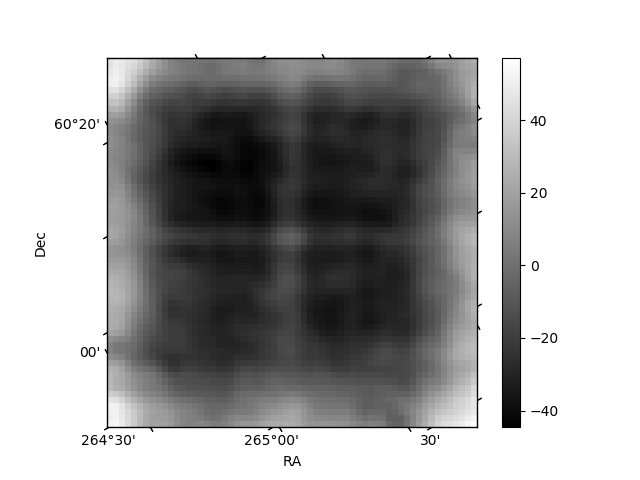
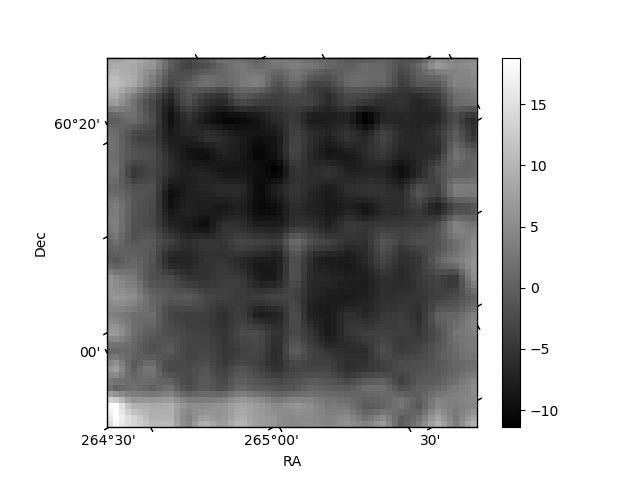
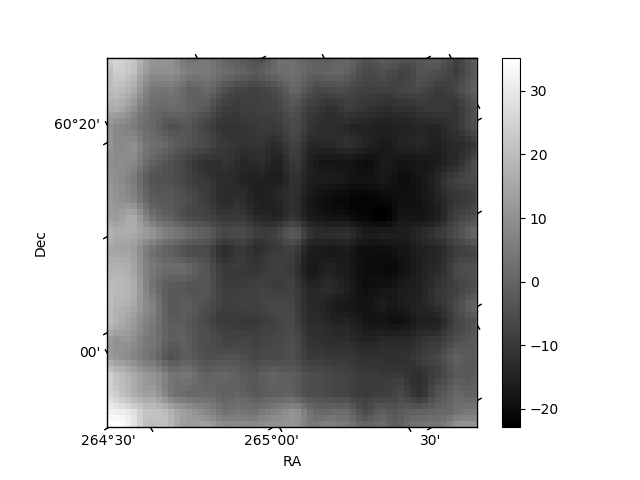
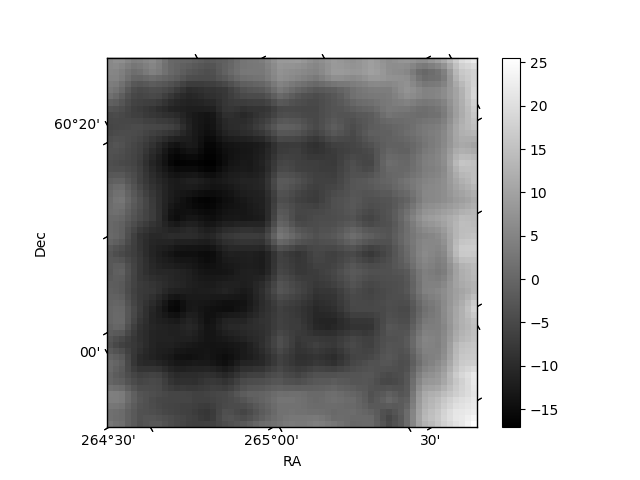
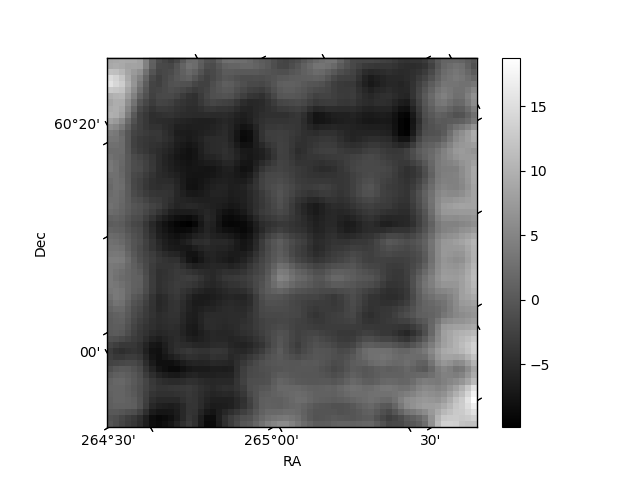
Histogram calculated using DETX and DETY for each event in the final _common_clean file
| Quadrant A | 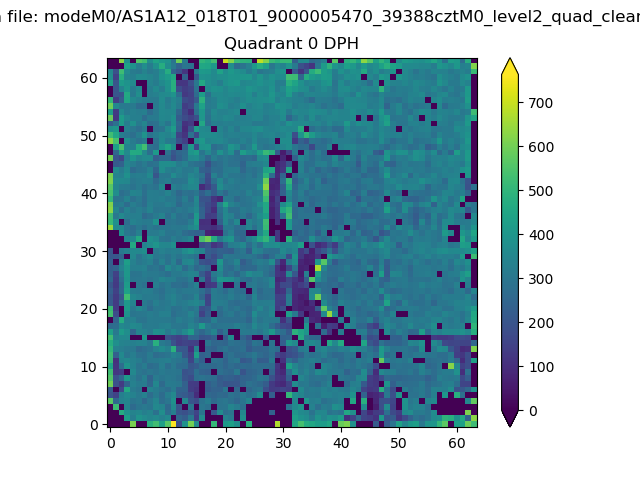 |
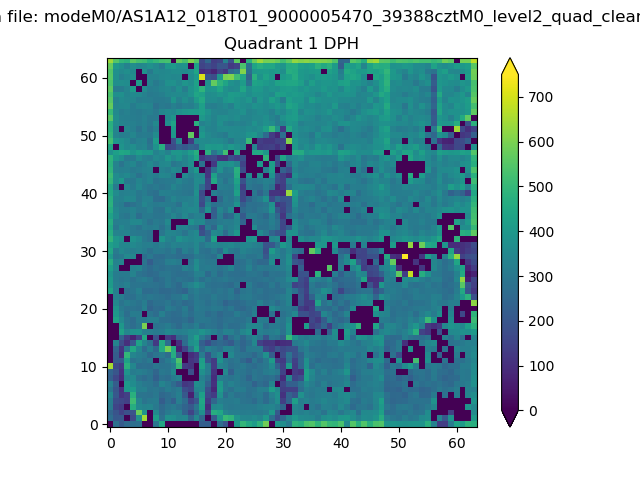 |
Quadrant B |
|---|---|---|---|
| Quadrant D | 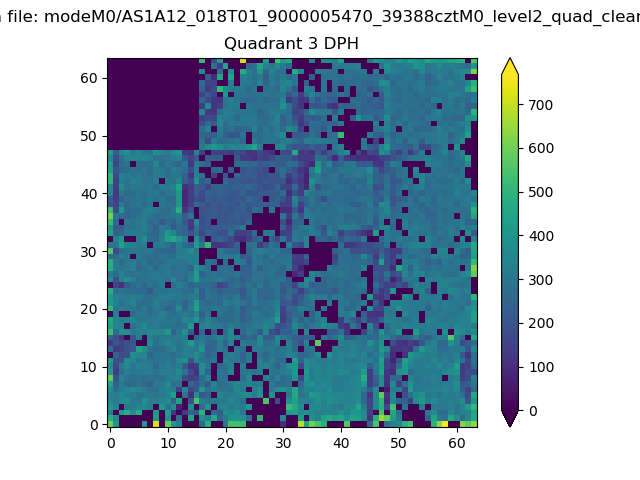 |
 |
Quadrant C |
| Plot type | Count rate plots | Images |
|---|---|---|
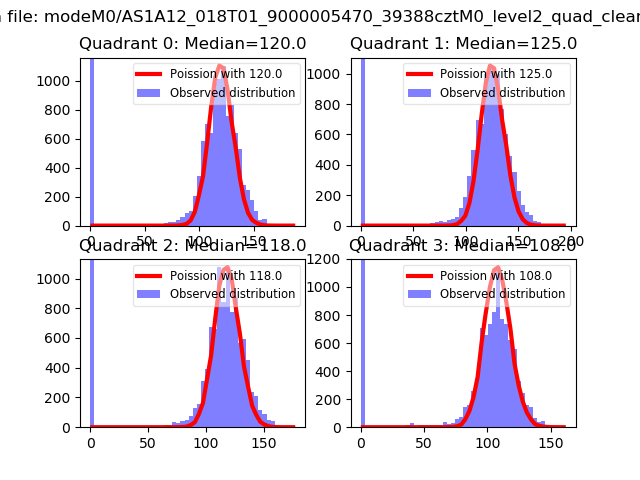
| Comparison with Poisson distribution Blue bars denote a histogram of data divided into 1 sec bins. Red curve is a Poisson curve with rate = median count rate of data. |
 |
 |
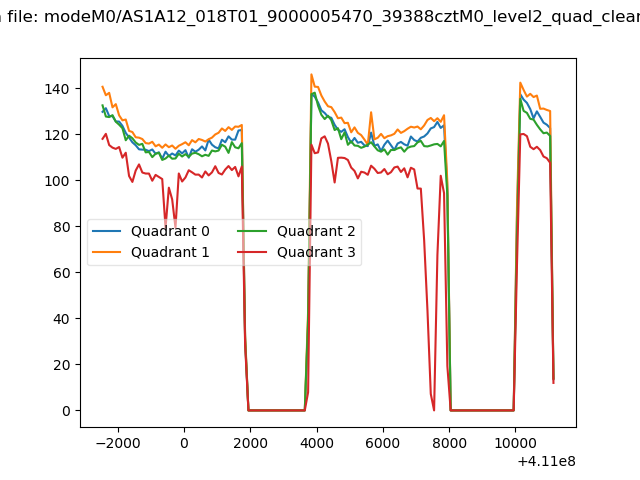
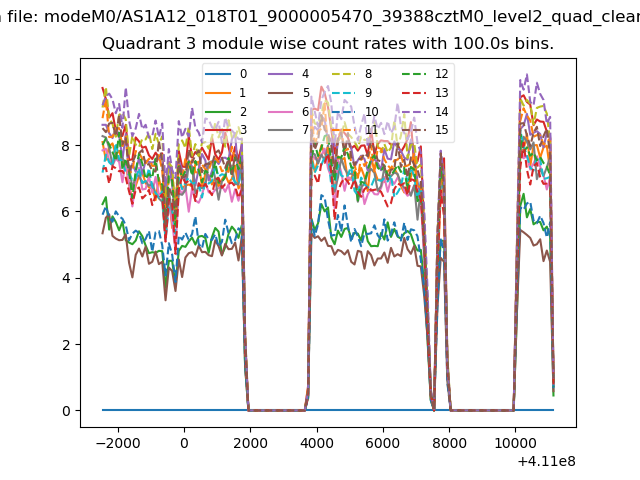
| Quadrant-wise count rates Data is divided into 100 sec bins |
 |
|
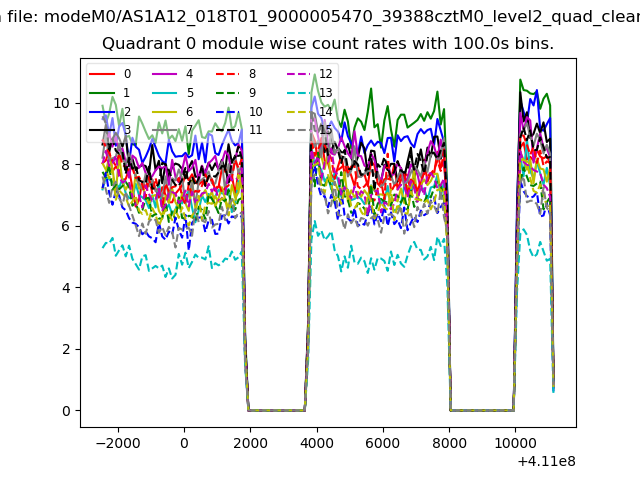
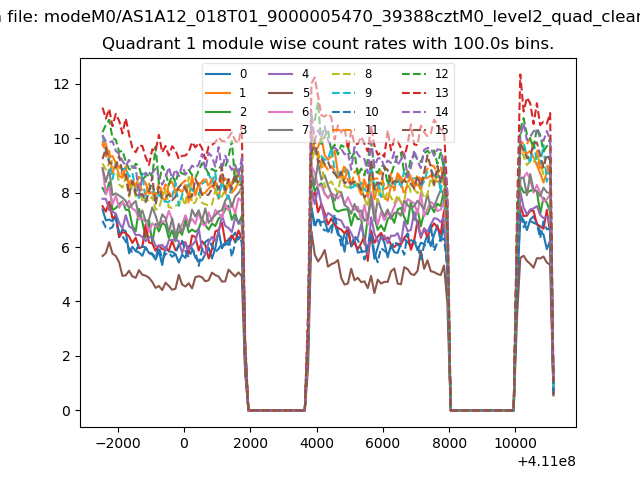
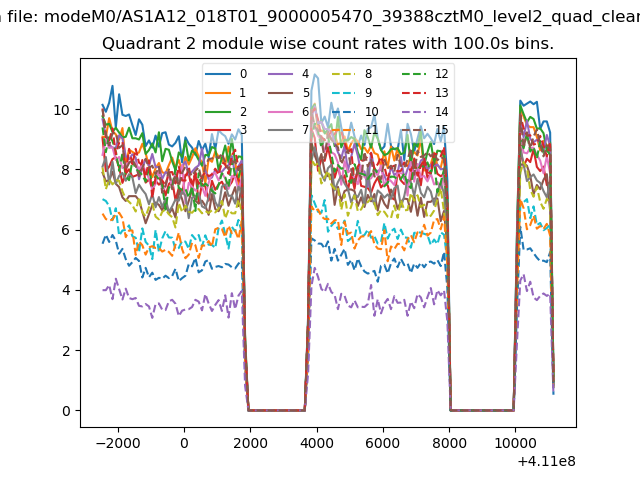
| Module-wise count rates for Quadrant A Data is divided into 100 sec bins |
 |
 |
| Module-wise count rates for Quadrant B Data is divided into 100 sec bins |
 |
 |
| Module-wise count rates for Quadrant C Data is divided into 100 sec bins |
 |
 |
| Module-wise count rates for Quadrant D Data is divided into 100 sec bins |
 |
 |
| Parameter | Plot |
|---|---|
| CZT HV Monitor | 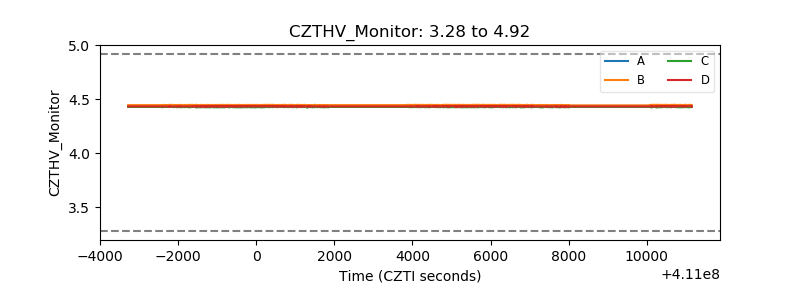 |
| D_VDD | 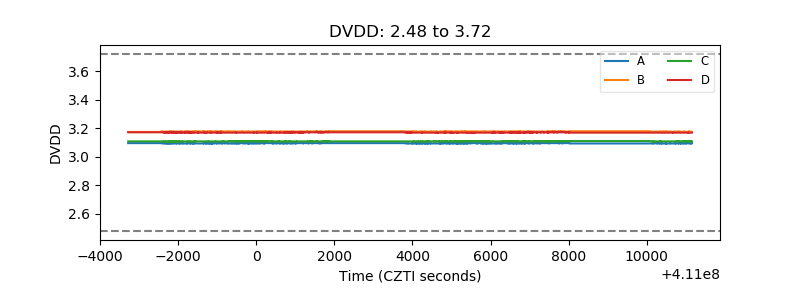 |
| Temperature 1 | 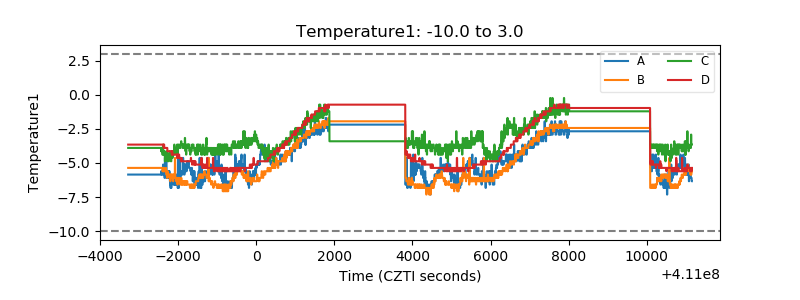 |
| Veto HV Monitor | 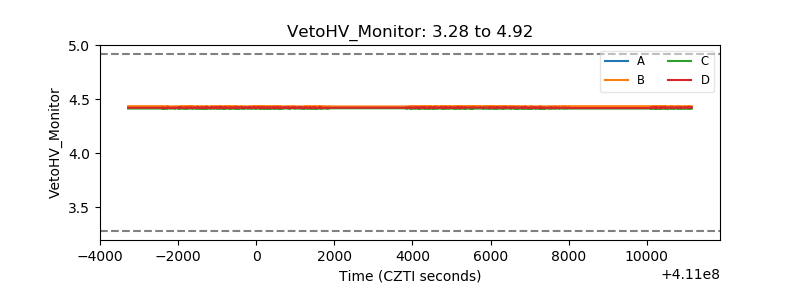 |
| Veto LLD | 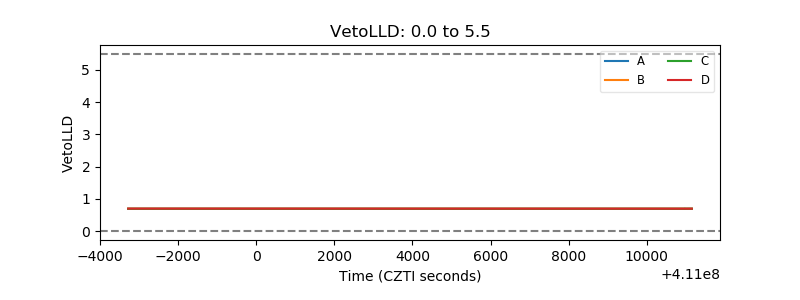 |
| Alpha Counter | 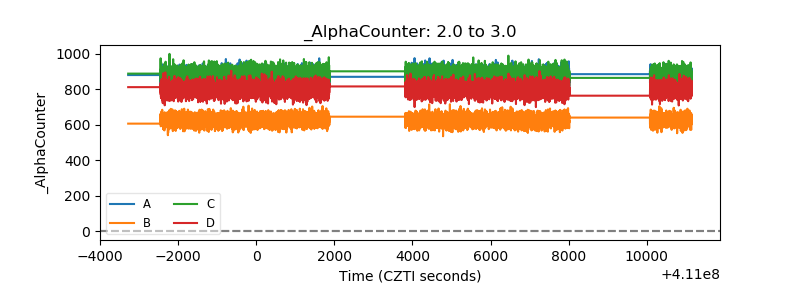 |
| _CPM_Rate | 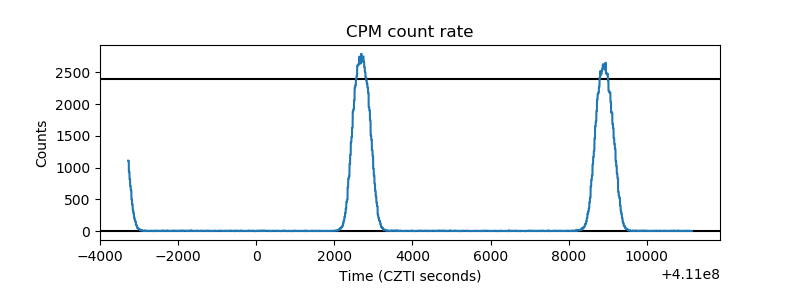 |
| CZT Counter | 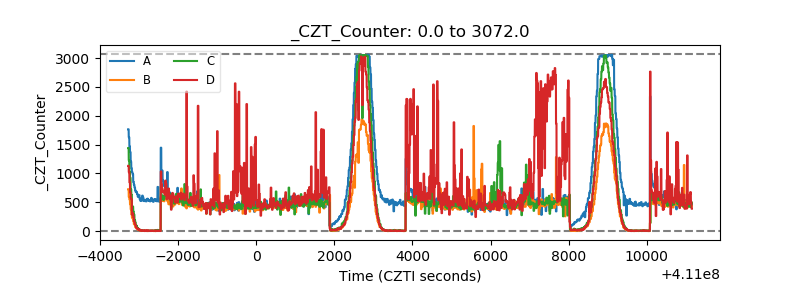 |
| +2.5 Volts monitor | 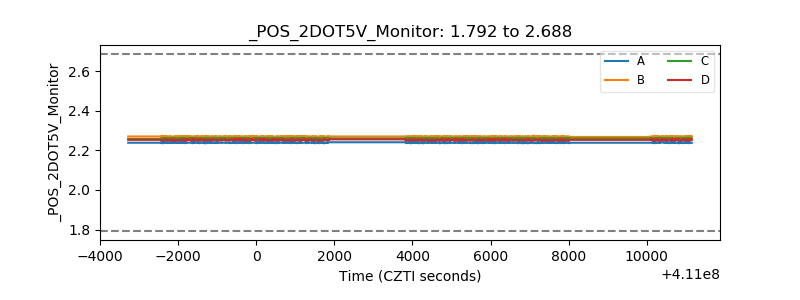 |
| +5 Volts monitor | 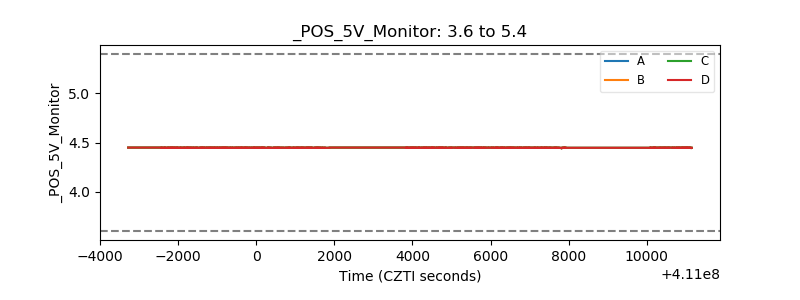 |
| _ROLL_ROT | 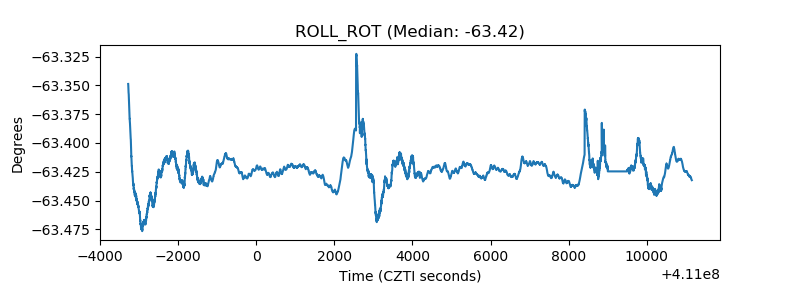 |
| _Roll_DEC | 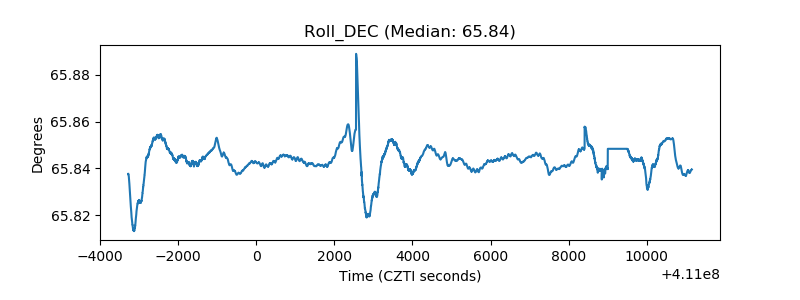 |
| _Roll_RA | 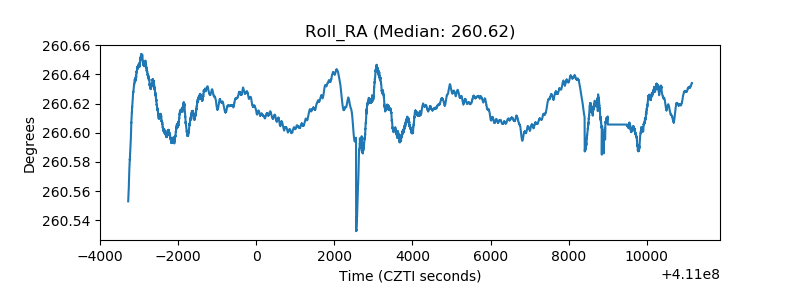 |
| Veto Counter | 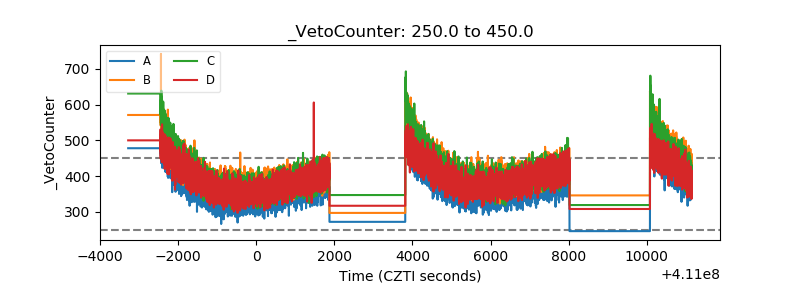 |