| Param | Original file | Final file |
|---|---|---|
| Filename | modeM0/AS1A12_018T01_9000005470_39389cztM0_level2.fits | modeM0/AS1A12_018T01_9000005470_39389cztM0_level2_quad_clean.evt |
| Size (bytes) | 324,751,680 | 89,176,320 |
| Size | 309.7 MB | 85.0 MB |
| Events in quadrant A | 2,677,089 | 610,951 |
| Events in quadrant B | 2,345,357 | 634,266 |
| Events in quadrant C | 2,685,320 | 582,275 |
| Events in quadrant D | 3,928,303 | 525,742 |
| Mode M9 | |||
|---|---|---|---|
| Quadrant | BADHDUFLAG | Total packets | Discarded packets |
| A | 0 | 22 | 0 |
| B | 0 | 22 | 0 |
| C | 0 | 22 | 0 |
| D | 0 | 23 | 0 |
| Mode SS | |||
|---|---|---|---|
| Quadrant | BADHDUFLAG | Total packets | Discarded packets |
| A | 0 | 102 | 0 |
| B | 0 | 102 | 0 |
| C | 0 | 102 | 0 |
| D | 0 | 102 | 0 |
| Mode M0 | |||
|---|---|---|---|
| Quadrant | BADHDUFLAG | Total packets | Discarded packets |
| A | 0 | 10981 | 3 |
| B | 0 | 10320 | 2 |
| C | 0 | 11022 | 2 |
| D | 0 | 15101 | 2 |
| Quadrant | Total seconds | Saturated seconds | Saturation percentage |
|---|---|---|---|
| A | 4947 | 11 | 0.222357% |
| B | 4947 | 17 | 0.343643% |
| C | 4947 | 67 | 1.354356% |
| D | 4947 | 187 | 3.780069% |
Noise dominated data is calculated using 1-second bins in cleaned event files. If a bin has >2000 counts, and if more than 50% of those come from <1% of pixels, then it is considered to be noise-dominated and hence unusable.
| Quadrant | # 1 sec bins | Bins with >0 counts | Bins with >2000 counts | High rate bins dominated by noise | Noise dominated (total time) | Noise dominated (detector-on time) | Marked lightcurve |
|---|---|---|---|---|---|---|---|
| A | 7069 | 4948 | 5 | 5 | 0.07% | 0.10% | 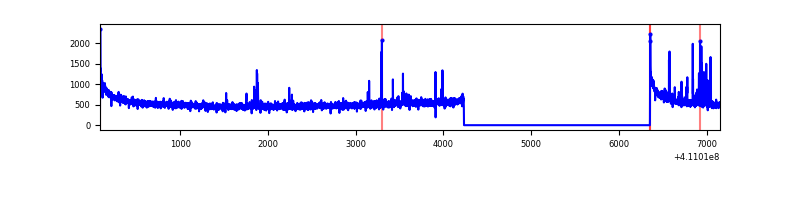 |
| B | 7069 | 4948 | 8 | 8 | 0.11% | 0.16% | 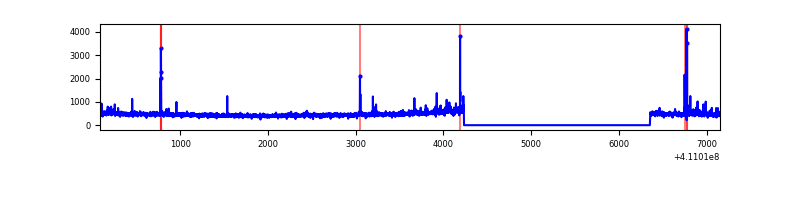 |
| C | 7069 | 4948 | 39 | 39 | 0.55% | 0.79% | 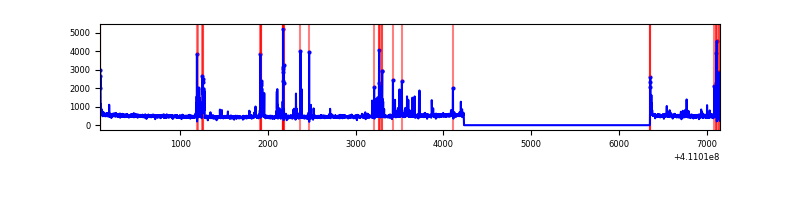 |
| D | 7069 | 4947 | 175 | 175 | 2.48% | 3.54% | 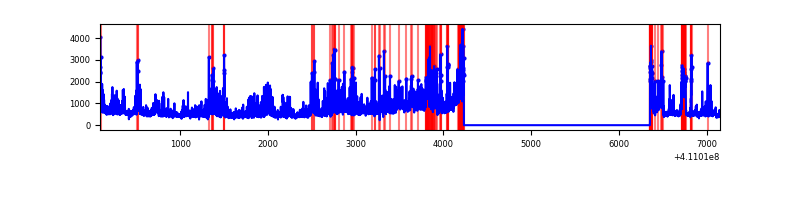 |
Top three noisy pixels from each quadrant. If the there are fewer than three noisy pixels in the level2.evt file, extra rows are filled as -1
| Pixel properties | Quadrant properties | ||||||
|---|---|---|---|---|---|---|---|
| Quadrant | DetID | PixID | Counts | Sigma | Mean | Median | Sigma |
| A | 10 | 83 | 404905 | 3557.39 | 563 | 552 | 113.7 |
| A | 2 | 79 | 84590 | 739.34 | 563 | 552 | 113.7 |
| A | 13 | 254 | 7468 | 60.84 | 563 | 552 | 113.7 |
| B | 5 | 172 | 81782 | 756.88 | 564 | 551 | 107.3 |
| B | 6 | 203 | 34793 | 319.06 | 564 | 551 | 107.3 |
| B | 12 | 111 | 12960 | 115.62 | 564 | 551 | 107.3 |
| C | 14 | 254 | 298356 | 2400.49 | 538 | 543 | 124.1 |
| C | 15 | 214 | 223974 | 1800.94 | 538 | 543 | 124.1 |
| C | 0 | 10 | 25207 | 198.8 | 538 | 543 | 124.1 |
| D | 12 | 235 | 1293407 | 10025.42 | 528 | 513 | 129.0 |
| D | 7 | 38 | 350229 | 2711.79 | 528 | 513 | 129.0 |
| D | 13 | 249 | 125975 | 972.86 | 528 | 513 | 129.0 |
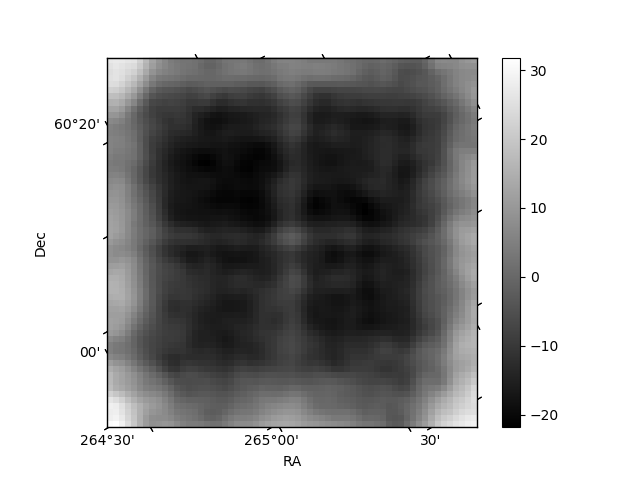
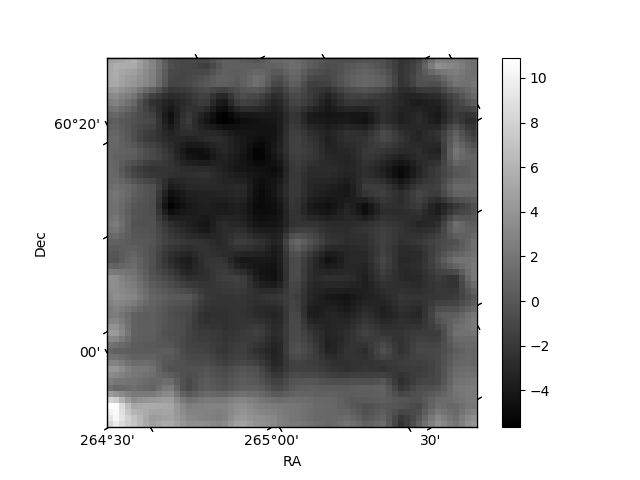
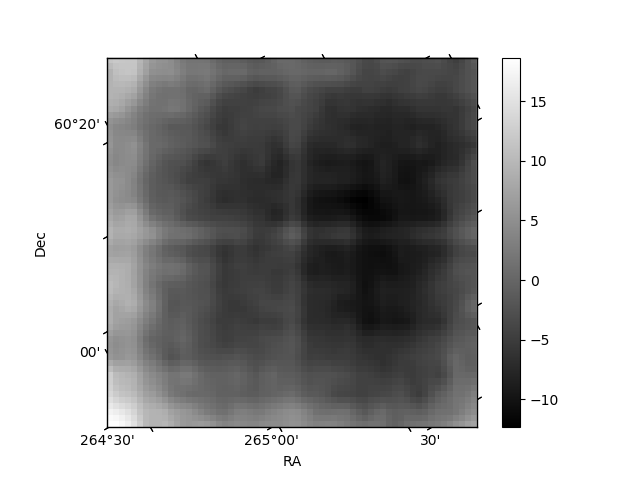
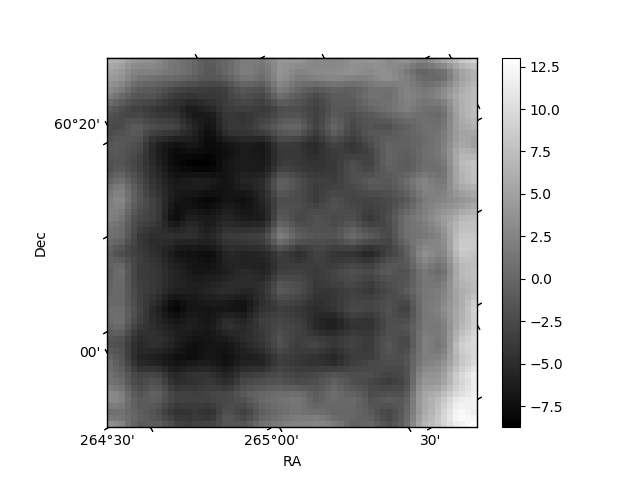
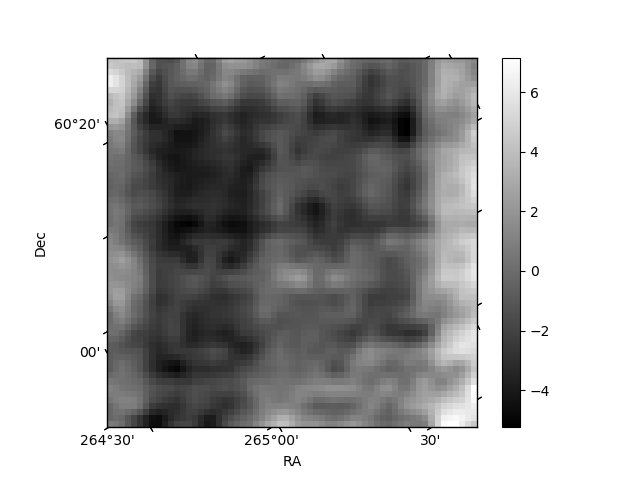
Histogram calculated using DETX and DETY for each event in the final _common_clean file
| Quadrant A | 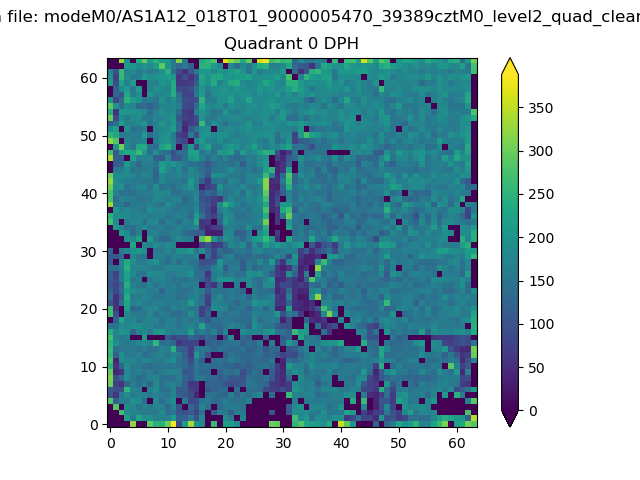 |
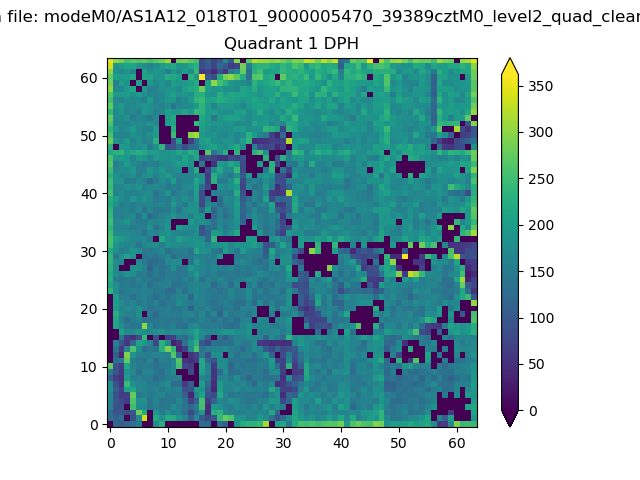 |
Quadrant B |
|---|---|---|---|
| Quadrant D | 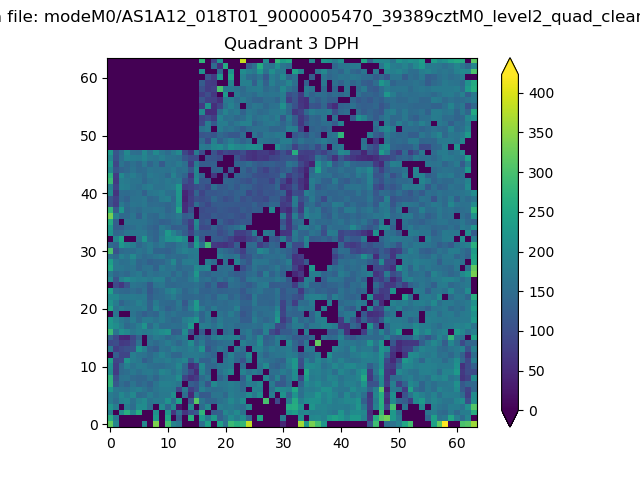 |
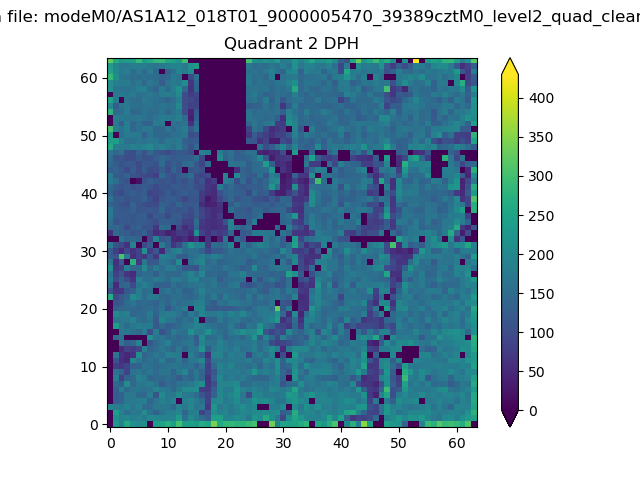 |
Quadrant C |
| Plot type | Count rate plots | Images |
|---|---|---|
| Comparison with Poisson distribution Blue bars denote a histogram of data divided into 1 sec bins. Red curve is a Poisson curve with rate = median count rate of data. |
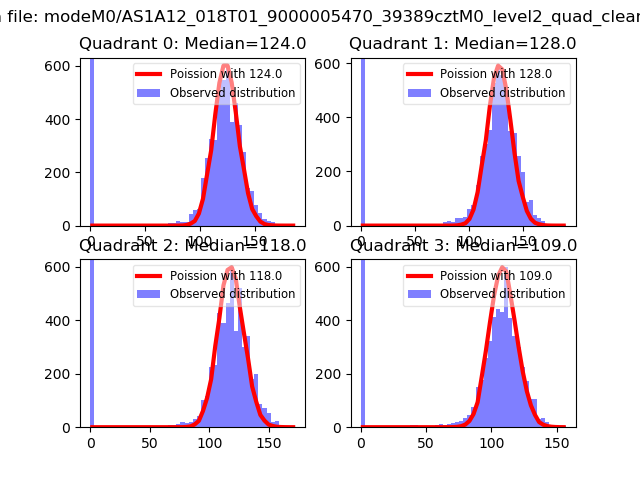 |
 |
| Quadrant-wise count rates Data is divided into 100 sec bins |
 |
|
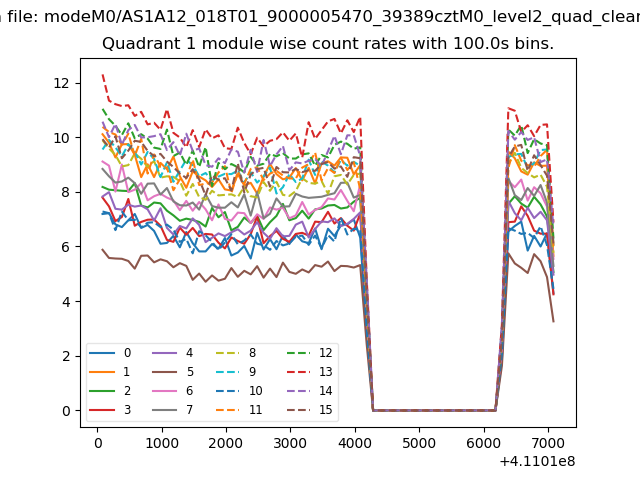
| Module-wise count rates for Quadrant A Data is divided into 100 sec bins |
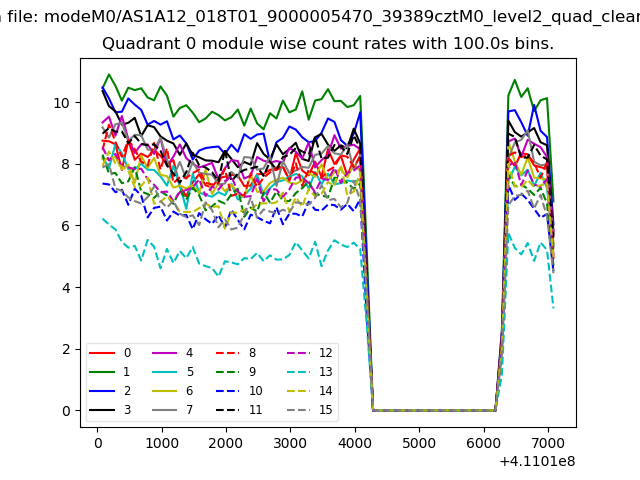 |
 |
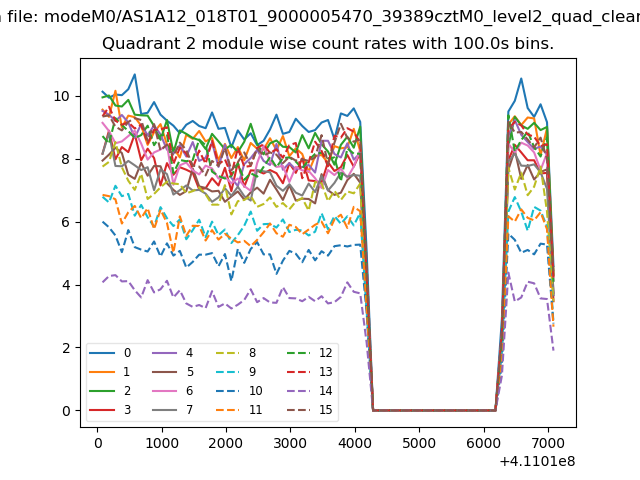
| Module-wise count rates for Quadrant B Data is divided into 100 sec bins |
 |
 |
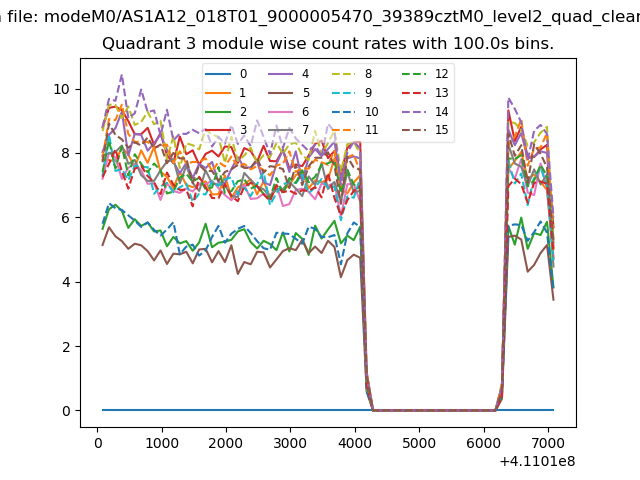
| Module-wise count rates for Quadrant C Data is divided into 100 sec bins |
 |
 |
| Module-wise count rates for Quadrant D Data is divided into 100 sec bins |
 |
 |
| Parameter | Plot |
|---|---|
| CZT HV Monitor | 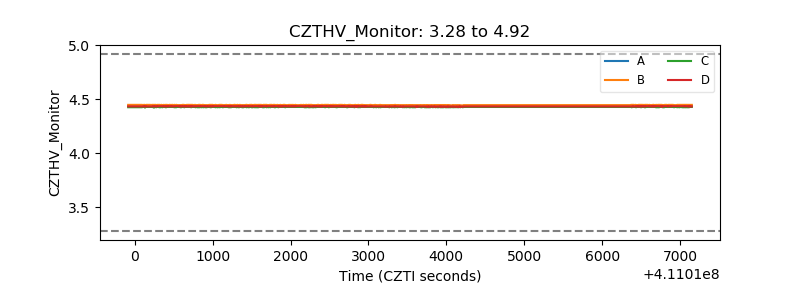 |
| D_VDD | 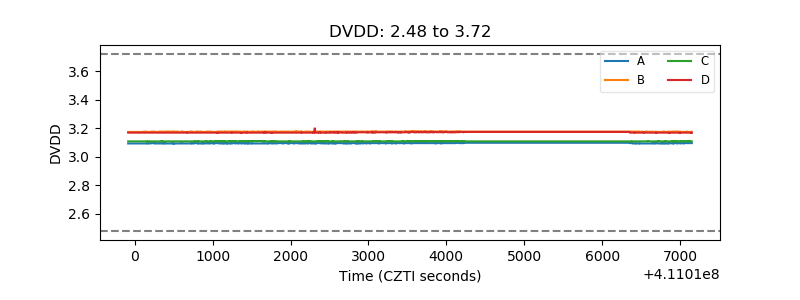 |
| Temperature 1 | 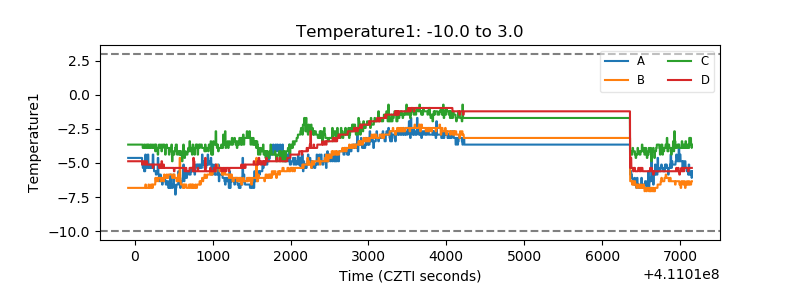 |
| Veto HV Monitor | 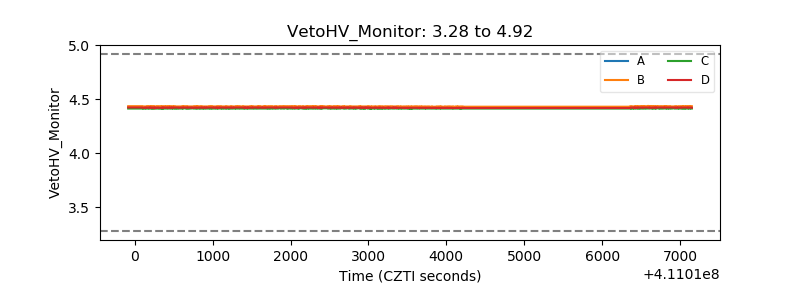 |
| Veto LLD | 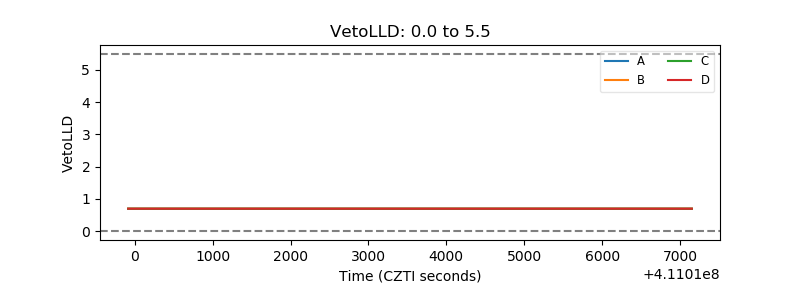 |
| Alpha Counter | 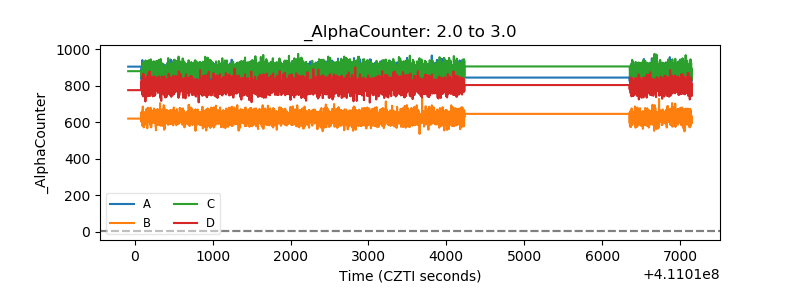 |
| _CPM_Rate | 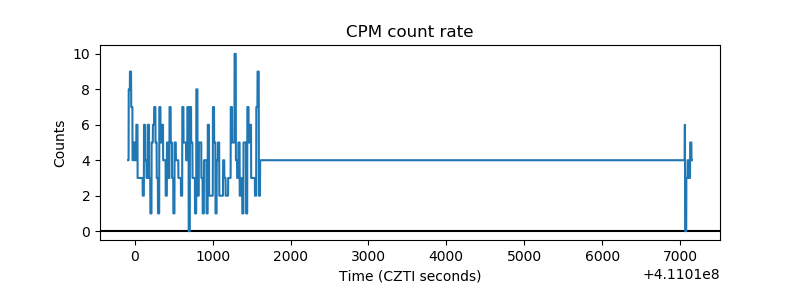 |
| CZT Counter | 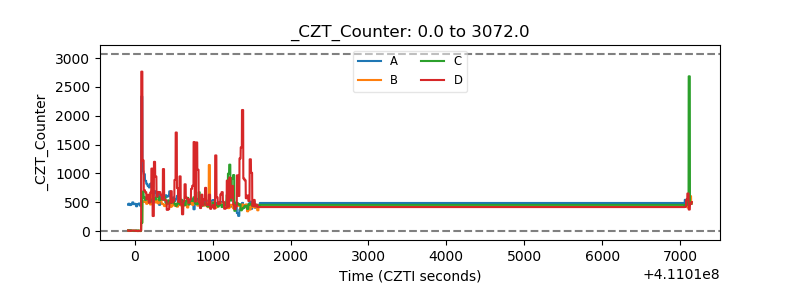 |
| +2.5 Volts monitor | 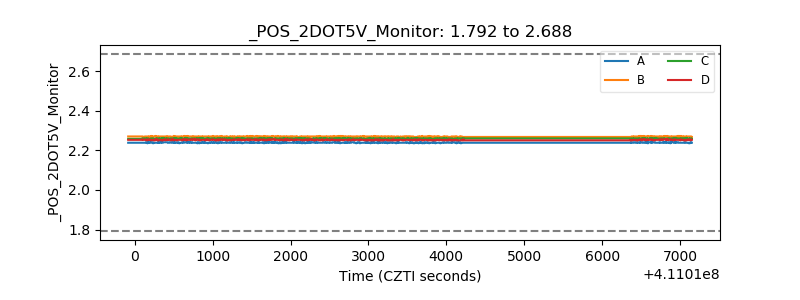 |
| +5 Volts monitor | 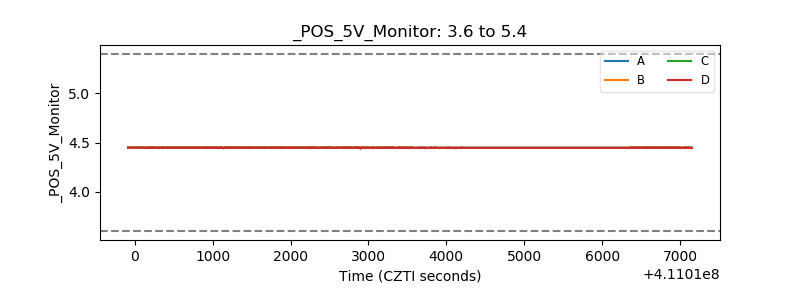 |
| _ROLL_ROT | 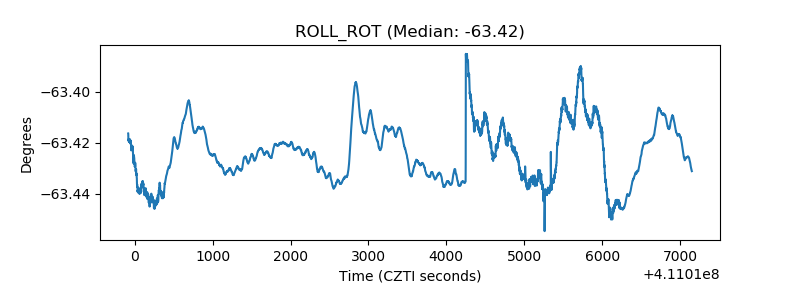 |
| _Roll_DEC | 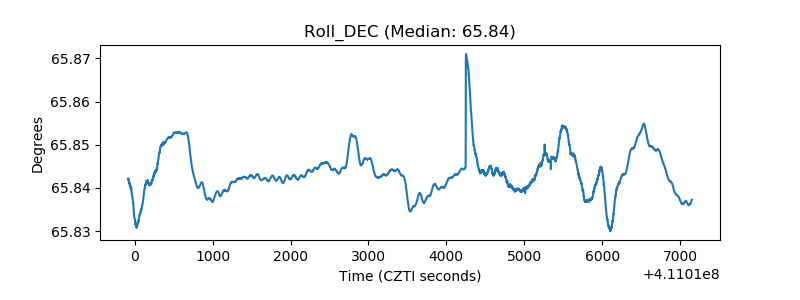 |
| _Roll_RA | 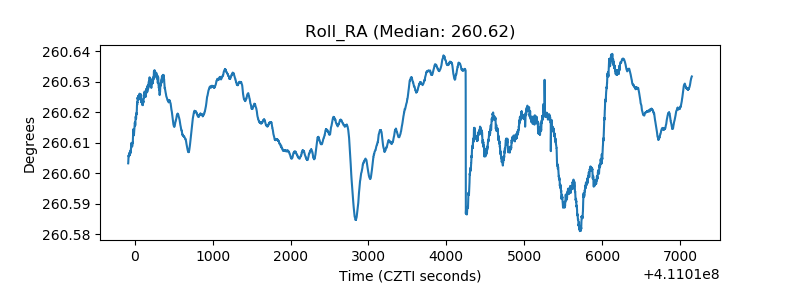 |
| Veto Counter | 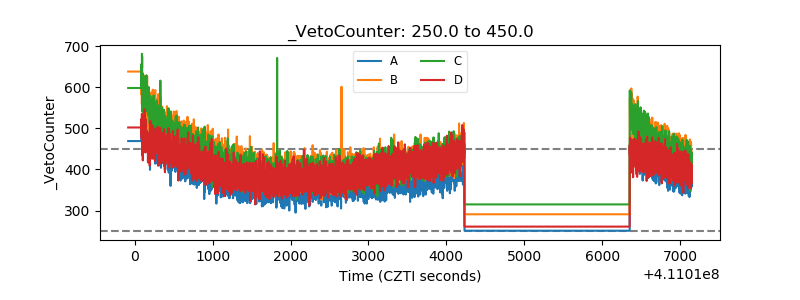 |