| Param | Original file | Final file |
|---|---|---|
| Filename | modeM0/AS1A12_018T01_9000005470_39391cztM0_level2.fits | modeM0/AS1A12_018T01_9000005470_39391cztM0_level2_quad_clean.evt |
| Size (bytes) | 952,096,320 | 230,869,440 |
| Size | 908.0 MB | 220.2 MB |
| Events in quadrant A | 6,977,121 | 1,595,055 |
| Events in quadrant B | 6,348,957 | 1,651,328 |
| Events in quadrant C | 7,640,149 | 1,506,719 |
| Events in quadrant D | 13,235,468 | 1,307,353 |
| Mode M9 | |||
|---|---|---|---|
| Quadrant | BADHDUFLAG | Total packets | Discarded packets |
| A | 0 | 64 | 0 |
| B | 0 | 64 | 0 |
| C | 0 | 64 | 0 |
| D | 0 | 65 | 0 |
| Mode SS | |||
|---|---|---|---|
| Quadrant | BADHDUFLAG | Total packets | Discarded packets |
| A | 0 | 276 | 0 |
| B | 0 | 276 | 0 |
| C | 0 | 276 | 0 |
| D | 0 | 276 | 0 |
| Mode M0 | |||
|---|---|---|---|
| Quadrant | BADHDUFLAG | Total packets | Discarded packets |
| A | 0 | 28852 | 5 |
| B | 0 | 28193 | 4 |
| C | 0 | 31388 | 4 |
| D | 0 | 48766 | 4 |
| Quadrant | Total seconds | Saturated seconds | Saturation percentage |
|---|---|---|---|
| A | 13463 | 30 | 0.222833% |
| B | 13463 | 58 | 0.430810% |
| C | 13463 | 168 | 1.247865% |
| D | 13463 | 1394 | 10.354304% |
Noise dominated data is calculated using 1-second bins in cleaned event files. If a bin has >2000 counts, and if more than 50% of those come from <1% of pixels, then it is considered to be noise-dominated and hence unusable.
| Quadrant | # 1 sec bins | Bins with >0 counts | Bins with >2000 counts | High rate bins dominated by noise | Noise dominated (total time) | Noise dominated (detector-on time) | Marked lightcurve |
|---|---|---|---|---|---|---|---|
| A | 19739 | 13466 | 16 | 16 | 0.08% | 0.12% | 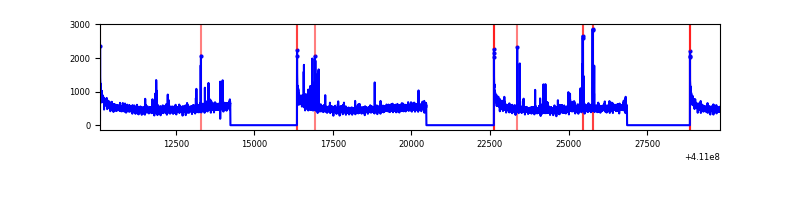 |
| B | 19739 | 13466 | 28 | 28 | 0.14% | 0.21% | 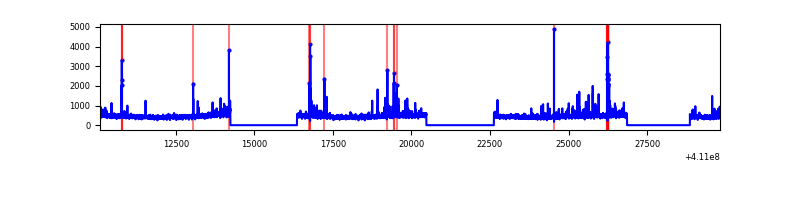 |
| C | 19739 | 13466 | 133 | 133 | 0.67% | 0.99% | 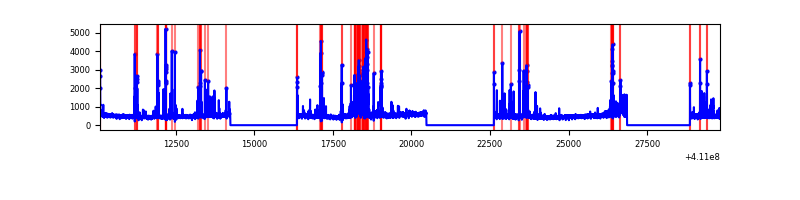 |
| D | 19739 | 13465 | 1226 | 1226 | 6.21% | 9.11% | 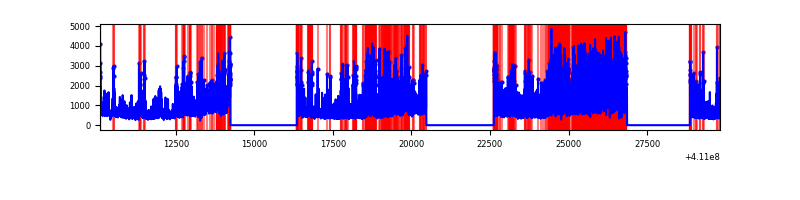 |
Top three noisy pixels from each quadrant. If the there are fewer than three noisy pixels in the level2.evt file, extra rows are filled as -1
| Pixel properties | Quadrant properties | ||||||
|---|---|---|---|---|---|---|---|
| Quadrant | DetID | PixID | Counts | Sigma | Mean | Median | Sigma |
| A | 10 | 83 | 982982 | 3283.63 | 1505 | 1476 | 298.9 |
| A | 2 | 79 | 150083 | 497.16 | 1505 | 1476 | 298.9 |
| A | 13 | 254 | 21218 | 66.05 | 1505 | 1476 | 298.9 |
| B | 5 | 172 | 225421 | 791.43 | 1497 | 1459 | 283.0 |
| B | 5 | 255 | 145361 | 508.52 | 1497 | 1459 | 283.0 |
| B | 5 | 200 | 46959 | 160.79 | 1497 | 1459 | 283.0 |
| C | 9 | 187 | 780498 | 2389.64 | 1435 | 1443 | 326.0 |
| C | 15 | 214 | 603102 | 1845.5 | 1435 | 1443 | 326.0 |
| C | 14 | 254 | 417488 | 1276.16 | 1435 | 1443 | 326.0 |
| D | 12 | 235 | 6261644 | 18741.32 | 1385 | 1345 | 334.0 |
| D | 7 | 38 | 651875 | 1947.48 | 1385 | 1345 | 334.0 |
| D | 2 | 249 | 499576 | 1491.54 | 1385 | 1345 | 334.0 |
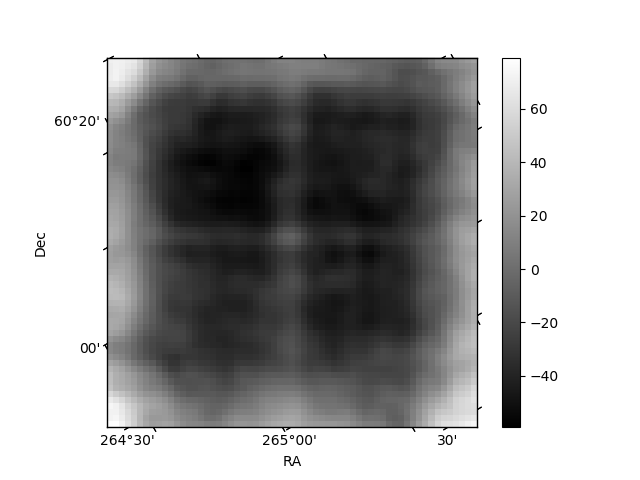
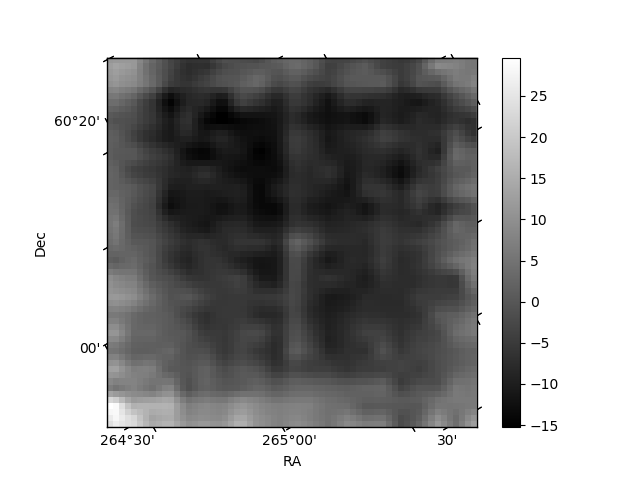
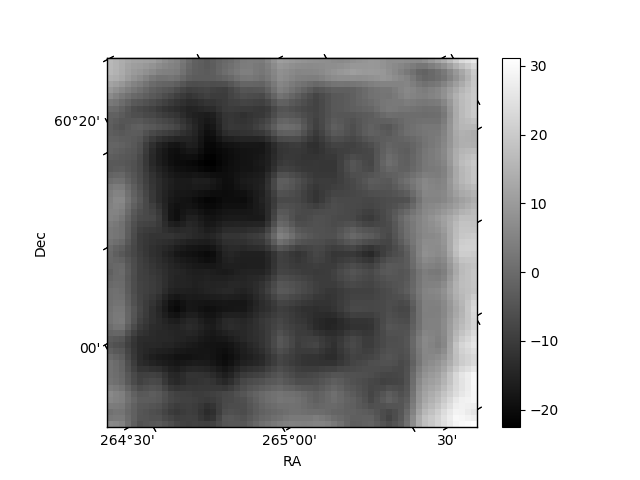
Histogram calculated using DETX and DETY for each event in the final _common_clean file
| Quadrant A | 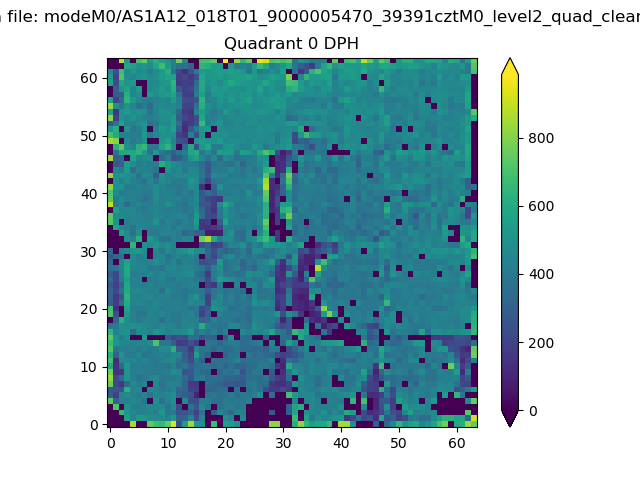 |
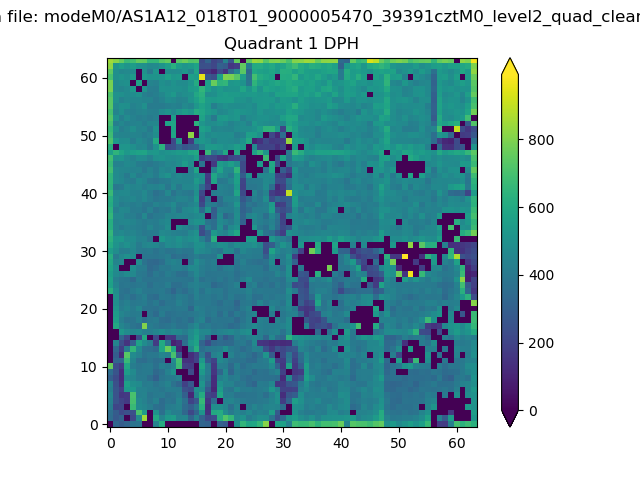 |
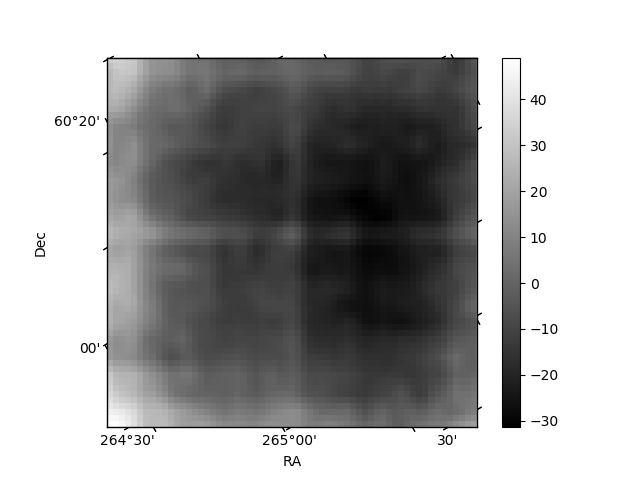
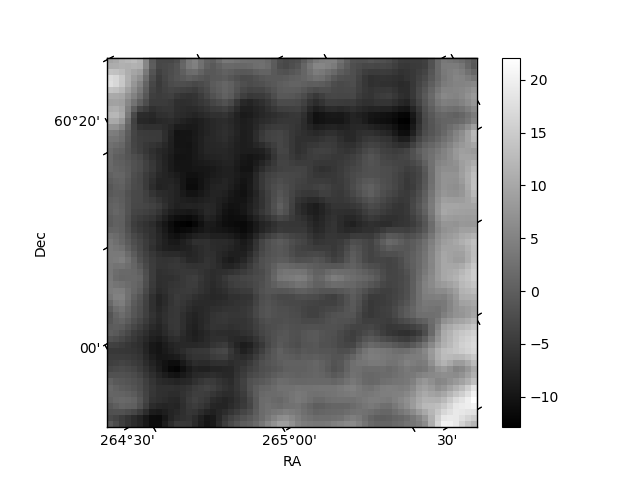
Quadrant B |
|---|---|---|---|
| Quadrant D | 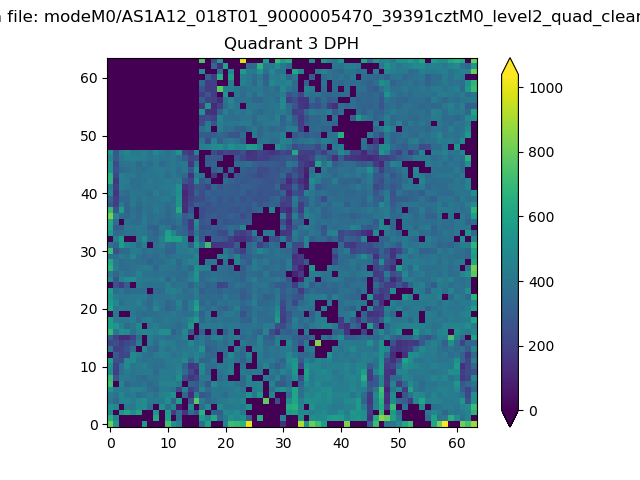 |
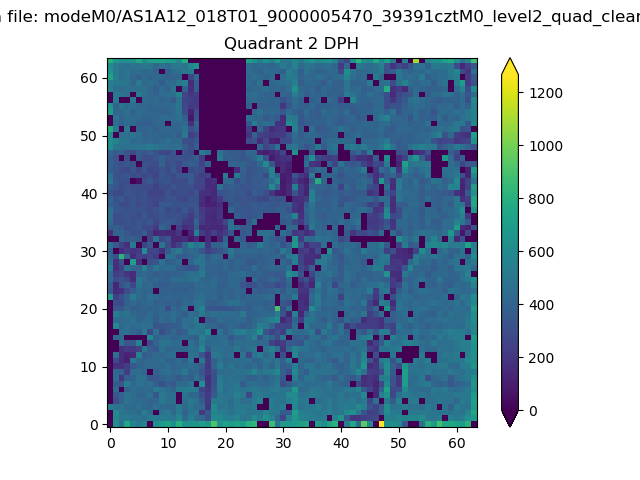 |
Quadrant C |
| Plot type | Count rate plots | Images |
|---|---|---|
| Comparison with Poisson distribution Blue bars denote a histogram of data divided into 1 sec bins. Red curve is a Poisson curve with rate = median count rate of data. |
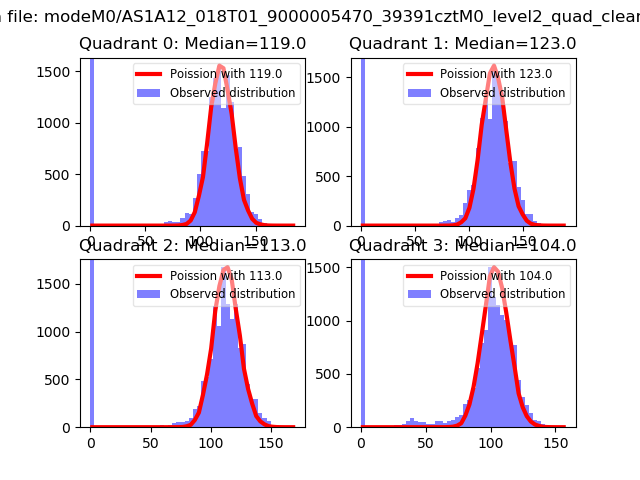 |
 |
| Quadrant-wise count rates Data is divided into 100 sec bins |
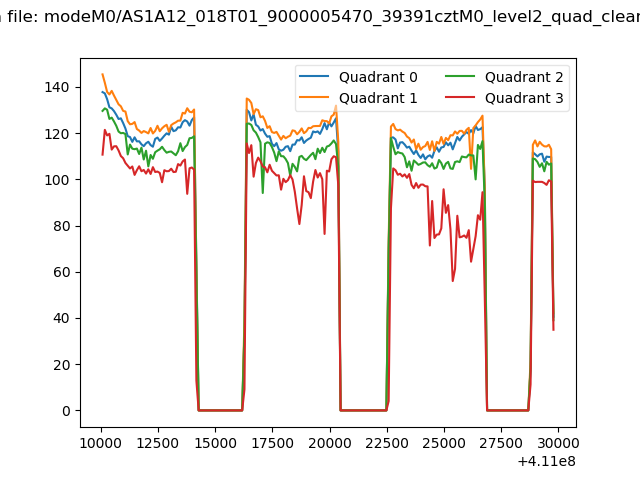 |
|
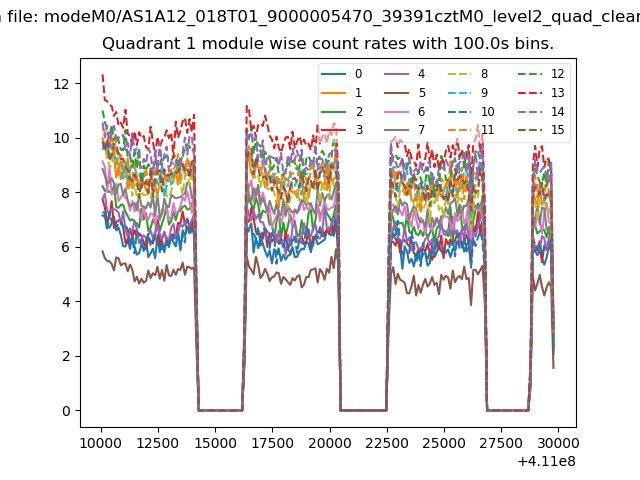
| Module-wise count rates for Quadrant A Data is divided into 100 sec bins |
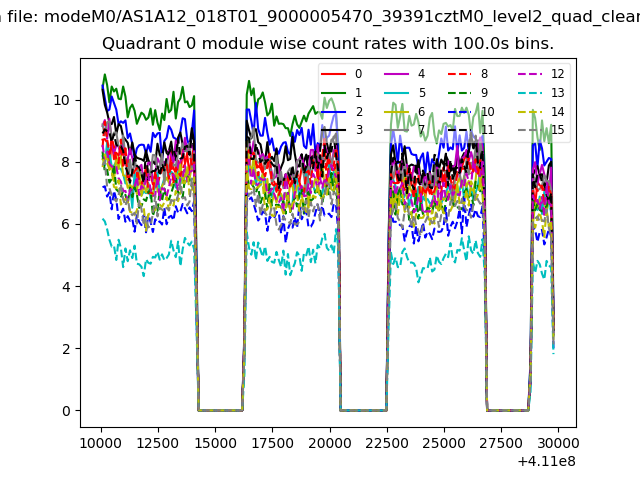 |
 |
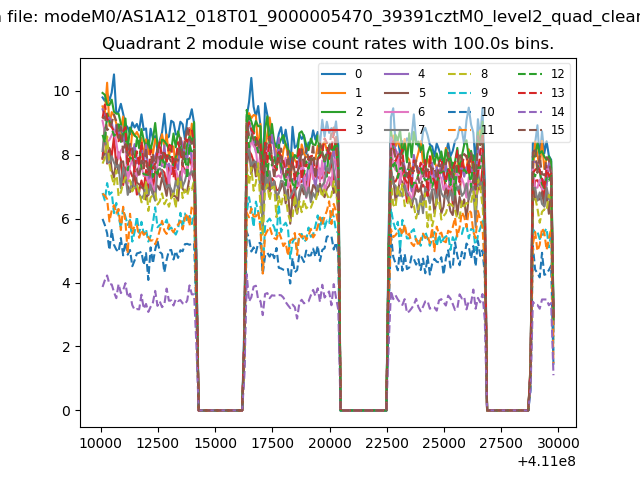
| Module-wise count rates for Quadrant B Data is divided into 100 sec bins |
 |
 |
| Module-wise count rates for Quadrant C Data is divided into 100 sec bins |
 |
 |
| Module-wise count rates for Quadrant D Data is divided into 100 sec bins |
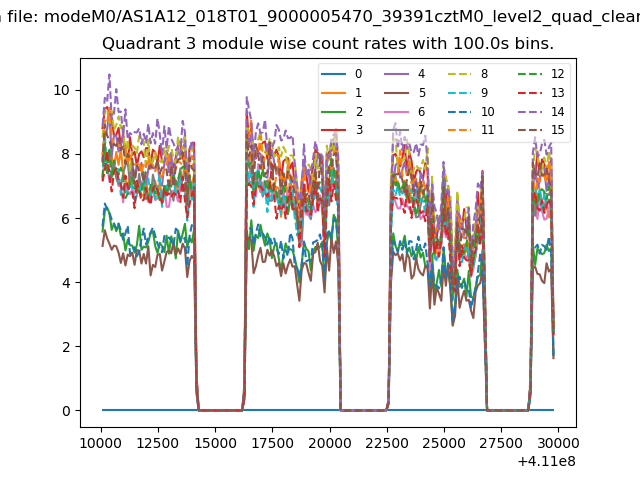 |
 |
| Parameter | Plot |
|---|---|
| CZT HV Monitor | 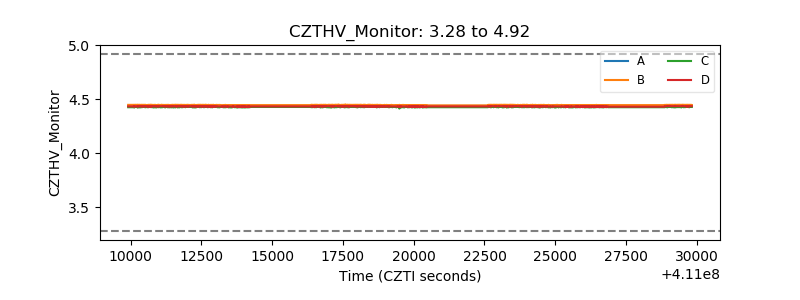 |
| D_VDD | 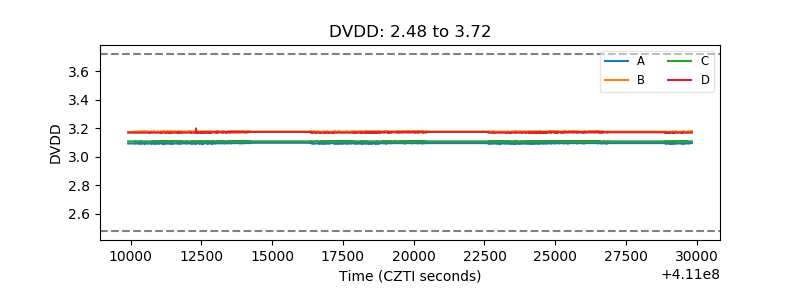 |
| Temperature 1 | 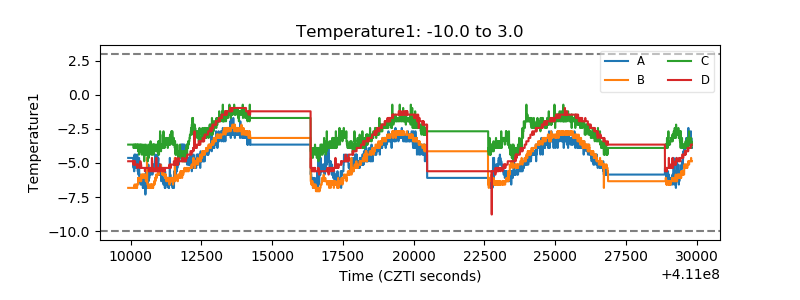 |
| Veto HV Monitor | 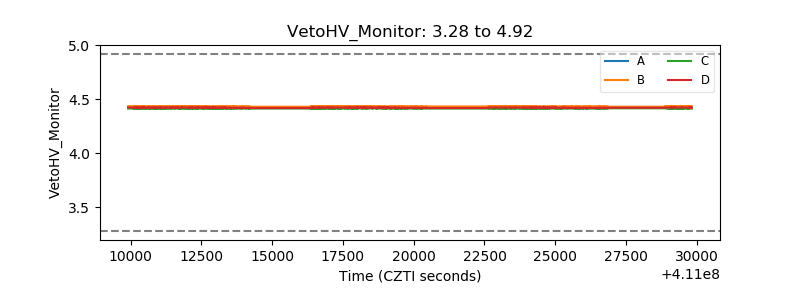 |
| Veto LLD | 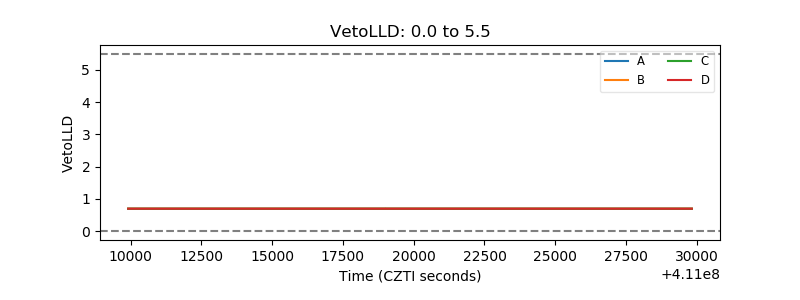 |
| Alpha Counter | 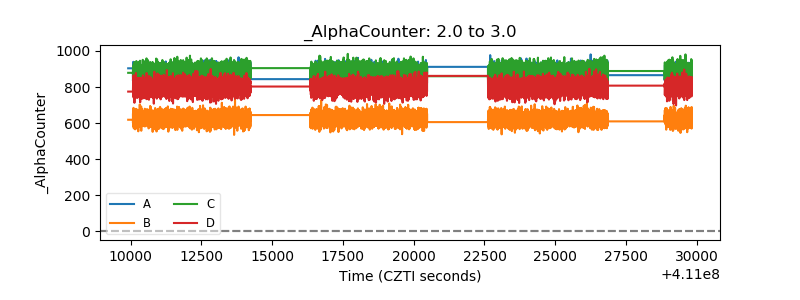 |
| _CPM_Rate | 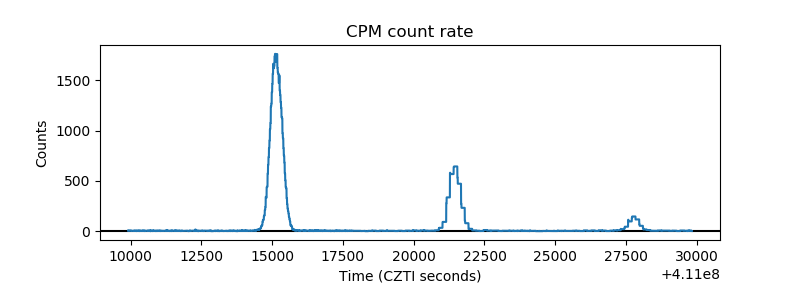 |
| CZT Counter | 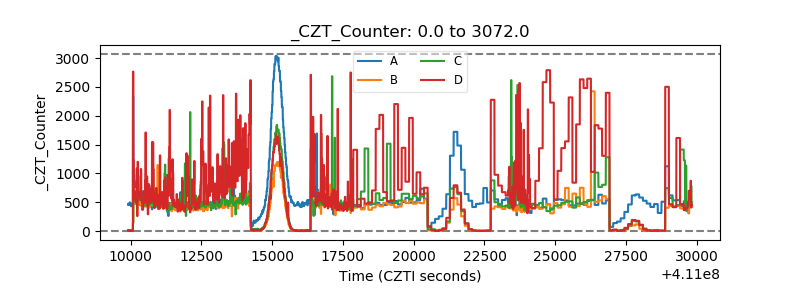 |
| +2.5 Volts monitor |  |
| +5 Volts monitor | 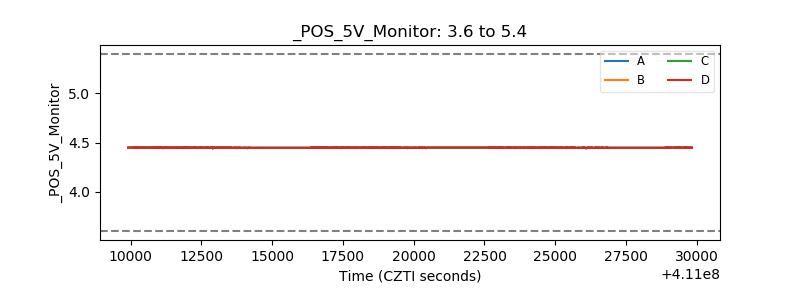 |
| _ROLL_ROT | 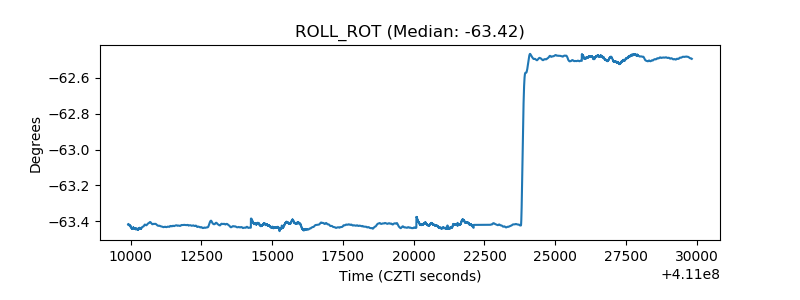 |
| _Roll_DEC | 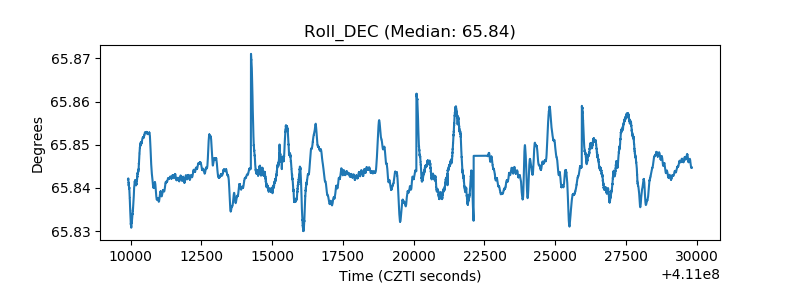 |
| _Roll_RA | 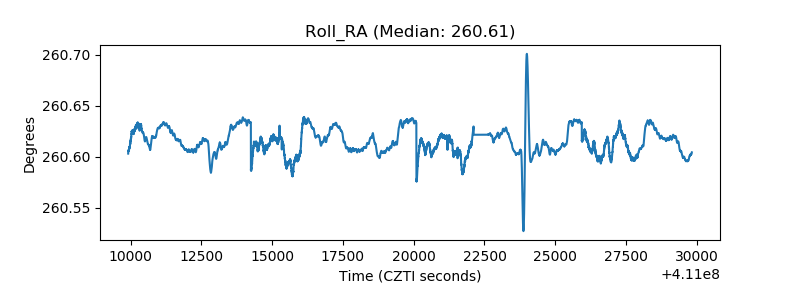 |
| Veto Counter | 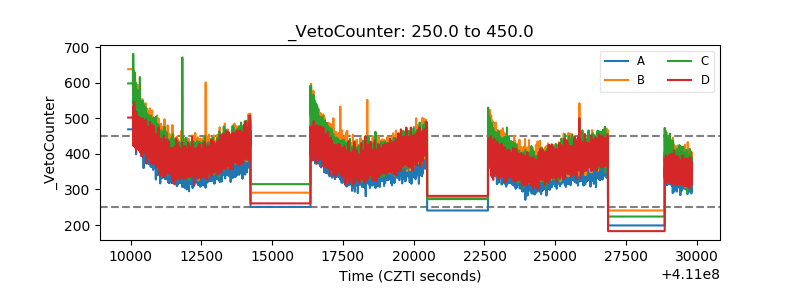 |