| Param | Original file | Final file |
|---|---|---|
| Filename | modeM0/AS1A12_018T01_9000005470_39392cztM0_level2.fits | modeM0/AS1A12_018T01_9000005470_39392cztM0_level2_quad_clean.evt |
| Size (bytes) | 424,068,480 | 87,180,480 |
| Size | 404.4 MB | 83.1 MB |
| Events in quadrant A | 2,732,340 | 597,848 |
| Events in quadrant B | 2,353,952 | 616,116 |
| Events in quadrant C | 3,946,095 | 565,186 |
| Events in quadrant D | 6,250,548 | 486,666 |
| Mode M9 | |||
|---|---|---|---|
| Quadrant | BADHDUFLAG | Total packets | Discarded packets |
| A | 0 | 18 | 0 |
| B | 0 | 18 | 0 |
| C | 0 | 18 | 0 |
| D | 0 | 18 | 0 |
| Mode SS | |||
|---|---|---|---|
| Quadrant | BADHDUFLAG | Total packets | Discarded packets |
| A | 0 | 108 | 0 |
| B | 0 | 108 | 0 |
| C | 0 | 108 | 0 |
| D | 0 | 108 | 0 |
| Mode M0 | |||
|---|---|---|---|
| Quadrant | BADHDUFLAG | Total packets | Discarded packets |
| A | 0 | 11324 | 3 |
| B | 0 | 10862 | 2 |
| C | 0 | 15332 | 2 |
| D | 0 | 22327 | 2 |
| Quadrant | Total seconds | Saturated seconds | Saturation percentage |
|---|---|---|---|
| A | 5340 | 5 | 0.093633% |
| B | 5340 | 4 | 0.074906% |
| C | 5340 | 89 | 1.666667% |
| D | 5340 | 732 | 13.707865% |
Noise dominated data is calculated using 1-second bins in cleaned event files. If a bin has >2000 counts, and if more than 50% of those come from <1% of pixels, then it is considered to be noise-dominated and hence unusable.
| Quadrant | # 1 sec bins | Bins with >0 counts | Bins with >2000 counts | High rate bins dominated by noise | Noise dominated (total time) | Noise dominated (detector-on time) | Marked lightcurve |
|---|---|---|---|---|---|---|---|
| A | 7073 | 5341 | 4 | 4 | 0.06% | 0.07% | 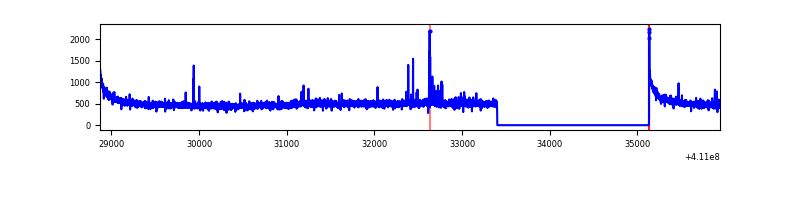 |
| B | 7073 | 5341 | 0 | 0 | 0.00% | 0.00% | 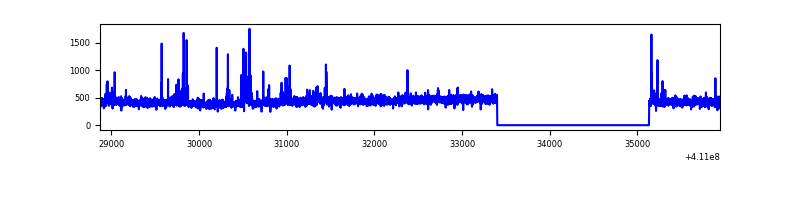 |
| C | 7073 | 5341 | 104 | 104 | 1.47% | 1.95% | 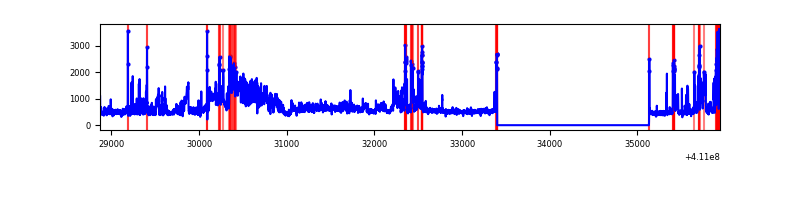 |
| D | 7073 | 5341 | 679 | 679 | 9.60% | 12.71% | 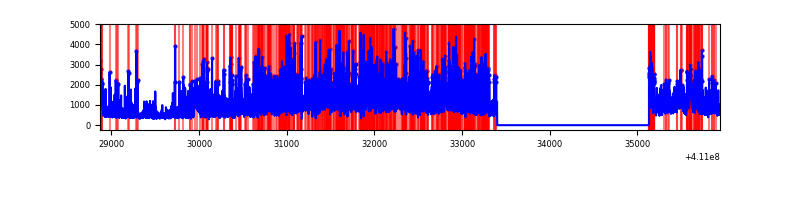 |
Top three noisy pixels from each quadrant. If the there are fewer than three noisy pixels in the level2.evt file, extra rows are filled as -1
| Pixel properties | Quadrant properties | ||||||
|---|---|---|---|---|---|---|---|
| Quadrant | DetID | PixID | Counts | Sigma | Mean | Median | Sigma |
| A | 10 | 83 | 429696 | 3648.57 | 581 | 569 | 117.6 |
| A | 13 | 248 | 34422 | 287.83 | 581 | 569 | 117.6 |
| A | 13 | 254 | 8636 | 68.59 | 581 | 569 | 117.6 |
| B | 5 | 172 | 83696 | 742.83 | 576 | 560 | 111.9 |
| B | 12 | 111 | 13777 | 118.1 | 576 | 560 | 111.9 |
| B | 11 | 111 | 12951 | 110.71 | 576 | 560 | 111.9 |
| C | 9 | 187 | 1357715 | 10464.0 | 556 | 559 | 129.7 |
| C | 15 | 214 | 243155 | 1870.47 | 556 | 559 | 129.7 |
| C | 15 | 208 | 85554 | 655.33 | 556 | 559 | 129.7 |
| D | 12 | 235 | 3545506 | 26777.04 | 535 | 520 | 132.4 |
| D | 2 | 120 | 186188 | 1402.44 | 535 | 520 | 132.4 |
| D | 7 | 38 | 177499 | 1336.81 | 535 | 520 | 132.4 |
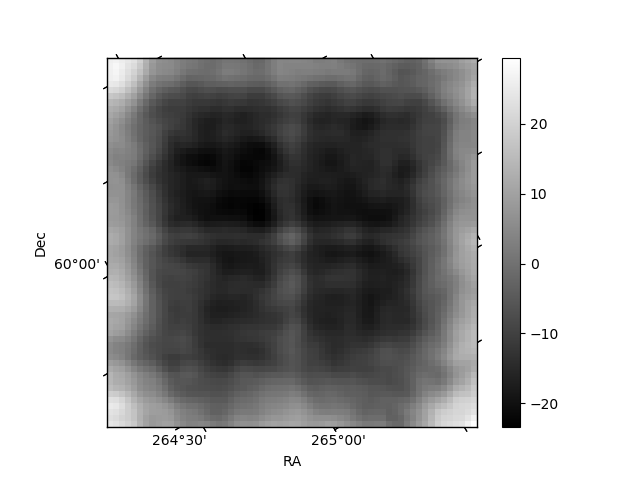
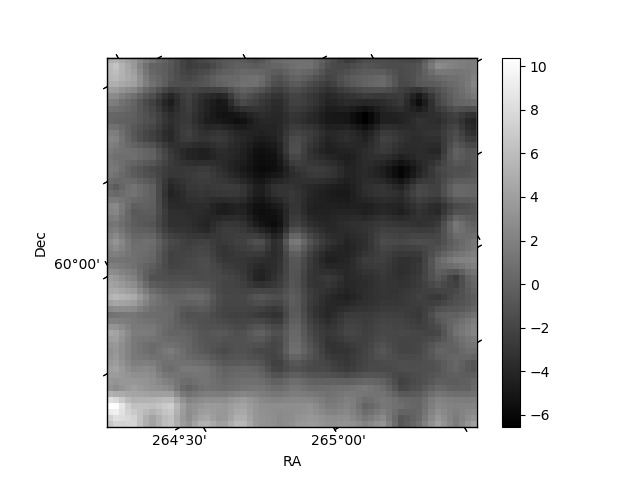
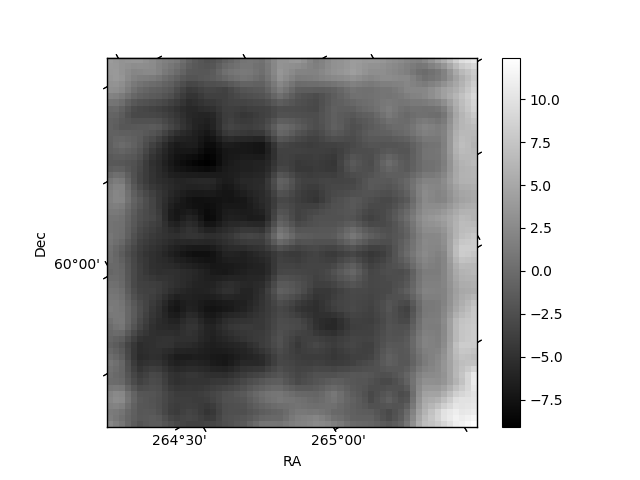
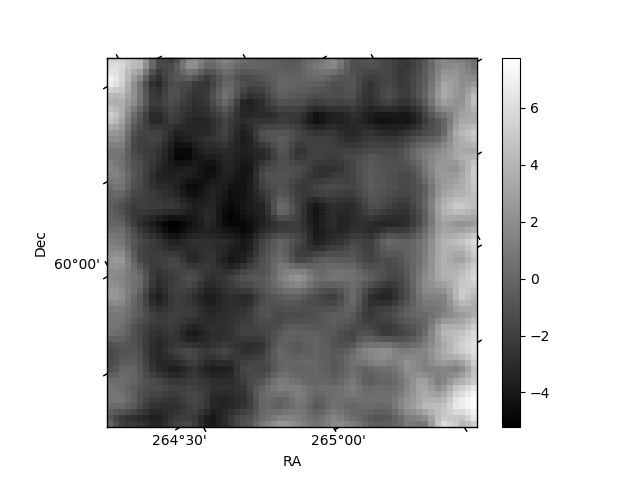
Histogram calculated using DETX and DETY for each event in the final _common_clean file
| Quadrant A | 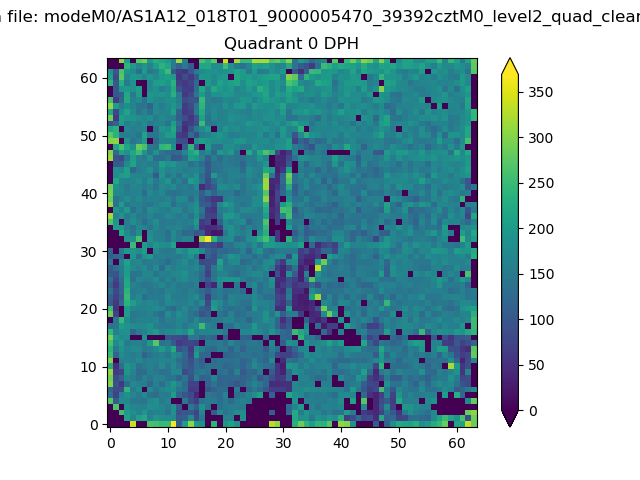 |
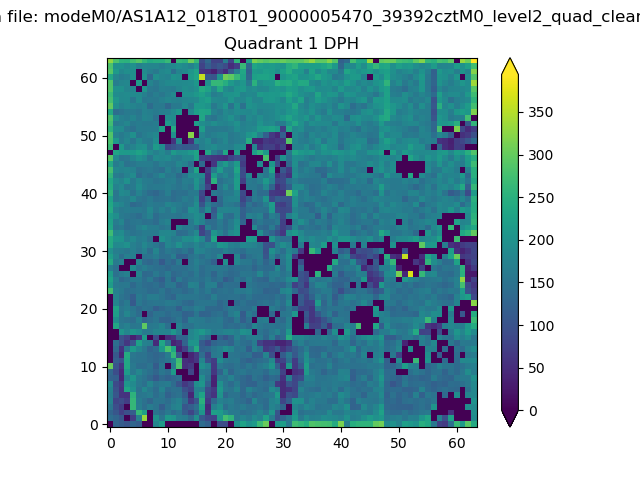 |
Quadrant B |
|---|---|---|---|
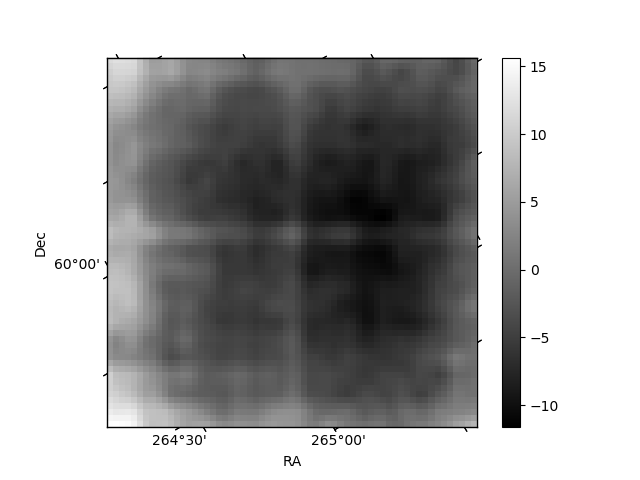
| Quadrant D | 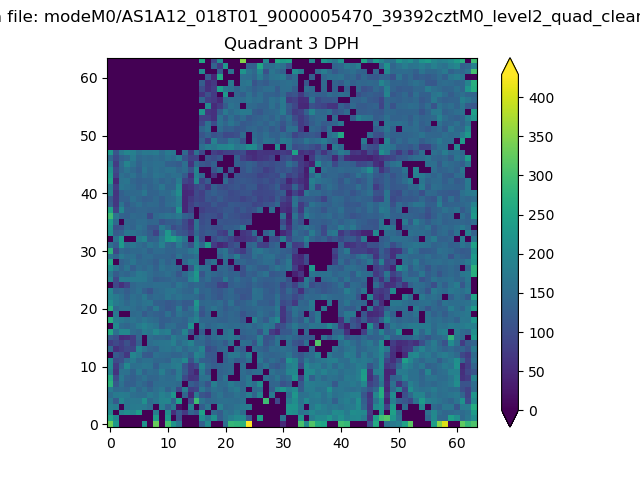 |
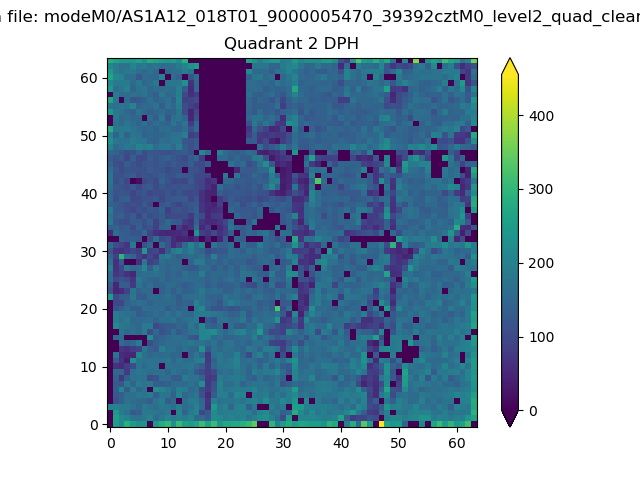 |
Quadrant C |
| Plot type | Count rate plots | Images |
|---|---|---|
| Comparison with Poisson distribution Blue bars denote a histogram of data divided into 1 sec bins. Red curve is a Poisson curve with rate = median count rate of data. |
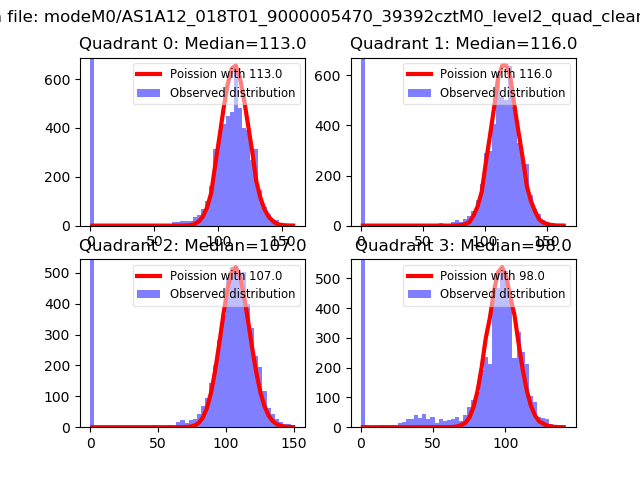 |
 |
| Quadrant-wise count rates Data is divided into 100 sec bins |
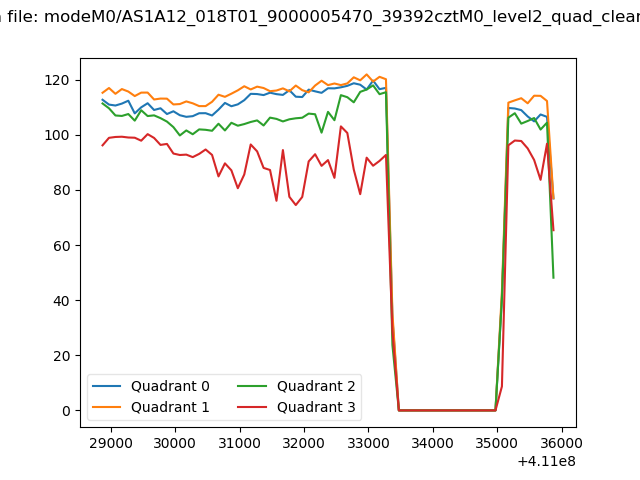 |
|
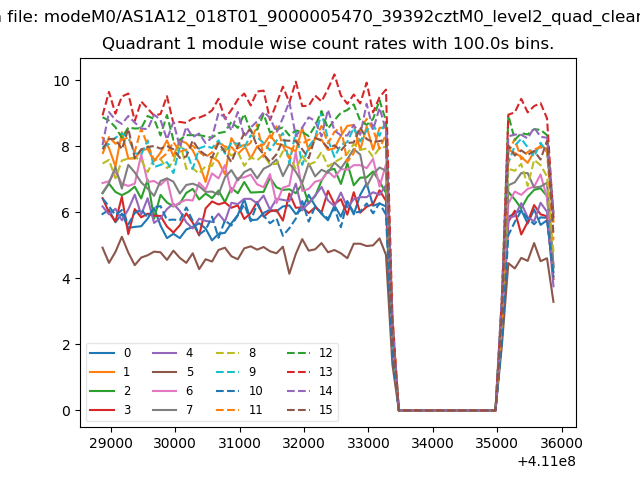
| Module-wise count rates for Quadrant A Data is divided into 100 sec bins |
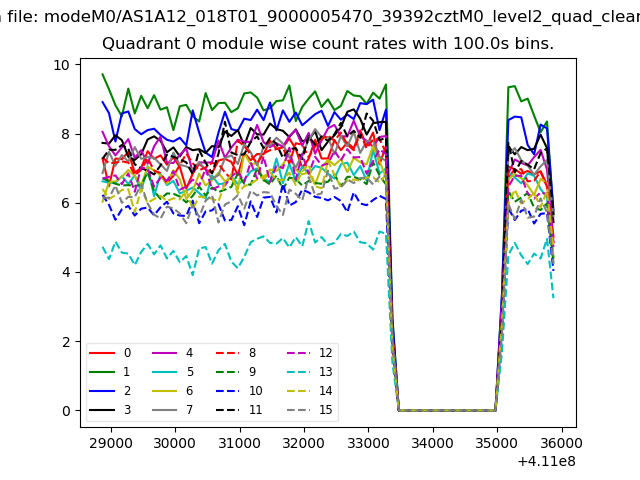 |
 |
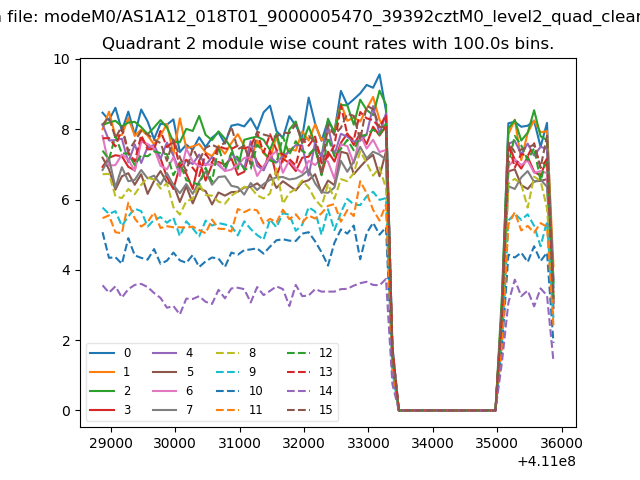
| Module-wise count rates for Quadrant B Data is divided into 100 sec bins |
 |
 |
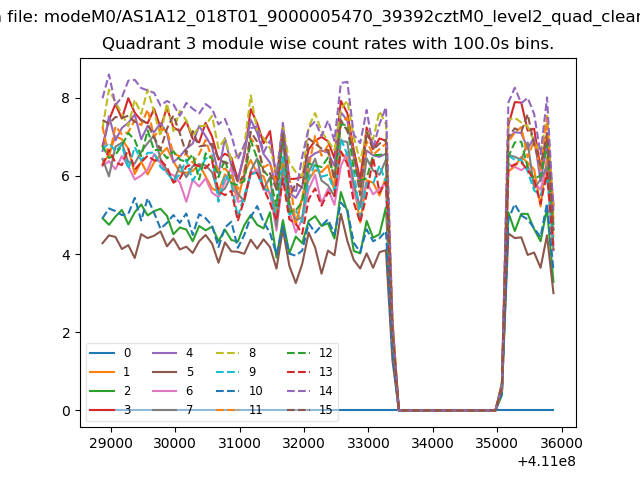
| Module-wise count rates for Quadrant C Data is divided into 100 sec bins |
 |
 |
| Module-wise count rates for Quadrant D Data is divided into 100 sec bins |
 |
 |
| Parameter | Plot |
|---|---|
| CZT HV Monitor | 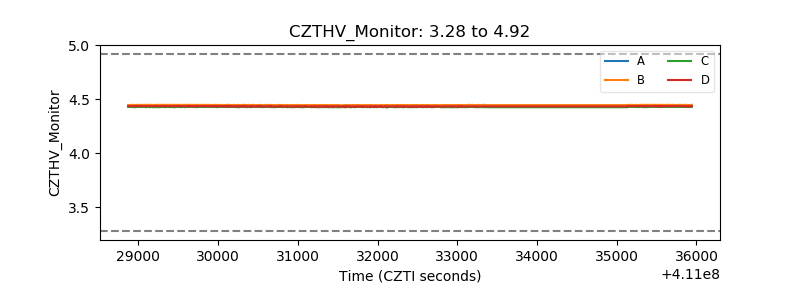 |
| D_VDD | 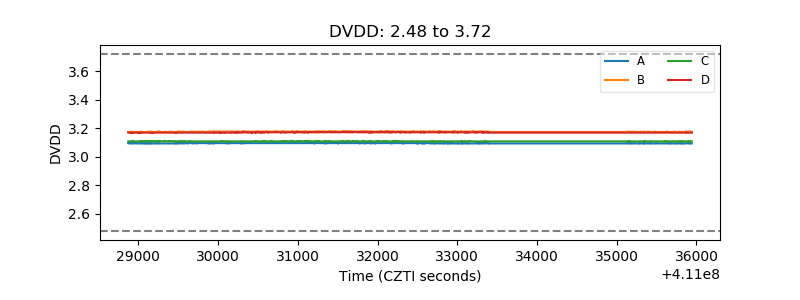 |
| Temperature 1 | 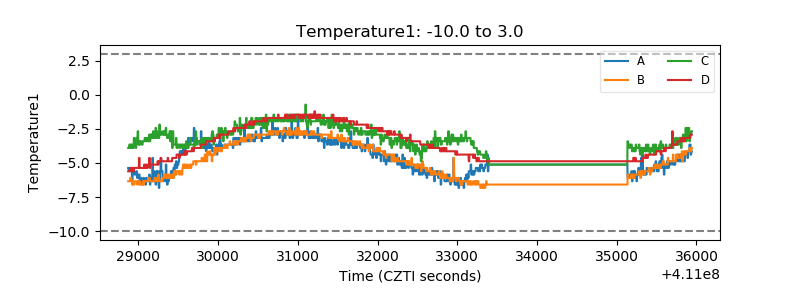 |
| Veto HV Monitor | 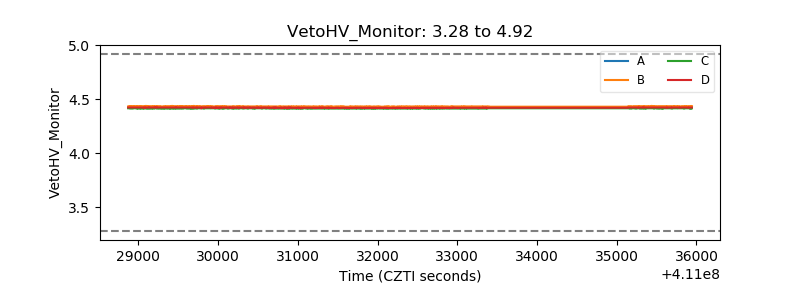 |
| Veto LLD | 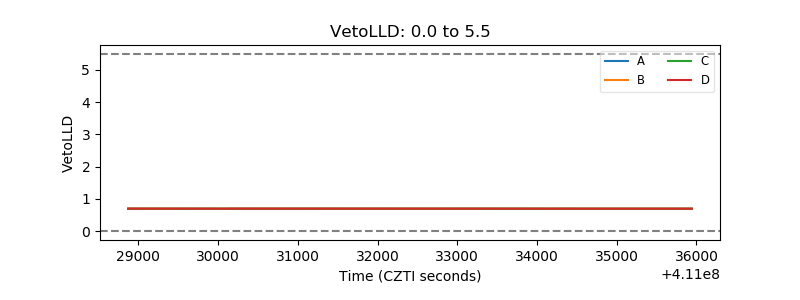 |
| Alpha Counter | 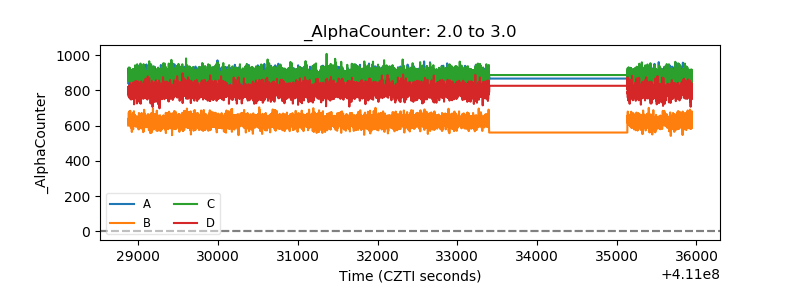 |
| _CPM_Rate | 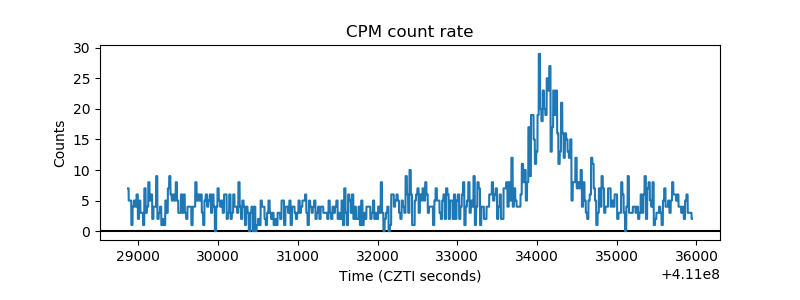 |
| CZT Counter | 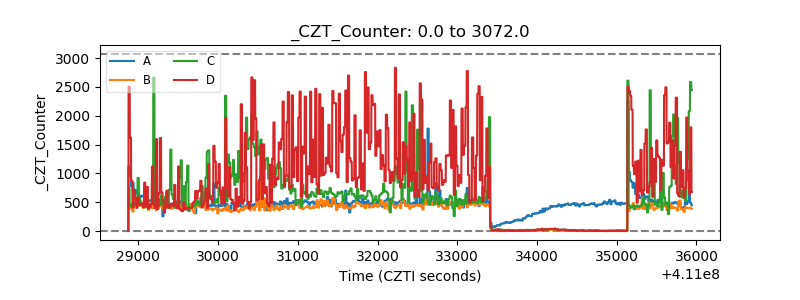 |
| +2.5 Volts monitor | 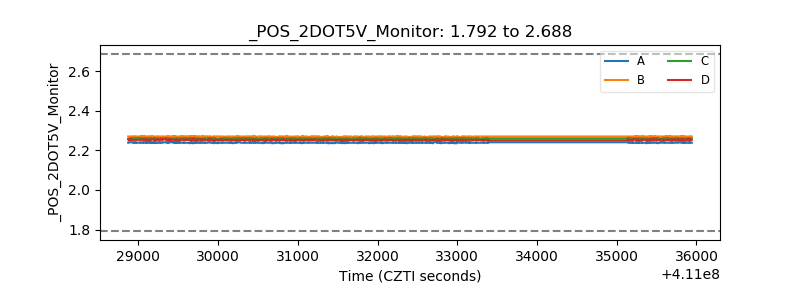 |
| +5 Volts monitor | 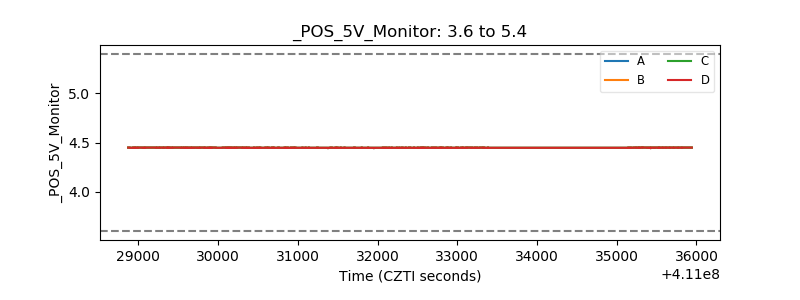 |
| _ROLL_ROT | 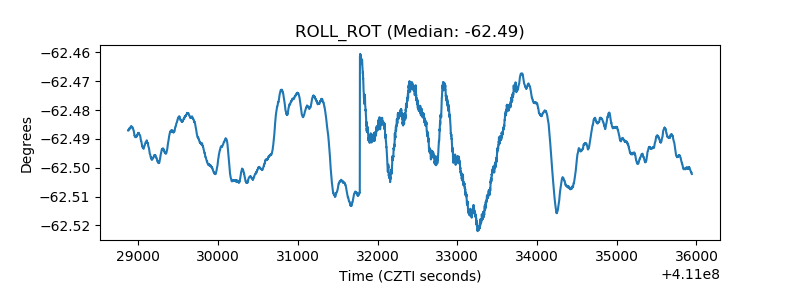 |
| _Roll_DEC | 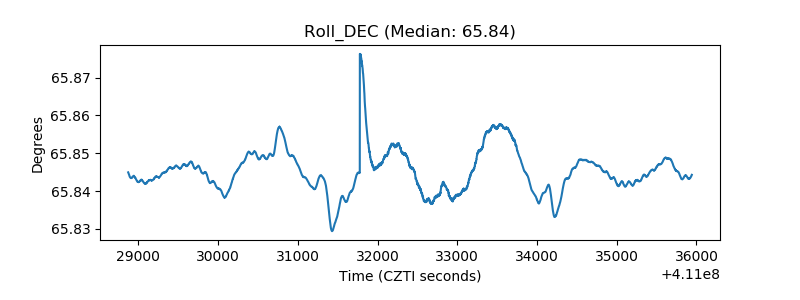 |
| _Roll_RA | 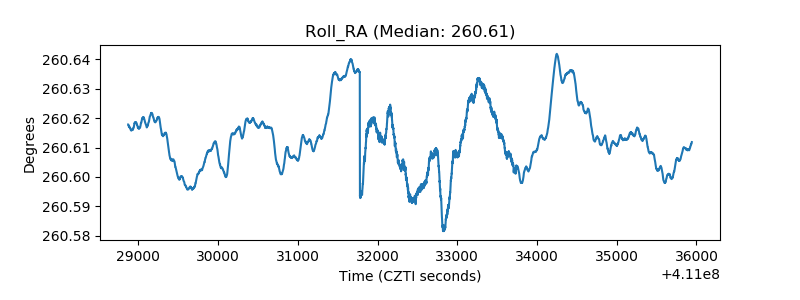 |
| Veto Counter | 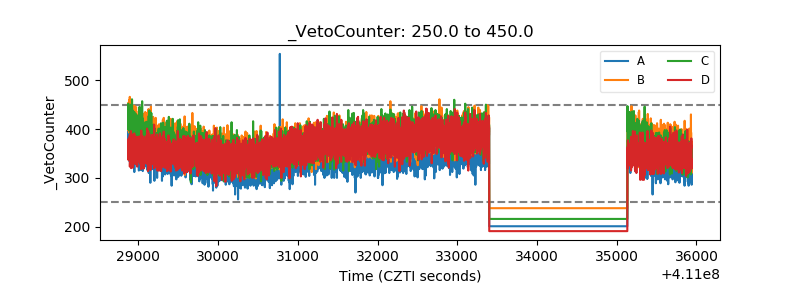 |