| Param | Original file | Final file |
|---|---|---|
| Filename | modeM0/AS1A12_018T01_9000005470_39394cztM0_level2.fits | modeM0/AS1A12_018T01_9000005470_39394cztM0_level2_quad_clean.evt |
| Size (bytes) | 443,220,480 | 93,453,120 |
| Size | 422.7 MB | 89.1 MB |
| Events in quadrant A | 3,074,867 | 658,922 |
| Events in quadrant B | 2,759,378 | 671,063 |
| Events in quadrant C | 2,908,262 | 631,014 |
| Events in quadrant D | 7,200,663 | 452,487 |
| Mode M9 | |||
|---|---|---|---|
| Quadrant | BADHDUFLAG | Total packets | Discarded packets |
| A | 0 | 19 | 0 |
| B | 0 | 19 | 0 |
| C | 0 | 19 | 0 |
| D | 0 | 20 | 0 |
| Mode SS | |||
|---|---|---|---|
| Quadrant | BADHDUFLAG | Total packets | Discarded packets |
| A | 0 | 122 | 0 |
| B | 0 | 122 | 0 |
| C | 0 | 122 | 0 |
| D | 0 | 122 | 0 |
| Mode M0 | |||
|---|---|---|---|
| Quadrant | BADHDUFLAG | Total packets | Discarded packets |
| A | 0 | 12708 | 3 |
| B | 0 | 12366 | 2 |
| C | 0 | 12382 | 2 |
| D | 0 | 25339 | 2 |
| Quadrant | Total seconds | Saturated seconds | Saturation percentage |
|---|---|---|---|
| A | 5953 | 16 | 0.268772% |
| B | 5953 | 20 | 0.335965% |
| C | 5953 | 3 | 0.050395% |
| D | 5953 | 1580 | 26.541240% |
Noise dominated data is calculated using 1-second bins in cleaned event files. If a bin has >2000 counts, and if more than 50% of those come from <1% of pixels, then it is considered to be noise-dominated and hence unusable.
| Quadrant | # 1 sec bins | Bins with >0 counts | Bins with >2000 counts | High rate bins dominated by noise | Noise dominated (total time) | Noise dominated (detector-on time) | Marked lightcurve |
|---|---|---|---|---|---|---|---|
| A | 7266 | 5954 | 3 | 3 | 0.04% | 0.05% | 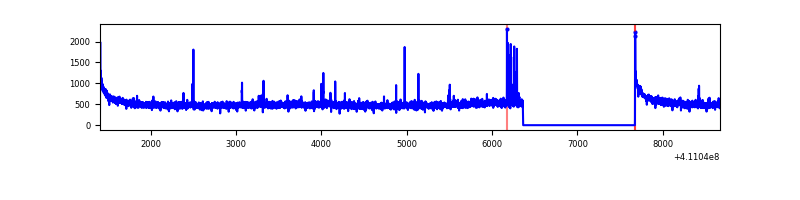 |
| B | 7266 | 5954 | 11 | 11 | 0.15% | 0.18% | 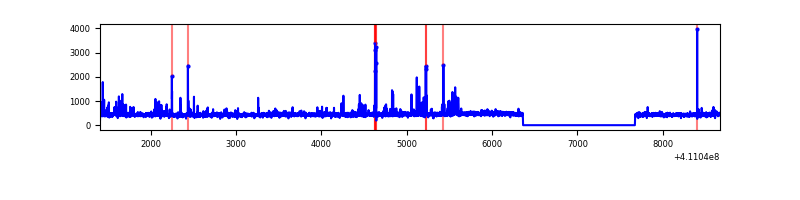 |
| C | 7266 | 5954 | 1 | 1 | 0.01% | 0.02% | 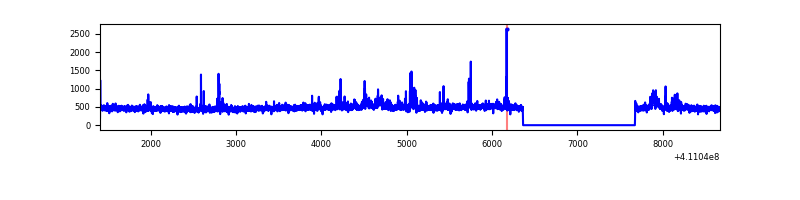 |
| D | 7266 | 5954 | 1371 | 1371 | 18.87% | 23.03% | 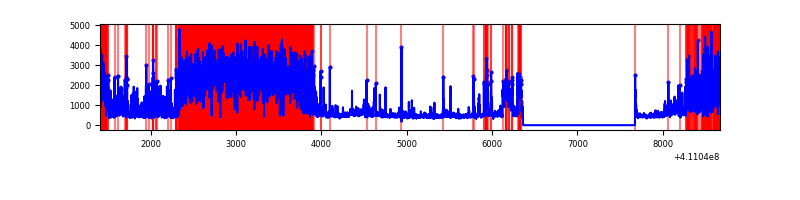 |
Top three noisy pixels from each quadrant. If the there are fewer than three noisy pixels in the level2.evt file, extra rows are filled as -1
| Pixel properties | Quadrant properties | ||||||
|---|---|---|---|---|---|---|---|
| Quadrant | DetID | PixID | Counts | Sigma | Mean | Median | Sigma |
| A | 10 | 83 | 467114 | 3502.3 | 653 | 640 | 133.2 |
| A | 13 | 248 | 62076 | 461.26 | 653 | 640 | 133.2 |
| A | 13 | 254 | 9675 | 67.84 | 653 | 640 | 133.2 |
| B | 5 | 172 | 182379 | 1439.36 | 647 | 629 | 126.3 |
| B | 12 | 111 | 15983 | 121.6 | 647 | 629 | 126.3 |
| B | 11 | 111 | 14611 | 110.73 | 647 | 629 | 126.3 |
| C | 15 | 214 | 271258 | 1824.76 | 634 | 634 | 148.3 |
| C | 9 | 187 | 93217 | 624.27 | 634 | 634 | 148.3 |
| C | 14 | 254 | 52696 | 351.04 | 634 | 634 | 148.3 |
| D | 12 | 235 | 4344518 | 30401.58 | 572 | 555 | 142.9 |
| D | 2 | 249 | 341509 | 2386.19 | 572 | 555 | 142.9 |
| D | 13 | 249 | 188798 | 1317.43 | 572 | 555 | 142.9 |
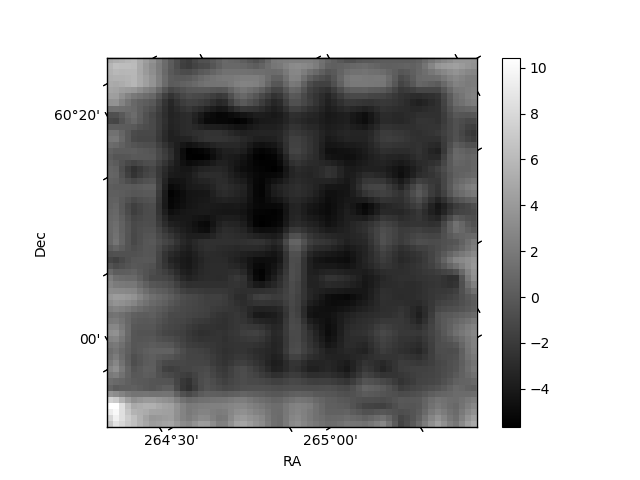
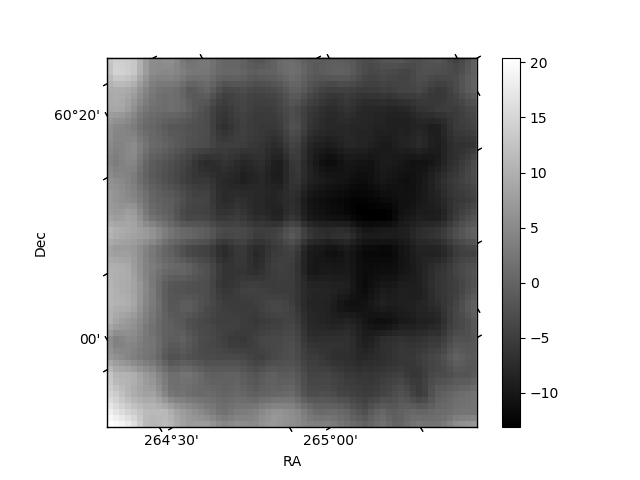
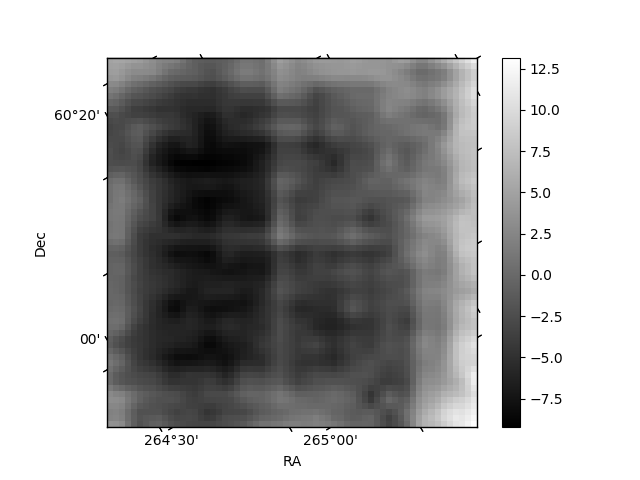
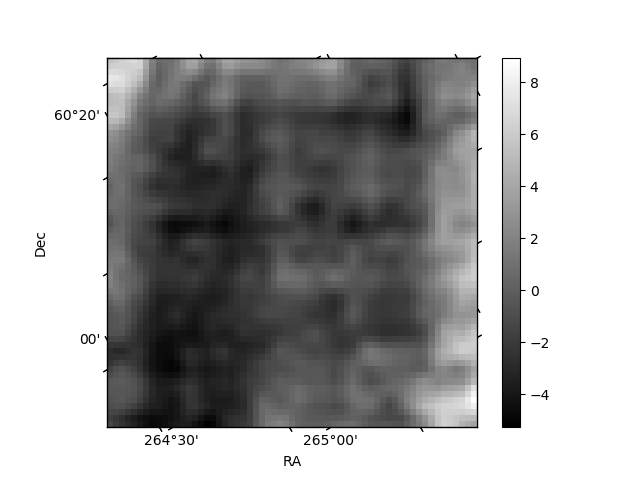
Histogram calculated using DETX and DETY for each event in the final _common_clean file
| Quadrant A |  |
 |
Quadrant B |
|---|---|---|---|
| Quadrant D |  |
 |
Quadrant C |
| Plot type | Count rate plots | Images |
|---|---|---|
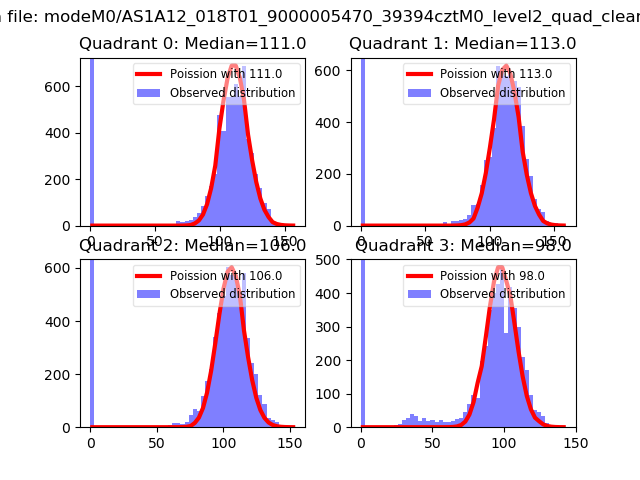
| Comparison with Poisson distribution Blue bars denote a histogram of data divided into 1 sec bins. Red curve is a Poisson curve with rate = median count rate of data. |
 |
 |
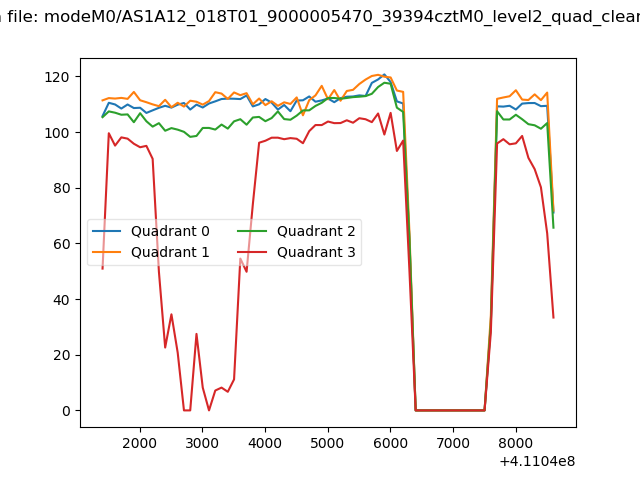
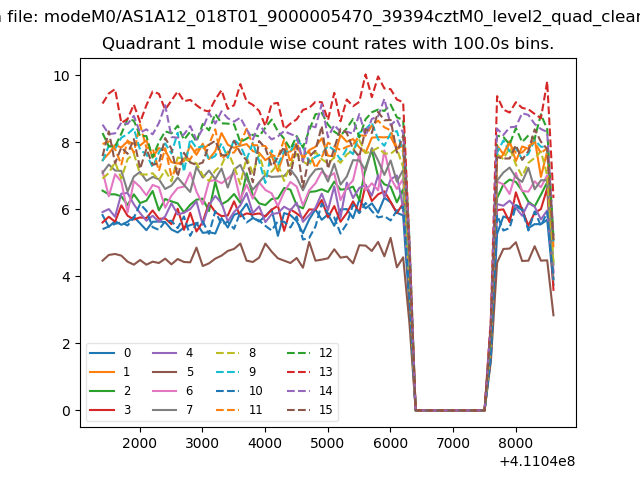
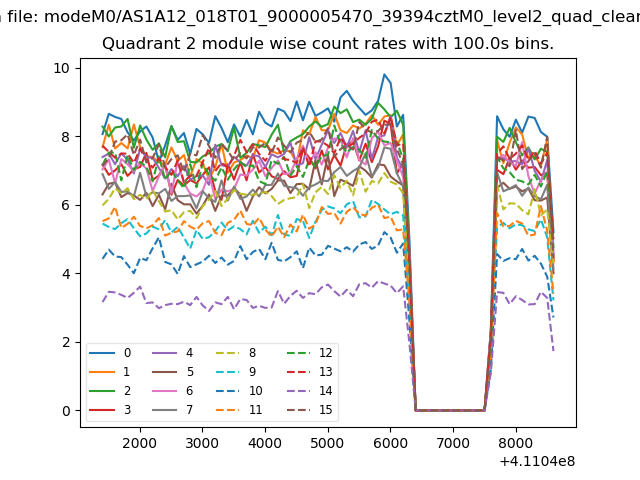
| Quadrant-wise count rates Data is divided into 100 sec bins |
 |
|
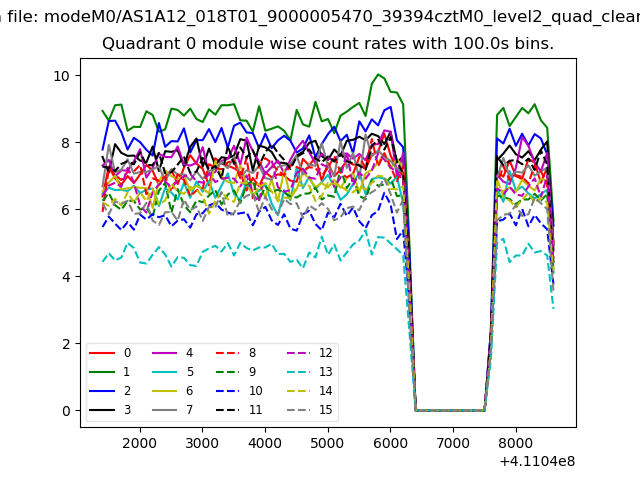
| Module-wise count rates for Quadrant A Data is divided into 100 sec bins |
 |
 |
| Module-wise count rates for Quadrant B Data is divided into 100 sec bins |
 |
 |
| Module-wise count rates for Quadrant C Data is divided into 100 sec bins |
 |
 |
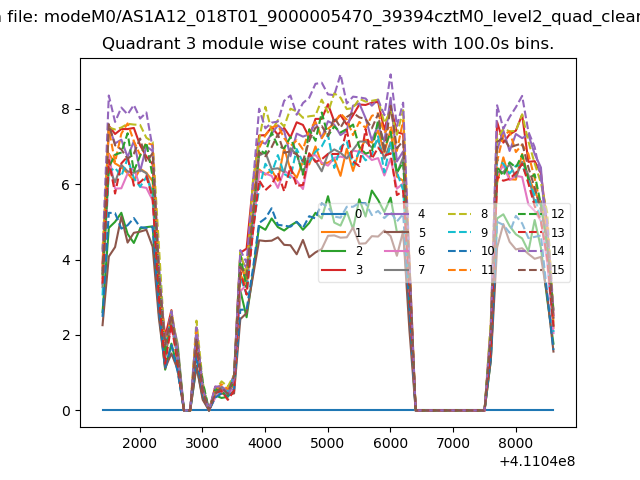
| Module-wise count rates for Quadrant D Data is divided into 100 sec bins |
 |
 |
| Parameter | Plot |
|---|---|
| CZT HV Monitor | 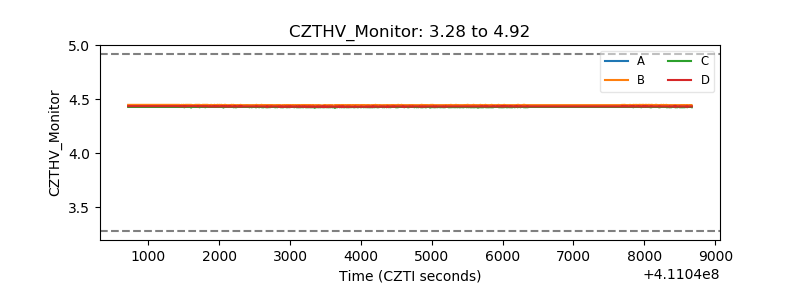 |
| D_VDD | 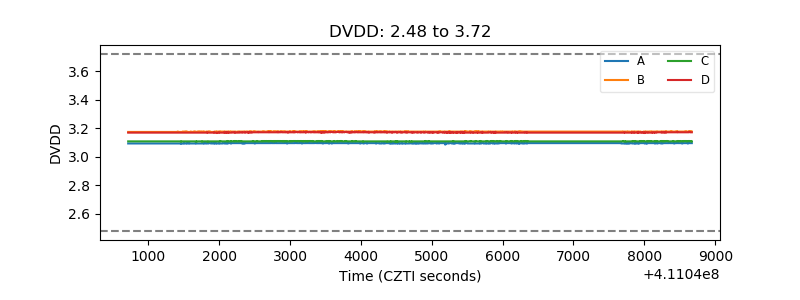 |
| Temperature 1 | 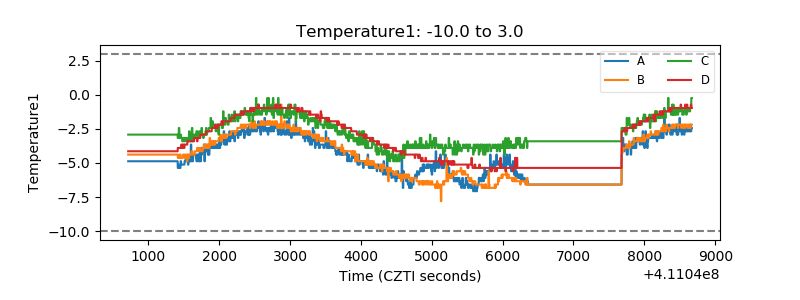 |
| Veto HV Monitor | 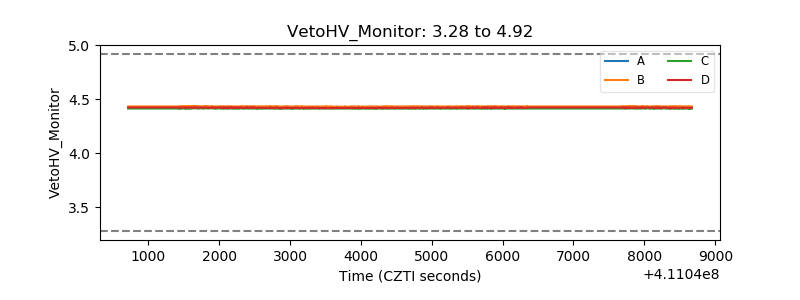 |
| Veto LLD | 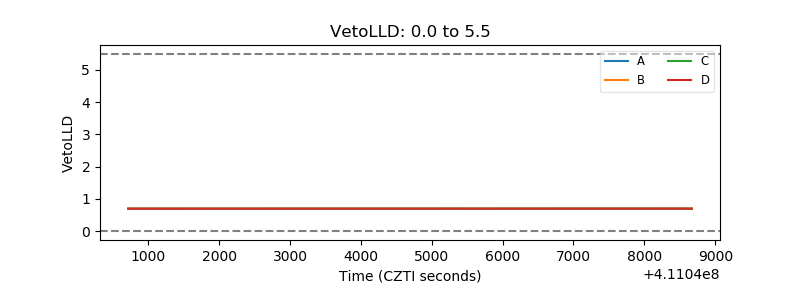 |
| Alpha Counter | 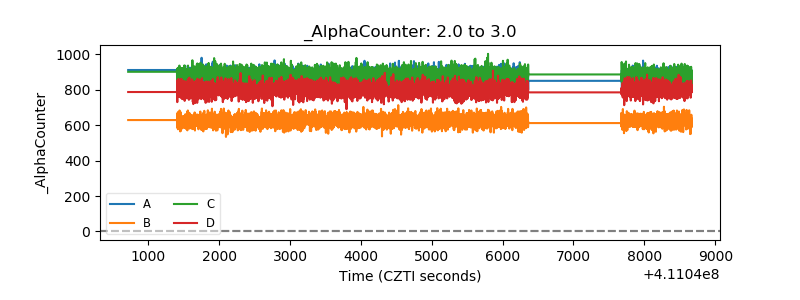 |
| _CPM_Rate | 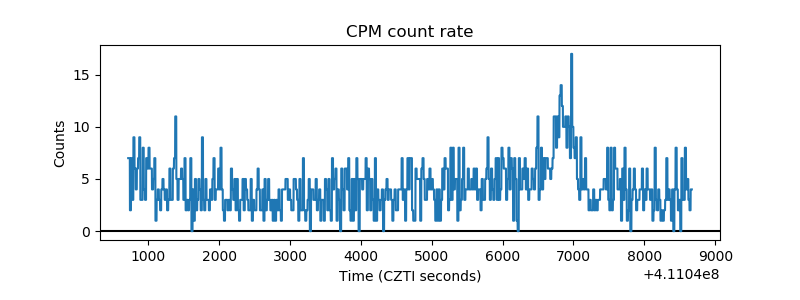 |
| CZT Counter | 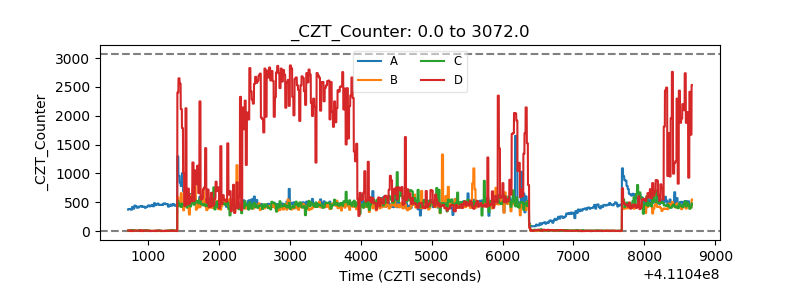 |
| +2.5 Volts monitor | 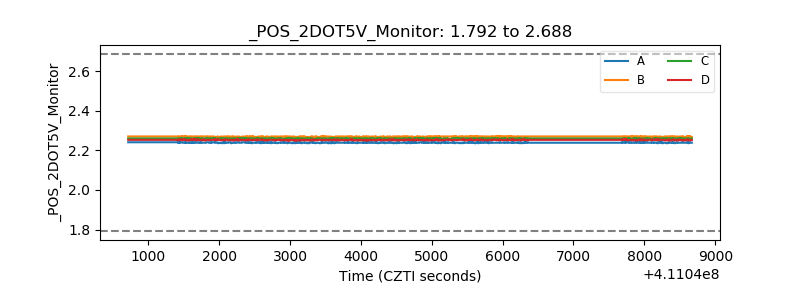 |
| +5 Volts monitor | 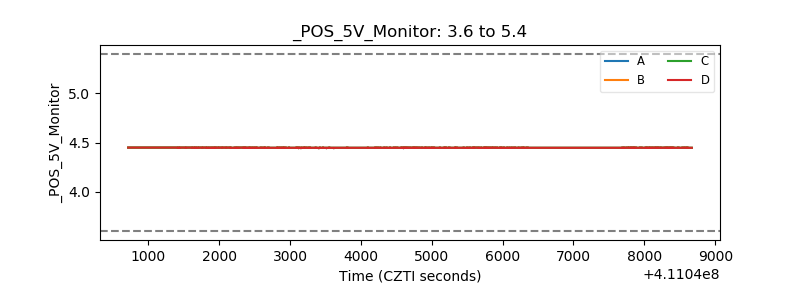 |
| _ROLL_ROT | 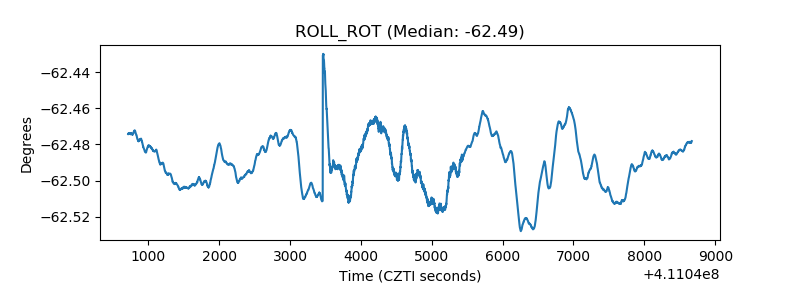 |
| _Roll_DEC | 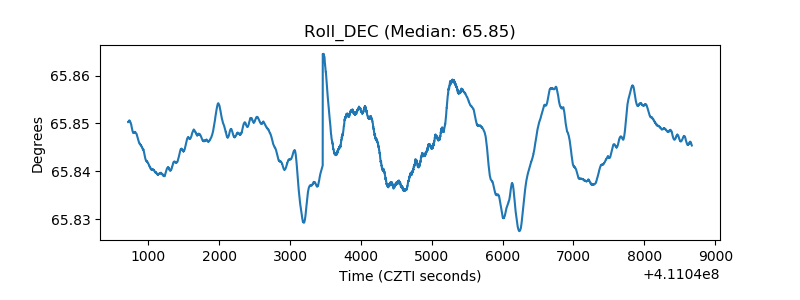 |
| _Roll_RA | 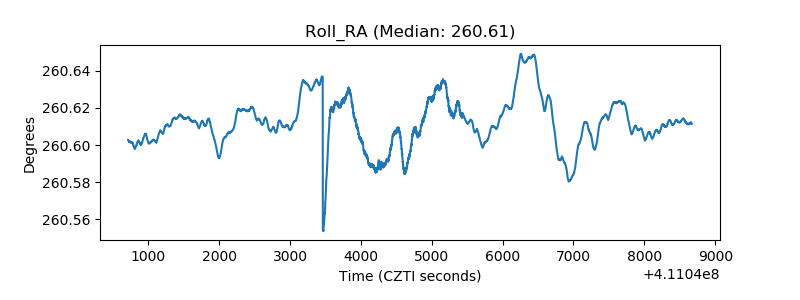 |
| Veto Counter | 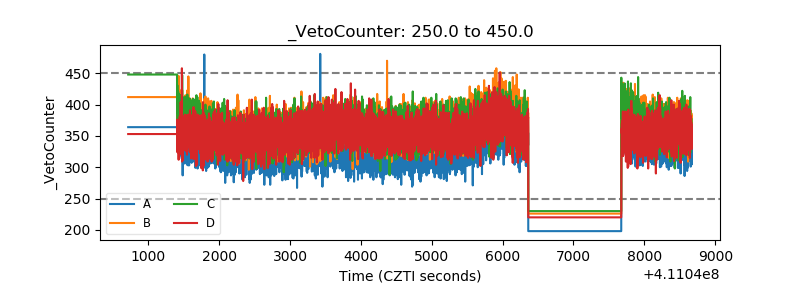 |