| Param | Original file | Final file |
|---|---|---|
| Filename | modeM0/AS1A12_018T01_9000005470_39398cztM0_level2.fits | modeM0/AS1A12_018T01_9000005470_39398cztM0_level2_quad_clean.evt |
| Size (bytes) | 780,724,800 | 147,735,360 |
| Size | 744.6 MB | 140.9 MB |
| Events in quadrant A | 5,783,921 | 1,021,614 |
| Events in quadrant B | 4,249,784 | 1,064,512 |
| Events in quadrant C | 5,732,297 | 995,789 |
| Events in quadrant D | 12,397,102 | 731,086 |
| Mode M9 | |||
|---|---|---|---|
| Quadrant | BADHDUFLAG | Total packets | Discarded packets |
| A | 0 | 31 | 0 |
| B | 0 | 31 | 0 |
| C | 0 | 31 | 0 |
| D | 0 | 31 | 0 |
| Mode SS | |||
|---|---|---|---|
| Quadrant | BADHDUFLAG | Total packets | Discarded packets |
| A | 0 | 196 | 0 |
| B | 0 | 196 | 0 |
| C | 0 | 196 | 0 |
| D | 0 | 196 | 0 |
| Mode M0 | |||
|---|---|---|---|
| Quadrant | BADHDUFLAG | Total packets | Discarded packets |
| A | 0 | 23213 | 3 |
| B | 0 | 19405 | 2 |
| C | 0 | 23296 | 2 |
| D | 0 | 43420 | 2 |
| Quadrant | Total seconds | Saturated seconds | Saturation percentage |
|---|---|---|---|
| A | 9510 | 236 | 2.481598% |
| B | 9510 | 22 | 0.231335% |
| C | 9510 | 184 | 1.934805% |
| D | 9510 | 2453 | 25.793901% |
Noise dominated data is calculated using 1-second bins in cleaned event files. If a bin has >2000 counts, and if more than 50% of those come from <1% of pixels, then it is considered to be noise-dominated and hence unusable.
| Quadrant | # 1 sec bins | Bins with >0 counts | Bins with >2000 counts | High rate bins dominated by noise | Noise dominated (total time) | Noise dominated (detector-on time) | Marked lightcurve |
|---|---|---|---|---|---|---|---|
| A | 12615 | 9512 | 163 | 163 | 1.29% | 1.71% | 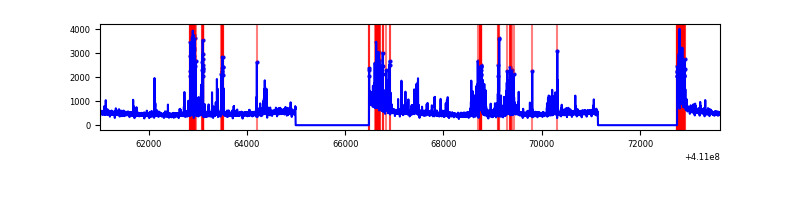 |
| B | 12615 | 9512 | 9 | 9 | 0.07% | 0.09% | 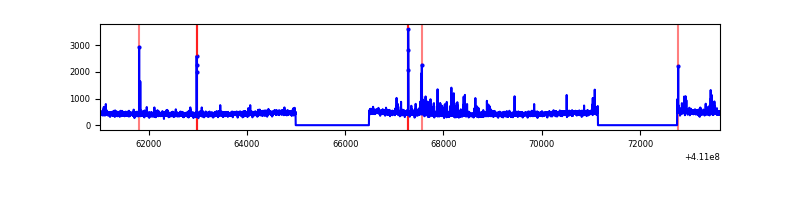 |
| C | 12615 | 9512 | 147 | 147 | 1.17% | 1.55% | 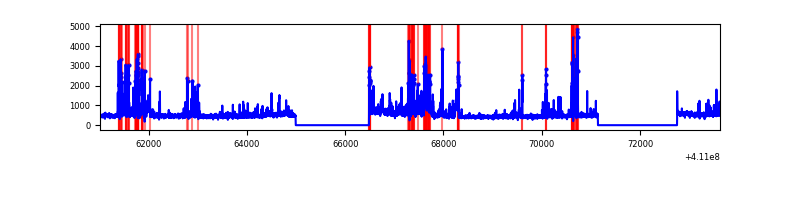 |
| D | 12615 | 9512 | 2234 | 2234 | 17.71% | 23.49% | 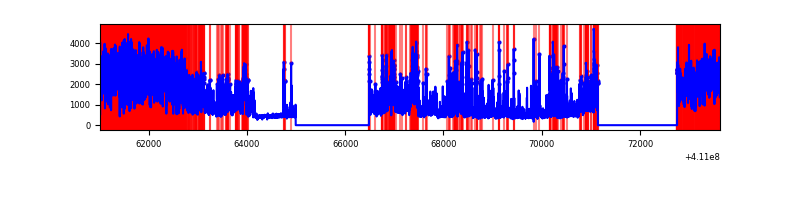 |
Top three noisy pixels from each quadrant. If the there are fewer than three noisy pixels in the level2.evt file, extra rows are filled as -1
| Pixel properties | Quadrant properties | ||||||
|---|---|---|---|---|---|---|---|
| Quadrant | DetID | PixID | Counts | Sigma | Mean | Median | Sigma |
| A | 13 | 248 | 1064803 | 5073.64 | 1033 | 1012 | 209.7 |
| A | 10 | 83 | 625095 | 2976.5 | 1033 | 1012 | 209.7 |
| A | 2 | 79 | 93463 | 440.94 | 1033 | 1012 | 209.7 |
| B | 5 | 172 | 129228 | 637.15 | 1039 | 1009 | 201.2 |
| B | 12 | 111 | 26057 | 124.47 | 1039 | 1009 | 201.2 |
| B | 11 | 111 | 23990 | 114.2 | 1039 | 1009 | 201.2 |
| C | 9 | 187 | 540299 | 2281.83 | 1013 | 1018 | 236.3 |
| C | 14 | 254 | 430677 | 1817.99 | 1013 | 1018 | 236.3 |
| C | 15 | 208 | 396504 | 1673.39 | 1013 | 1018 | 236.3 |
| D | 12 | 235 | 8082148 | 35828.88 | 915 | 888 | 225.6 |
| D | 13 | 249 | 501818 | 2220.91 | 915 | 888 | 225.6 |
| D | 2 | 249 | 165899 | 731.59 | 915 | 888 | 225.6 |
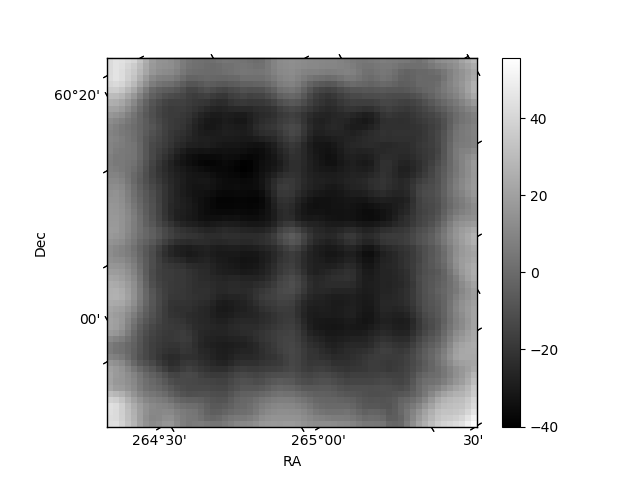
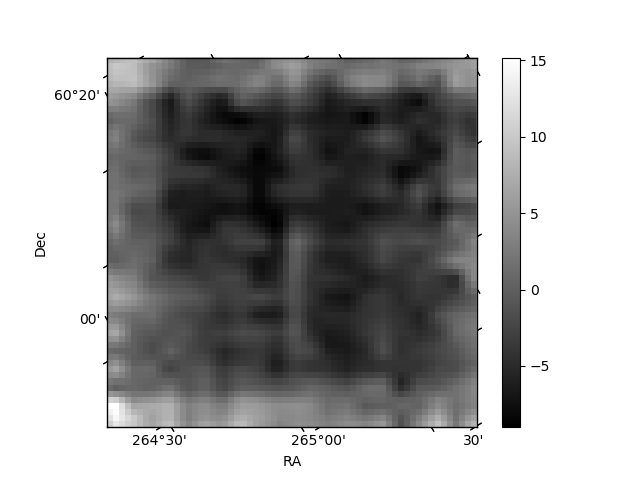
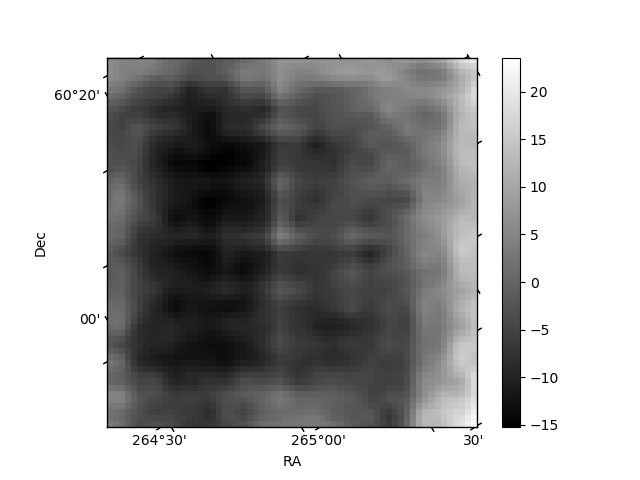
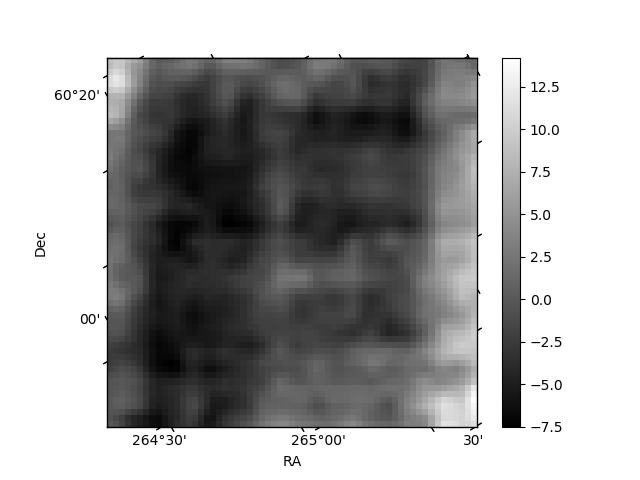
Histogram calculated using DETX and DETY for each event in the final _common_clean file
| Quadrant A | 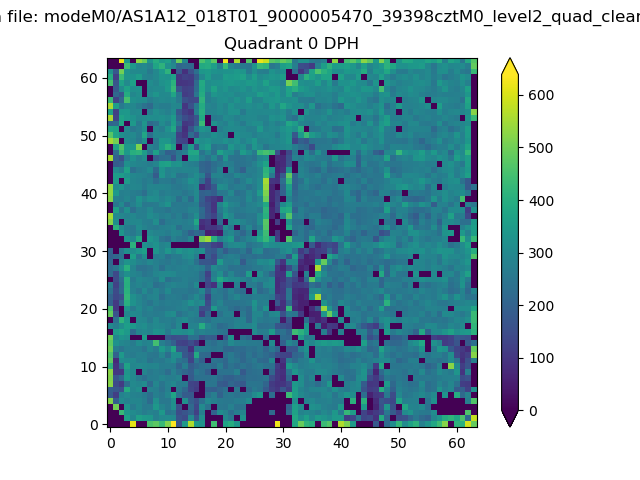 |
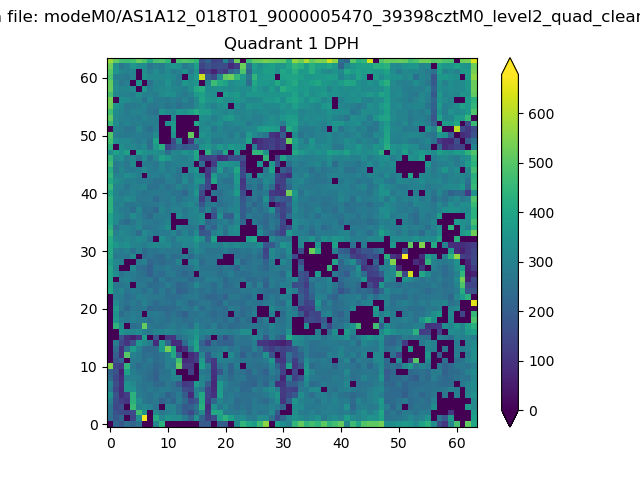 |
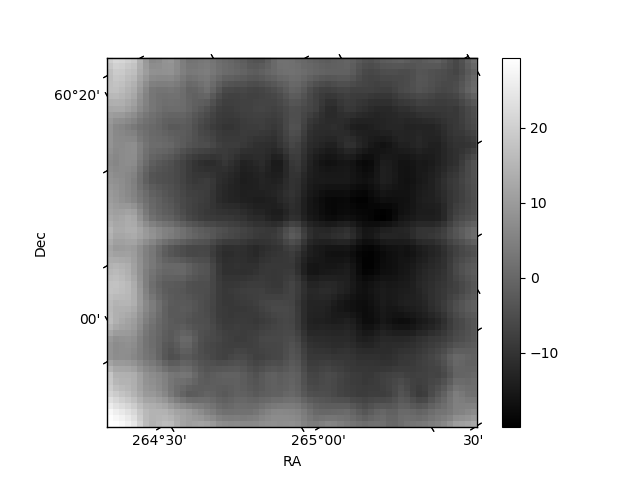
Quadrant B |
|---|---|---|---|
| Quadrant D | 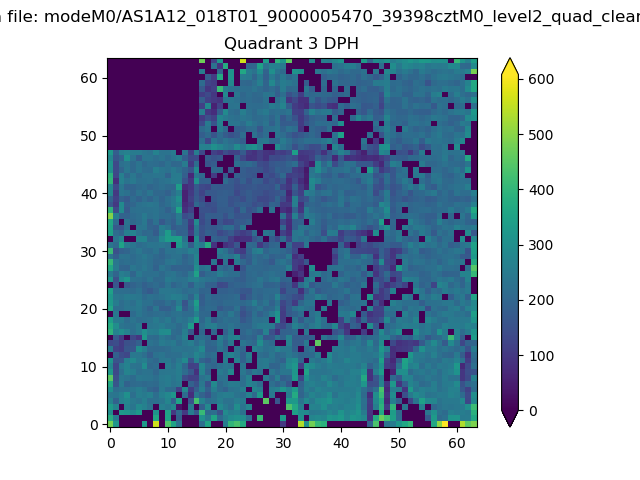 |
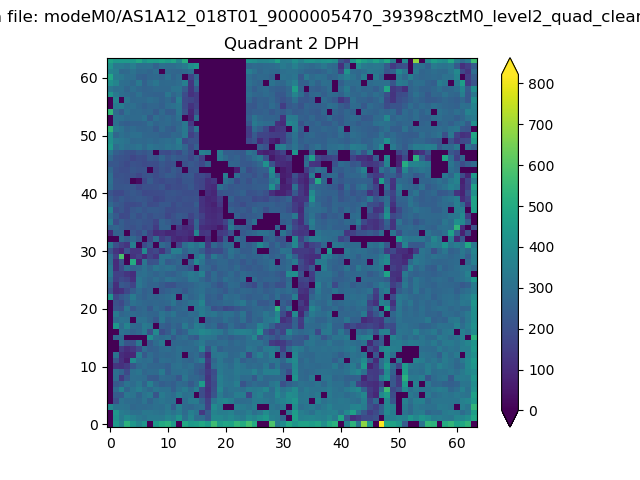 |
Quadrant C |
| Plot type | Count rate plots | Images |
|---|---|---|
| Comparison with Poisson distribution Blue bars denote a histogram of data divided into 1 sec bins. Red curve is a Poisson curve with rate = median count rate of data. |
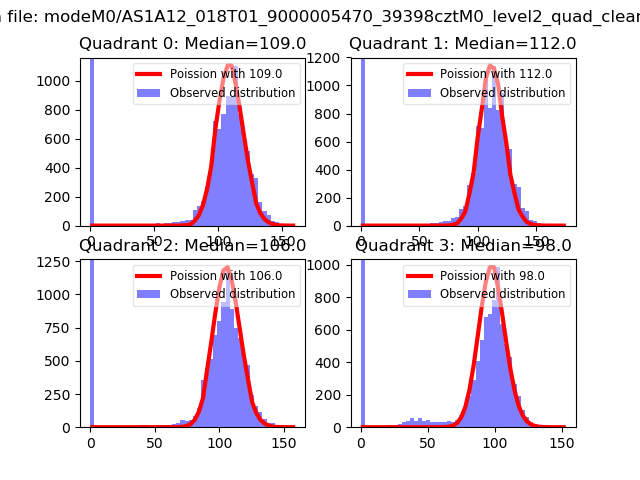 |
 |
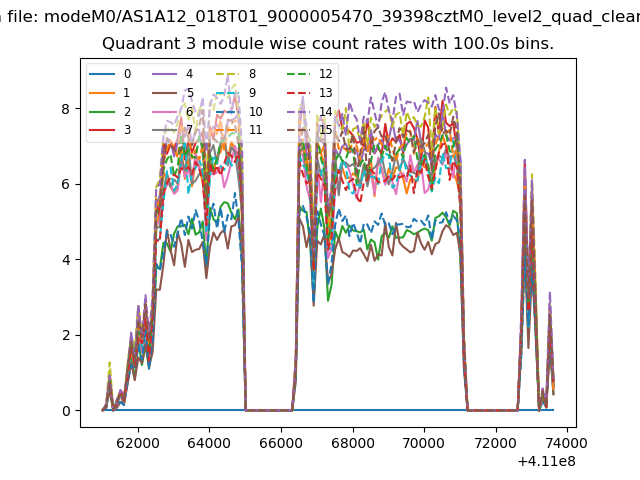
| Quadrant-wise count rates Data is divided into 100 sec bins |
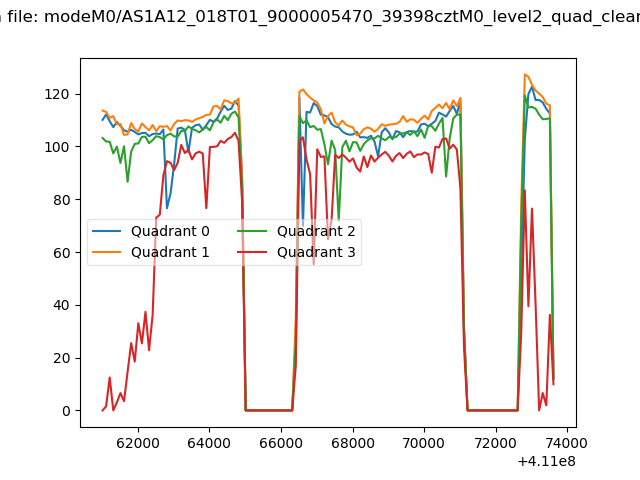 |
|
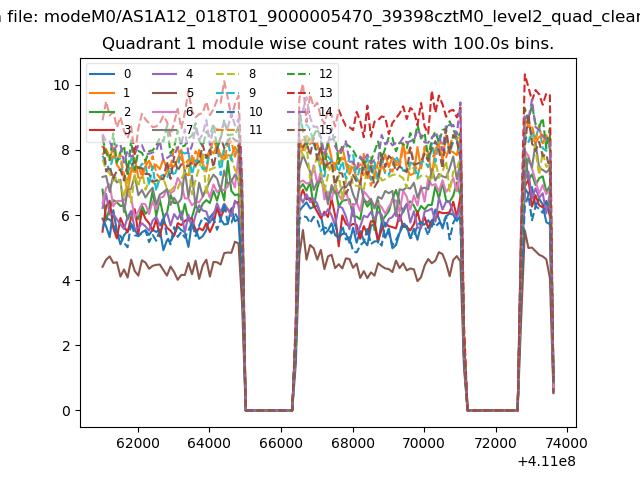
| Module-wise count rates for Quadrant A Data is divided into 100 sec bins |
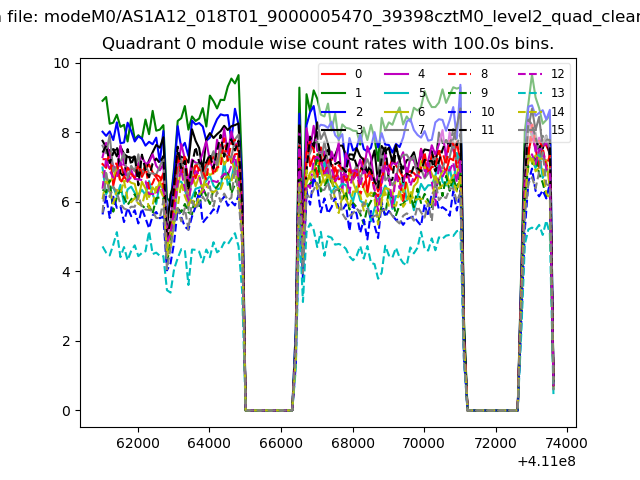 |
 |
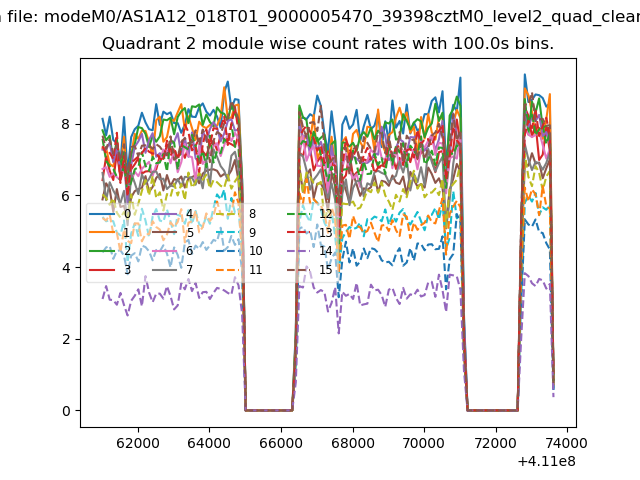
| Module-wise count rates for Quadrant B Data is divided into 100 sec bins |
 |
 |
| Module-wise count rates for Quadrant C Data is divided into 100 sec bins |
 |
 |
| Module-wise count rates for Quadrant D Data is divided into 100 sec bins |
 |
 |
| Parameter | Plot |
|---|---|
| CZT HV Monitor | 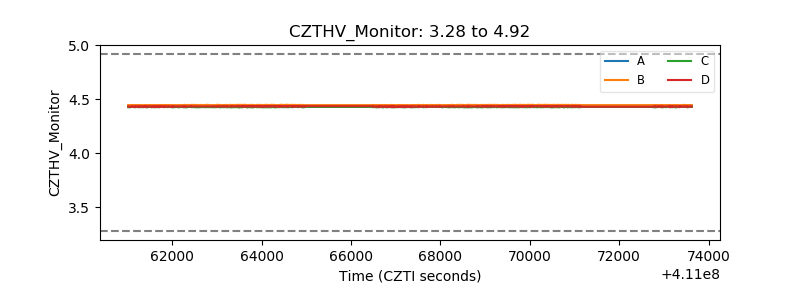 |
| D_VDD | 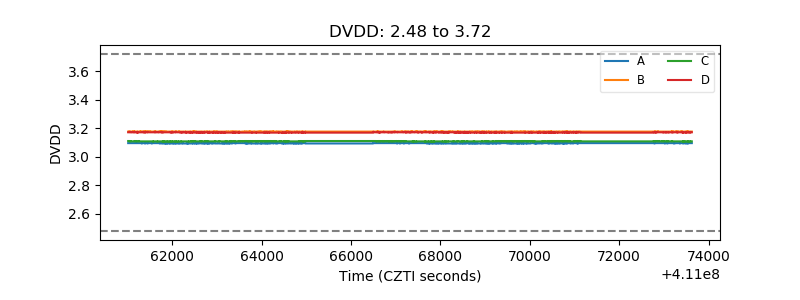 |
| Temperature 1 | 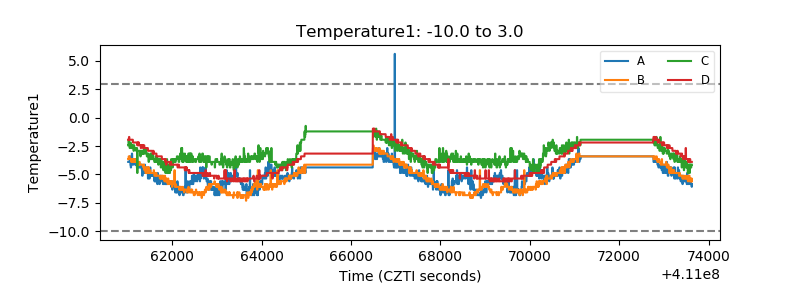 |
| Veto HV Monitor | 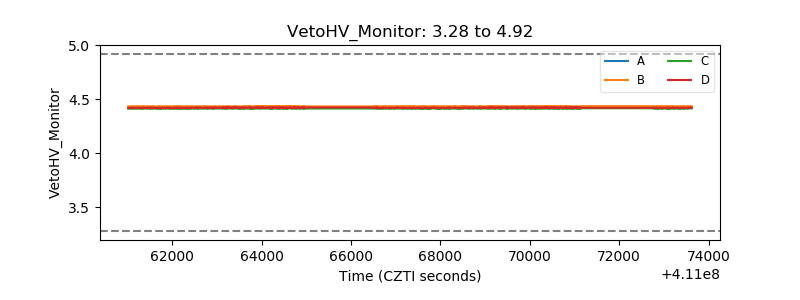 |
| Veto LLD | 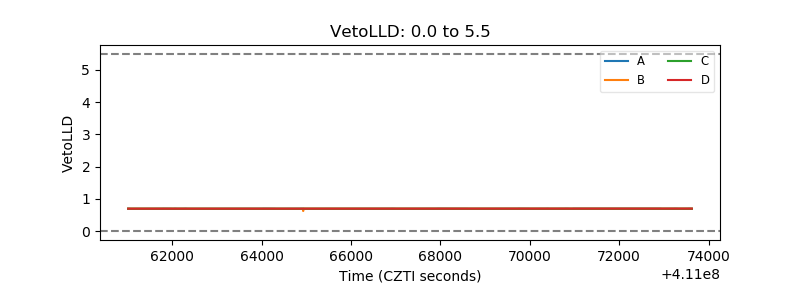 |
| Alpha Counter | 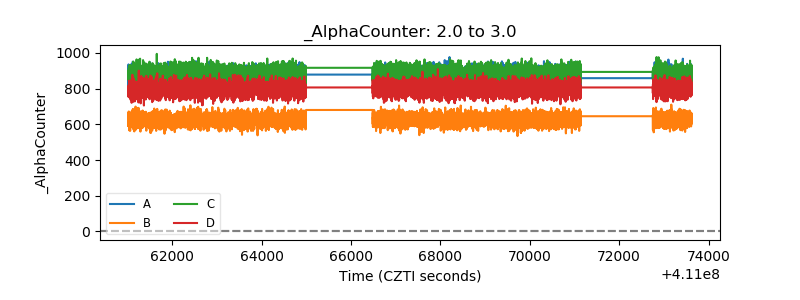 |
| _CPM_Rate | 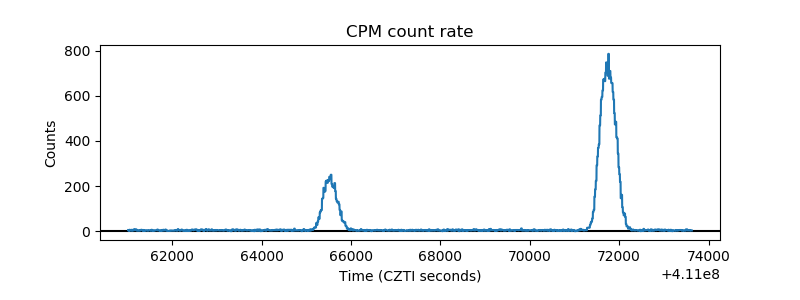 |
| CZT Counter | 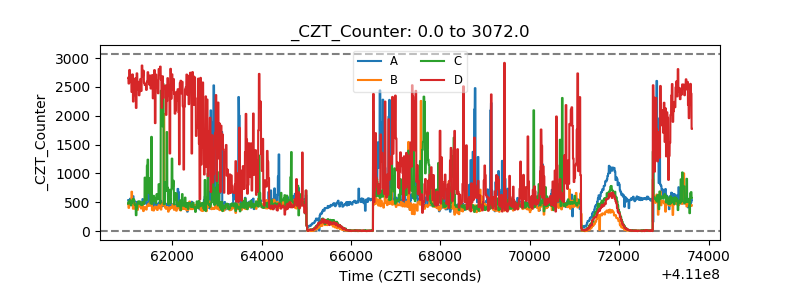 |
| +2.5 Volts monitor | 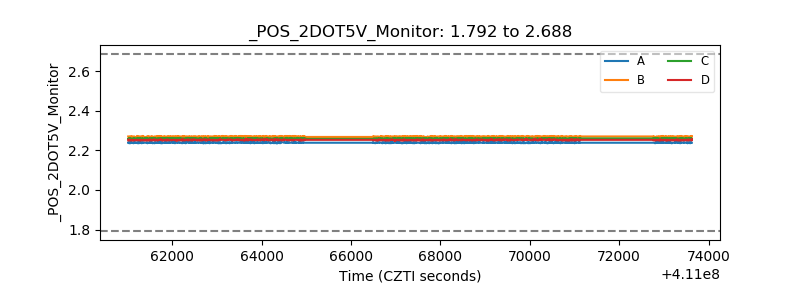 |
| +5 Volts monitor | 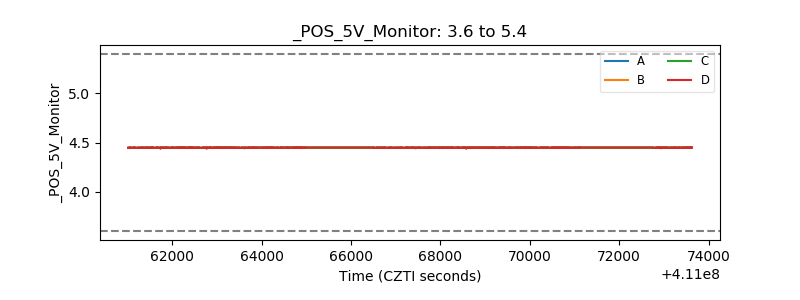 |
| _ROLL_ROT | 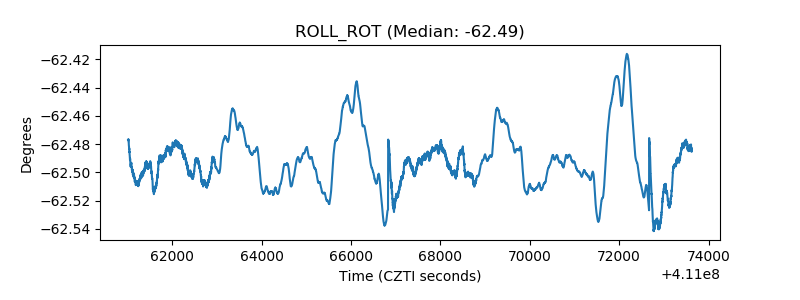 |
| _Roll_DEC | 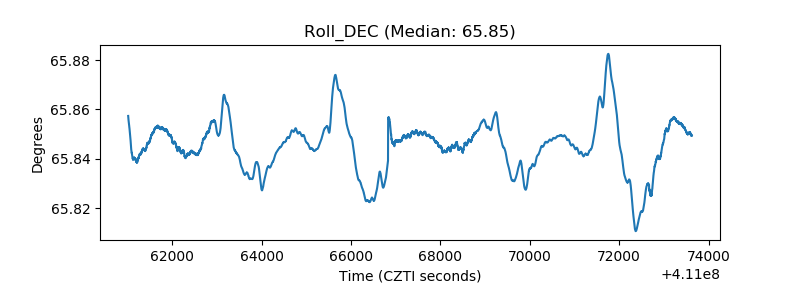 |
| _Roll_RA | 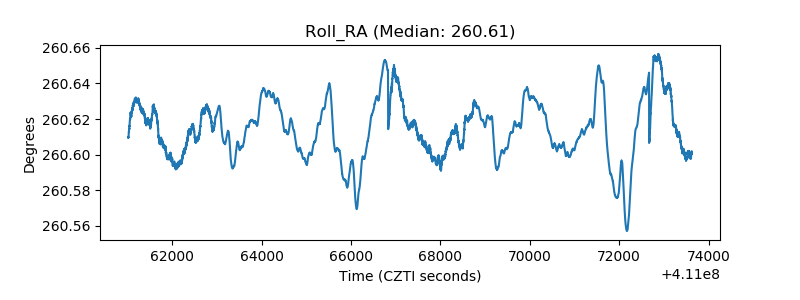 |
| Veto Counter | 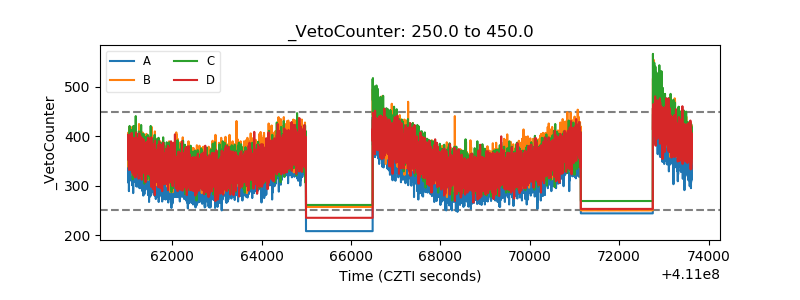 |