| Param | Original file | Final file |
|---|---|---|
| Filename | modeM0/AS1A12_018T01_9000005470_39400cztM0_level2.fits | modeM0/AS1A12_018T01_9000005470_39400cztM0_level2_quad_clean.evt |
| Size (bytes) | 414,169,920 | 86,564,160 |
| Size | 395.0 MB | 82.6 MB |
| Events in quadrant A | 2,880,594 | 594,259 |
| Events in quadrant B | 2,461,248 | 617,861 |
| Events in quadrant C | 3,287,285 | 581,356 |
| Events in quadrant D | 6,290,766 | 457,077 |
| Mode M9 | |||
|---|---|---|---|
| Quadrant | BADHDUFLAG | Total packets | Discarded packets |
| A | 0 | 24 | 0 |
| B | 0 | 24 | 0 |
| C | 0 | 24 | 0 |
| D | 0 | 25 | 0 |
| Mode SS | |||
|---|---|---|---|
| Quadrant | BADHDUFLAG | Total packets | Discarded packets |
| A | 0 | 108 | 0 |
| B | 0 | 108 | 0 |
| C | 0 | 108 | 0 |
| D | 0 | 108 | 0 |
| Mode M0 | |||
|---|---|---|---|
| Quadrant | BADHDUFLAG | Total packets | Discarded packets |
| A | 0 | 12009 | 3 |
| B | 0 | 11053 | 2 |
| C | 0 | 13369 | 2 |
| D | 0 | 22371 | 2 |
| Quadrant | Total seconds | Saturated seconds | Saturation percentage |
|---|---|---|---|
| A | 5290 | 66 | 1.247637% |
| B | 5290 | 12 | 0.226843% |
| C | 5290 | 116 | 2.192817% |
| D | 5290 | 1029 | 19.451796% |
Noise dominated data is calculated using 1-second bins in cleaned event files. If a bin has >2000 counts, and if more than 50% of those come from <1% of pixels, then it is considered to be noise-dominated and hence unusable.
| Quadrant | # 1 sec bins | Bins with >0 counts | Bins with >2000 counts | High rate bins dominated by noise | Noise dominated (total time) | Noise dominated (detector-on time) | Marked lightcurve |
|---|---|---|---|---|---|---|---|
| A | 7022 | 5291 | 41 | 41 | 0.58% | 0.77% |  |
| B | 7022 | 5291 | 7 | 7 | 0.10% | 0.13% | 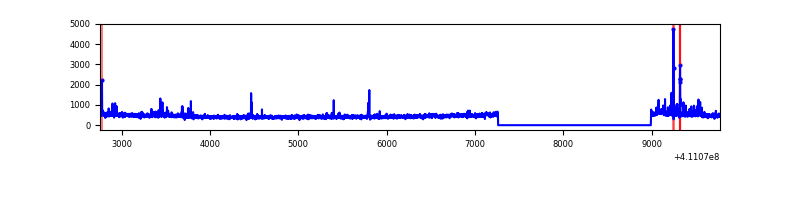 |
| C | 7022 | 5291 | 71 | 71 | 1.01% | 1.34% | 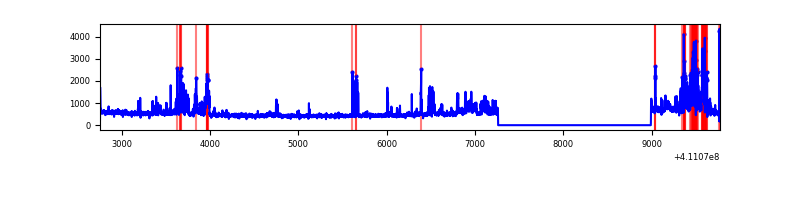 |
| D | 7022 | 5291 | 919 | 919 | 13.09% | 17.37% | 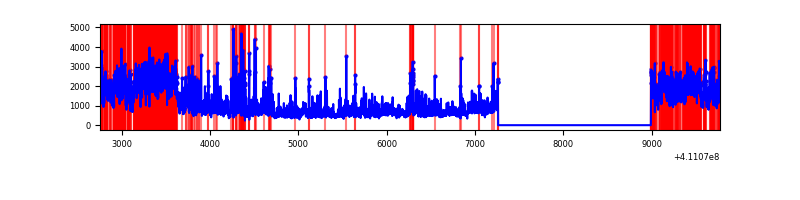 |
Top three noisy pixels from each quadrant. If the there are fewer than three noisy pixels in the level2.evt file, extra rows are filled as -1
| Pixel properties | Quadrant properties | ||||||
|---|---|---|---|---|---|---|---|
| Quadrant | DetID | PixID | Counts | Sigma | Mean | Median | Sigma |
| A | 10 | 83 | 420074 | 3528.78 | 584 | 572 | 118.9 |
| A | 13 | 248 | 176899 | 1483.23 | 584 | 572 | 118.9 |
| A | 3 | 1 | 13296 | 107.03 | 584 | 572 | 118.9 |
| B | 5 | 172 | 110228 | 971.12 | 585 | 568 | 112.9 |
| B | 0 | 190 | 18546 | 159.21 | 585 | 568 | 112.9 |
| B | 12 | 111 | 14616 | 124.41 | 585 | 568 | 112.9 |
| C | 9 | 187 | 519792 | 3884.36 | 572 | 576 | 133.7 |
| C | 14 | 254 | 307381 | 2295.27 | 572 | 576 | 133.7 |
| C | 15 | 214 | 221852 | 1655.41 | 572 | 576 | 133.7 |
| D | 12 | 235 | 3850659 | 29323.44 | 538 | 523 | 131.3 |
| D | 13 | 249 | 220940 | 1678.74 | 538 | 523 | 131.3 |
| D | 2 | 249 | 111571 | 845.76 | 538 | 523 | 131.3 |
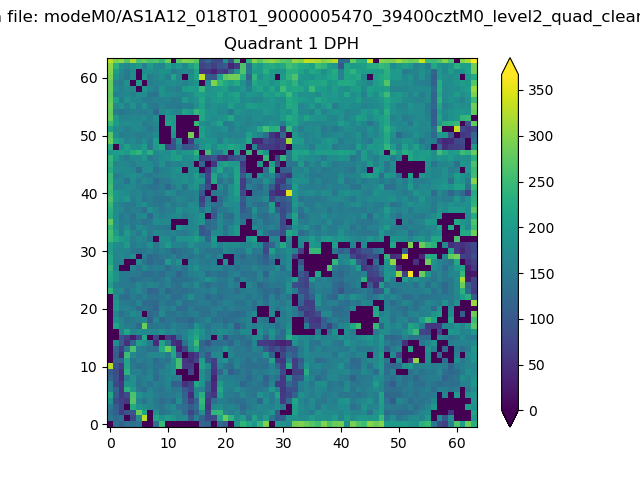
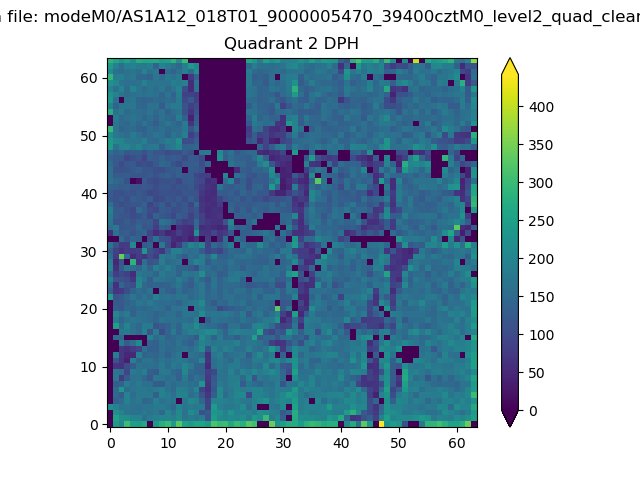
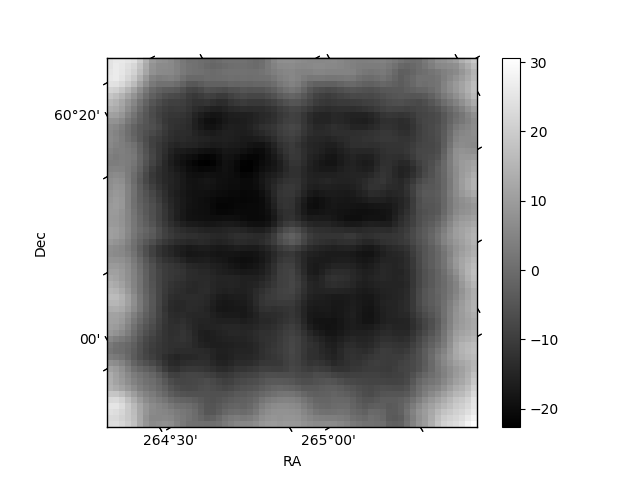
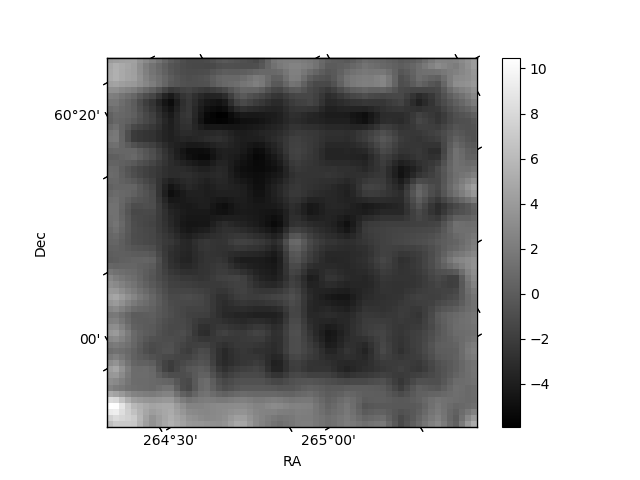
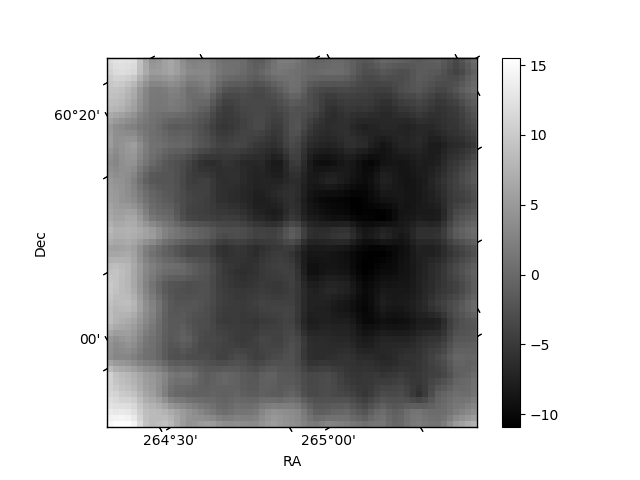
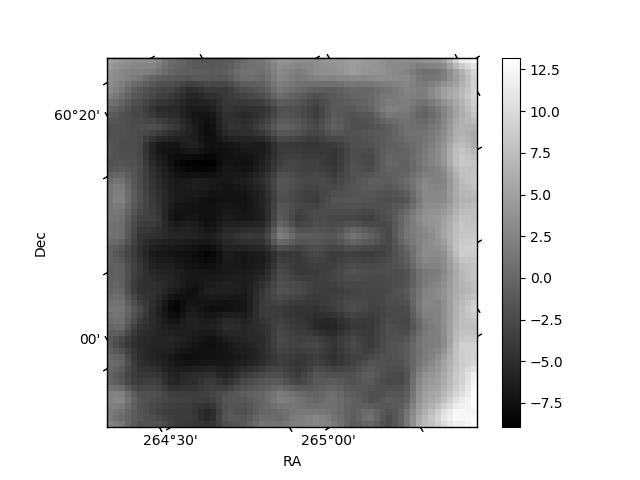
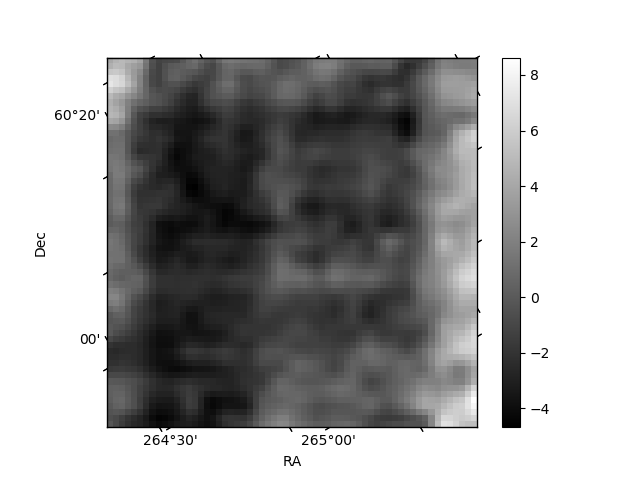
Histogram calculated using DETX and DETY for each event in the final _common_clean file
| Quadrant A | 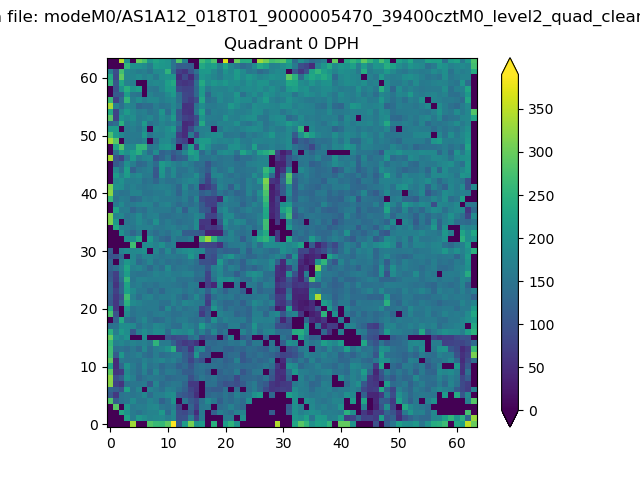 |
 |
Quadrant B |
|---|---|---|---|
| Quadrant D | 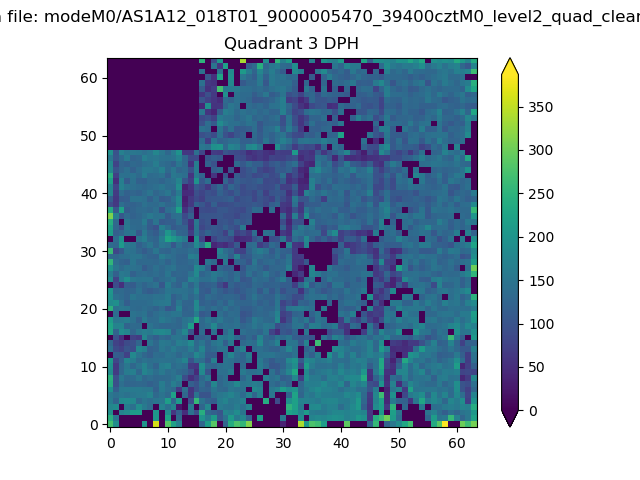 |
 |
Quadrant C |
| Plot type | Count rate plots | Images |
|---|---|---|
| Comparison with Poisson distribution Blue bars denote a histogram of data divided into 1 sec bins. Red curve is a Poisson curve with rate = median count rate of data. |
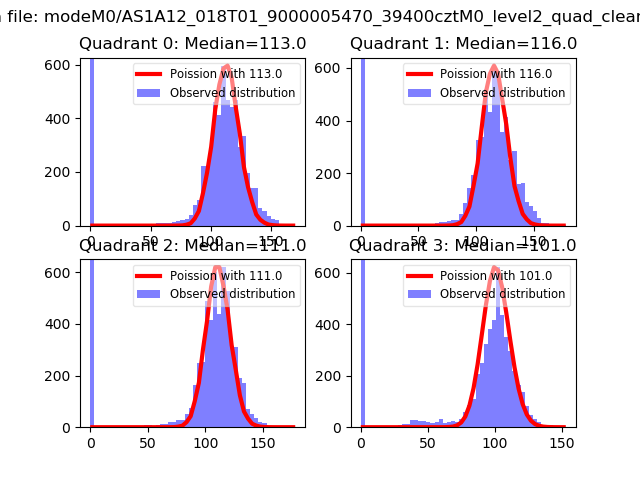 |
 |
| Quadrant-wise count rates Data is divided into 100 sec bins |
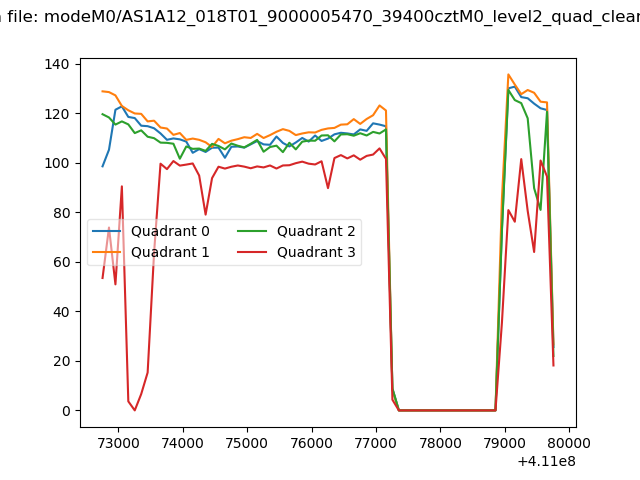 |
|
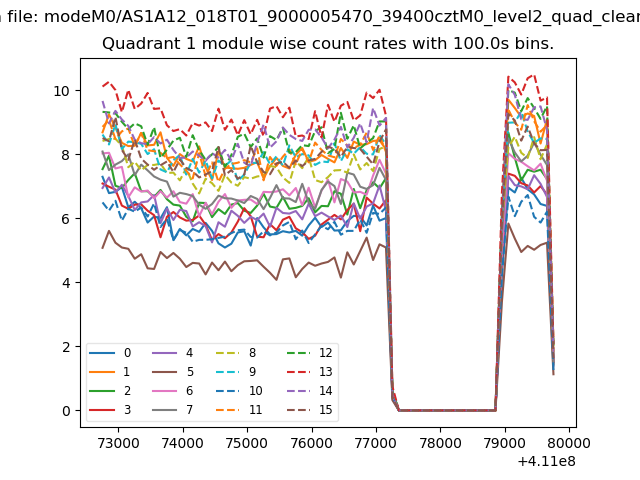
| Module-wise count rates for Quadrant A Data is divided into 100 sec bins |
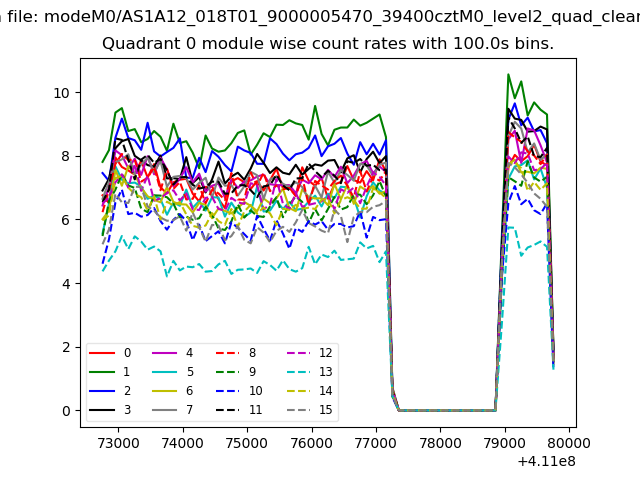 |
 |
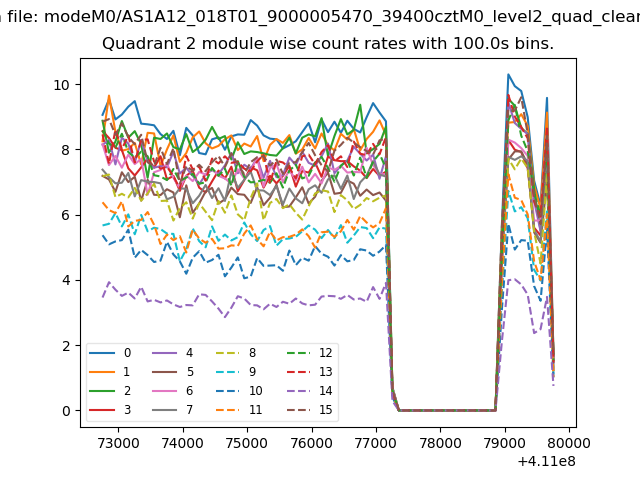
| Module-wise count rates for Quadrant B Data is divided into 100 sec bins |
 |
 |
| Module-wise count rates for Quadrant C Data is divided into 100 sec bins |
 |
 |
| Module-wise count rates for Quadrant D Data is divided into 100 sec bins |
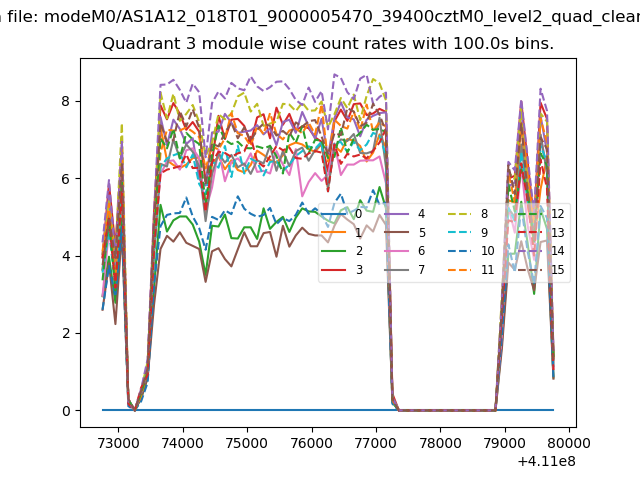 |
 |
| Parameter | Plot |
|---|---|
| CZT HV Monitor | 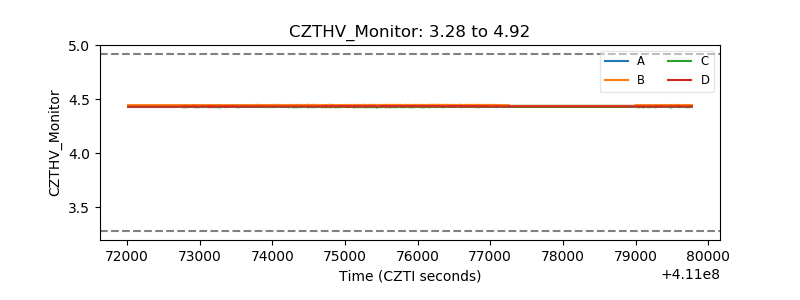 |
| D_VDD | 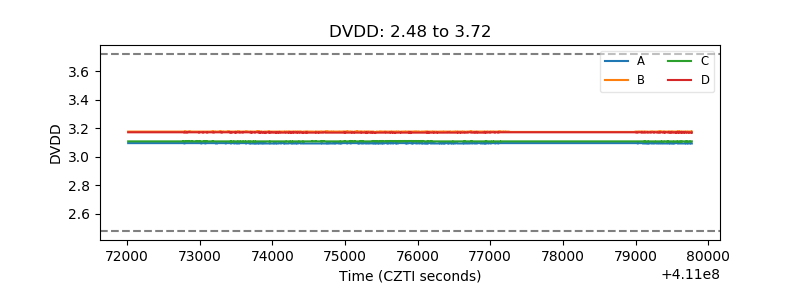 |
| Temperature 1 | 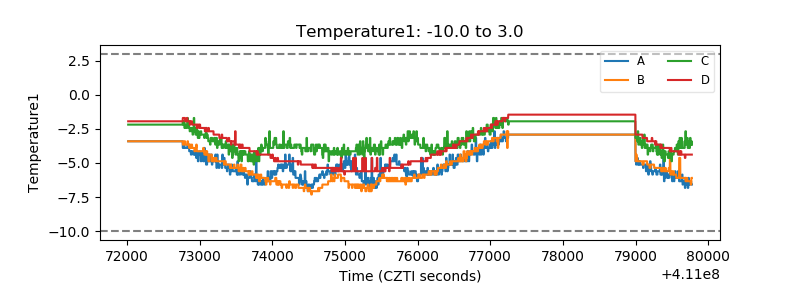 |
| Veto HV Monitor | 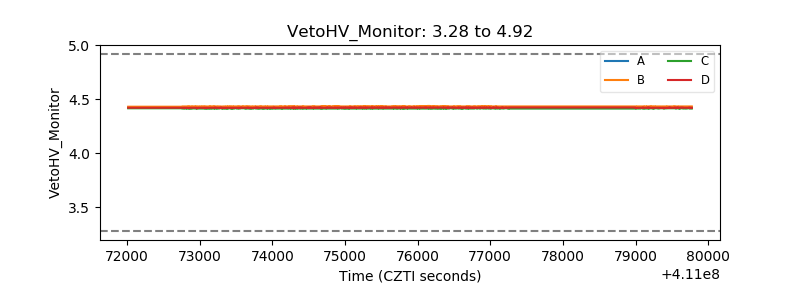 |
| Veto LLD | 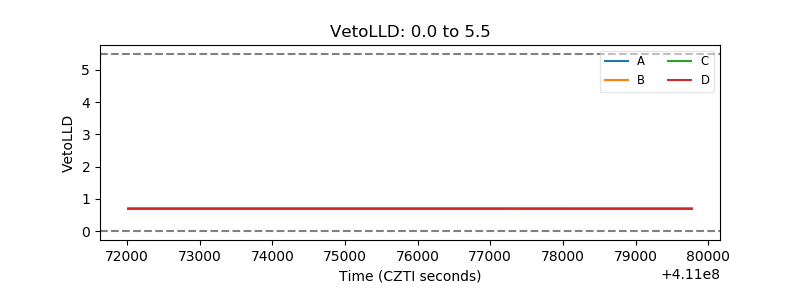 |
| Alpha Counter | 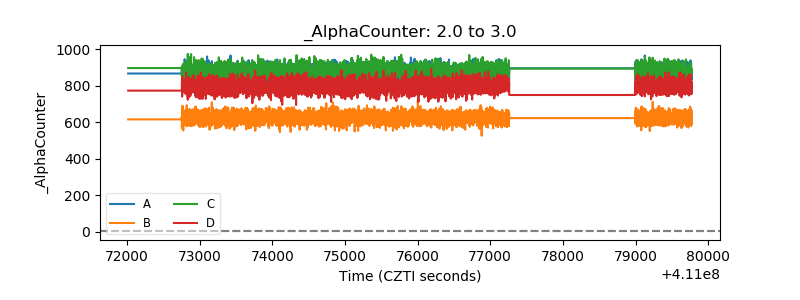 |
| _CPM_Rate | 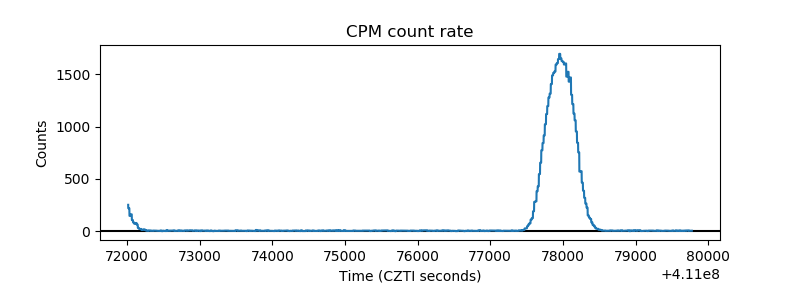 |
| CZT Counter | 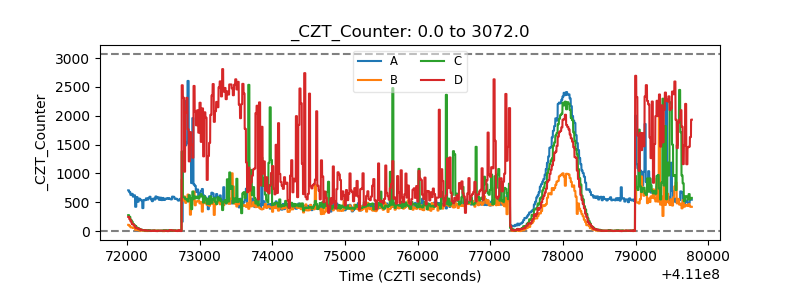 |
| +2.5 Volts monitor | 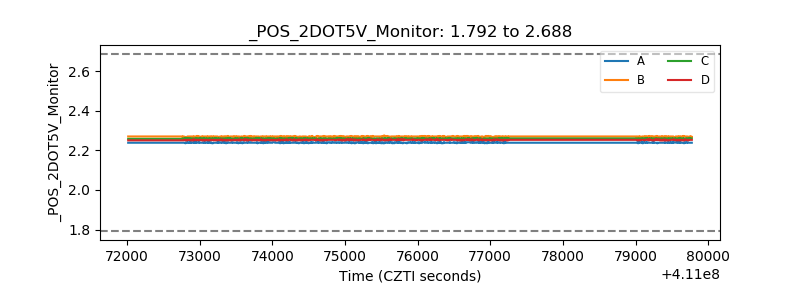 |
| +5 Volts monitor | 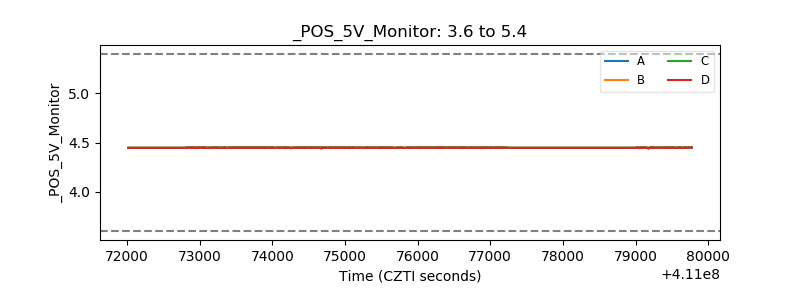 |
| _ROLL_ROT | 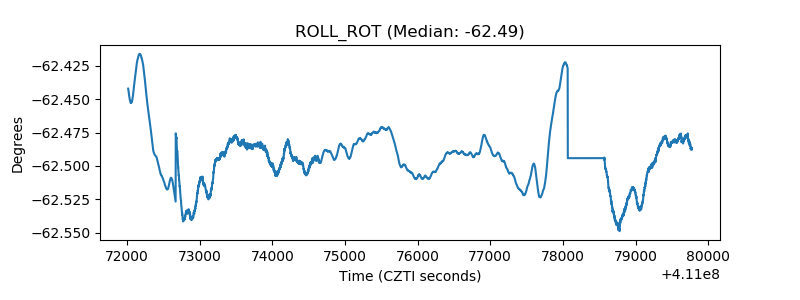 |
| _Roll_DEC | 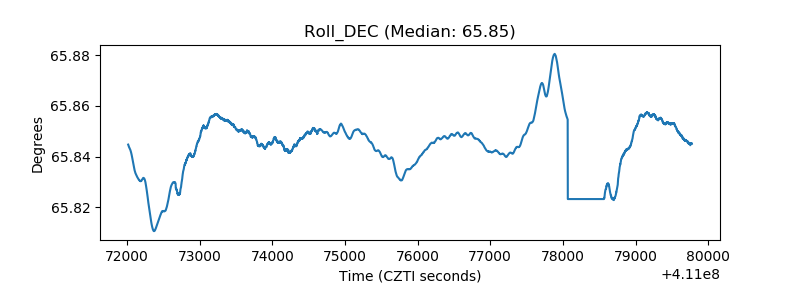 |
| _Roll_RA | 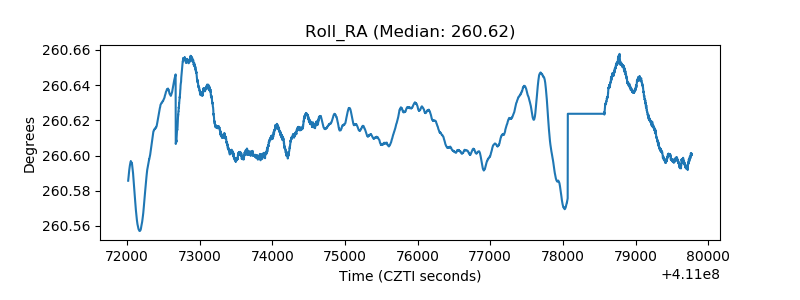 |
| Veto Counter | 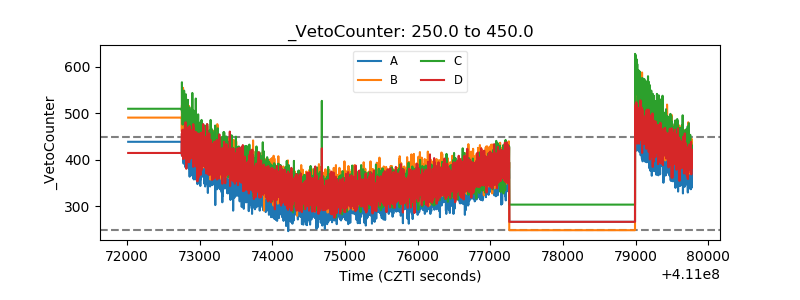 |