| Param | Original file | Final file |
|---|---|---|
| Filename | modeM0/AS1A12_018T01_9000005470_39401cztM0_level2.fits | modeM0/AS1A12_018T01_9000005470_39401cztM0_level2_quad_clean.evt |
| Size (bytes) | 422,562,240 | 89,982,720 |
| Size | 403.0 MB | 85.8 MB |
| Events in quadrant A | 3,015,536 | 613,659 |
| Events in quadrant B | 2,493,877 | 638,849 |
| Events in quadrant C | 3,060,390 | 603,342 |
| Events in quadrant D | 6,664,352 | 501,440 |
| Mode M9 | |||
|---|---|---|---|
| Quadrant | BADHDUFLAG | Total packets | Discarded packets |
| A | 0 | 22 | 0 |
| B | 0 | 22 | 0 |
| C | 0 | 22 | 0 |
| D | 0 | 23 | 0 |
| Mode SS | |||
|---|---|---|---|
| Quadrant | BADHDUFLAG | Total packets | Discarded packets |
| A | 0 | 106 | 0 |
| B | 0 | 106 | 0 |
| C | 0 | 106 | 0 |
| D | 0 | 106 | 0 |
| Mode M0 | |||
|---|---|---|---|
| Quadrant | BADHDUFLAG | Total packets | Discarded packets |
| A | 0 | 12277 | 3 |
| B | 0 | 11009 | 2 |
| C | 0 | 12619 | 2 |
| D | 0 | 23494 | 2 |
| Quadrant | Total seconds | Saturated seconds | Saturation percentage |
|---|---|---|---|
| A | 5248 | 53 | 1.009909% |
| B | 5248 | 15 | 0.285823% |
| C | 5248 | 103 | 1.962652% |
| D | 5248 | 777 | 14.805640% |
Noise dominated data is calculated using 1-second bins in cleaned event files. If a bin has >2000 counts, and if more than 50% of those come from <1% of pixels, then it is considered to be noise-dominated and hence unusable.
| Quadrant | # 1 sec bins | Bins with >0 counts | Bins with >2000 counts | High rate bins dominated by noise | Noise dominated (total time) | Noise dominated (detector-on time) | Marked lightcurve |
|---|---|---|---|---|---|---|---|
| A | 7101 | 5249 | 35 | 35 | 0.49% | 0.67% | 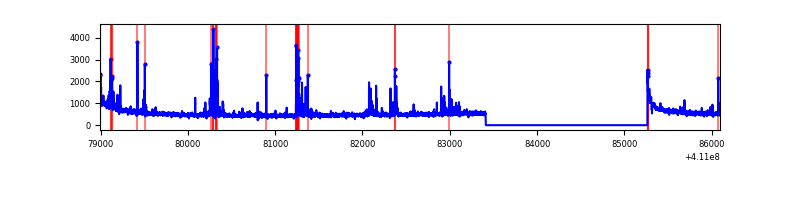 |
| B | 7101 | 5249 | 8 | 8 | 0.11% | 0.15% | 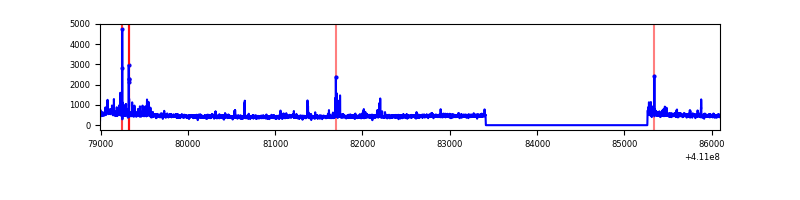 |
| C | 7101 | 5249 | 69 | 69 | 0.97% | 1.31% |  |
| D | 7101 | 5249 | 723 | 723 | 10.18% | 13.77% | 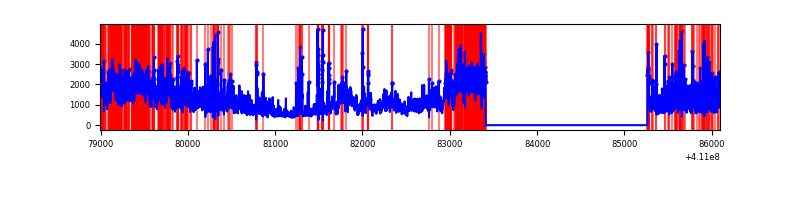 |
Top three noisy pixels from each quadrant. If the there are fewer than three noisy pixels in the level2.evt file, extra rows are filled as -1
| Pixel properties | Quadrant properties | ||||||
|---|---|---|---|---|---|---|---|
| Quadrant | DetID | PixID | Counts | Sigma | Mean | Median | Sigma |
| A | 10 | 83 | 419379 | 3496.21 | 588 | 577 | 119.8 |
| A | 13 | 248 | 273796 | 2280.87 | 588 | 577 | 119.8 |
| A | 2 | 79 | 30367 | 248.69 | 588 | 577 | 119.8 |
| B | 5 | 172 | 136545 | 1200.27 | 589 | 575 | 113.3 |
| B | 0 | 230 | 16465 | 140.27 | 589 | 575 | 113.3 |
| B | 12 | 111 | 14127 | 119.63 | 589 | 575 | 113.3 |
| C | 9 | 187 | 309758 | 2303.42 | 576 | 580 | 134.2 |
| C | 14 | 254 | 266896 | 1984.09 | 576 | 580 | 134.2 |
| C | 15 | 214 | 221857 | 1648.54 | 576 | 580 | 134.2 |
| D | 12 | 235 | 4051343 | 30193.2 | 550 | 536 | 134.2 |
| D | 13 | 249 | 353513 | 2630.96 | 550 | 536 | 134.2 |
| D | 2 | 249 | 98185 | 727.84 | 550 | 536 | 134.2 |
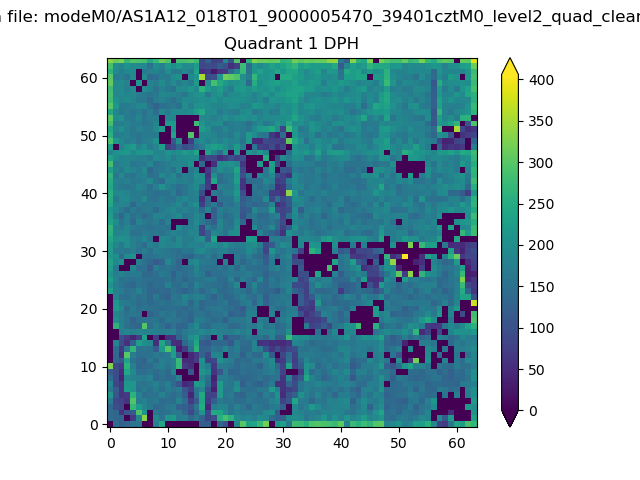
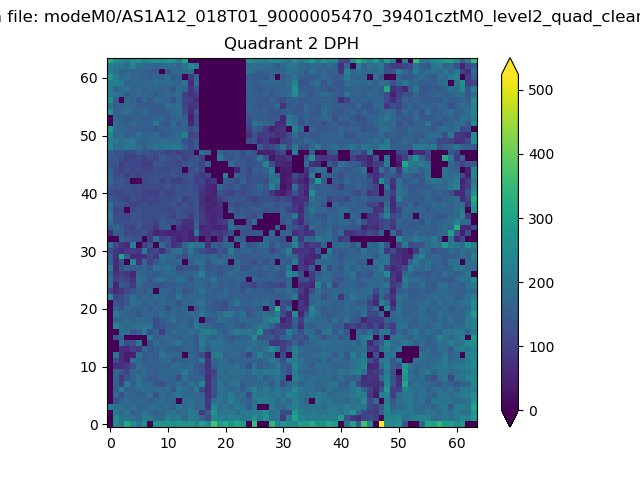
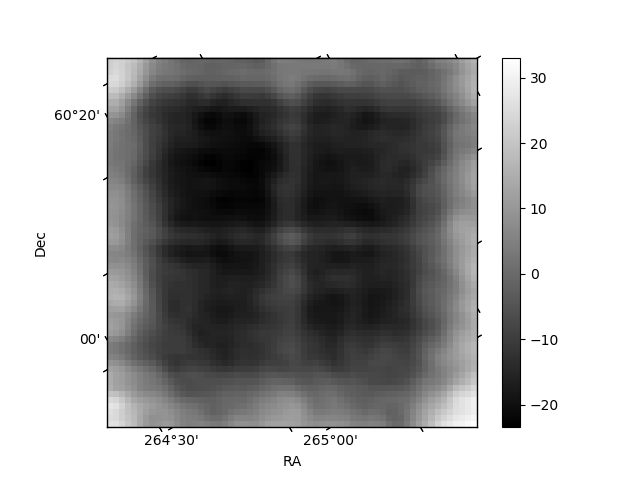
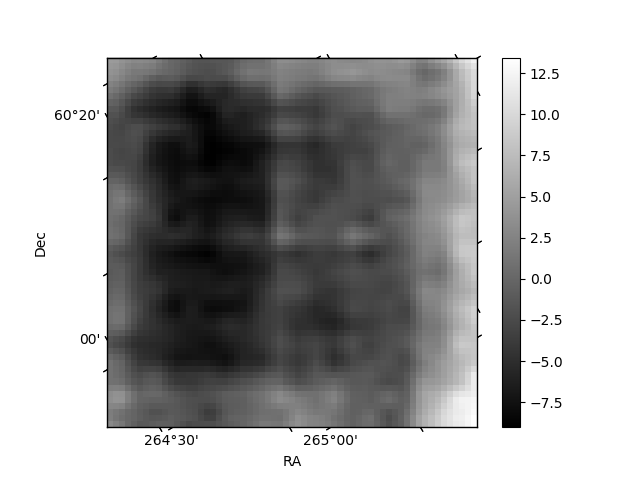
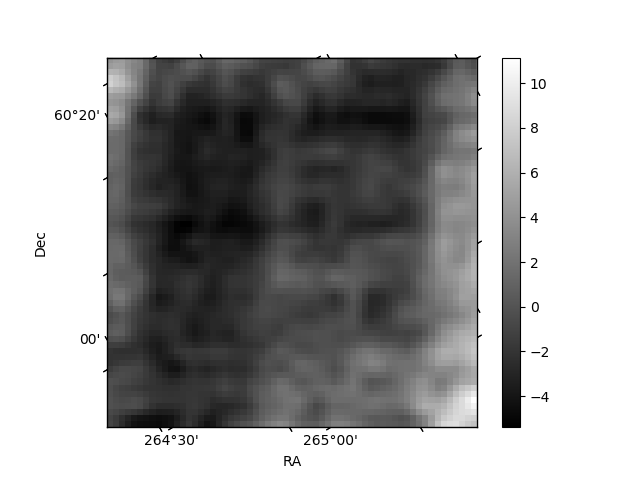
Histogram calculated using DETX and DETY for each event in the final _common_clean file
| Quadrant A | 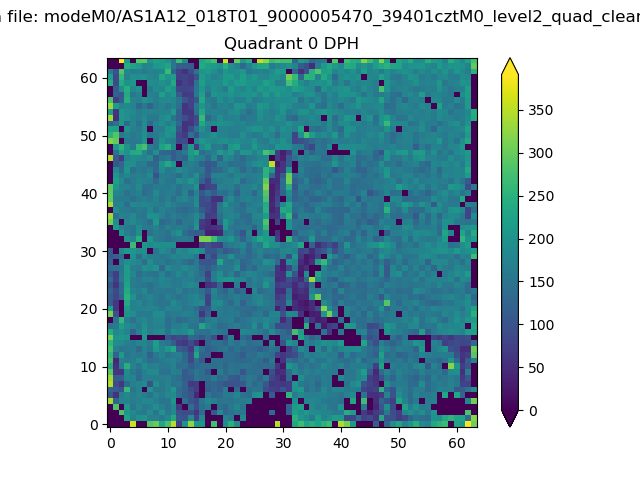 |
 |
Quadrant B |
|---|---|---|---|
| Quadrant D | 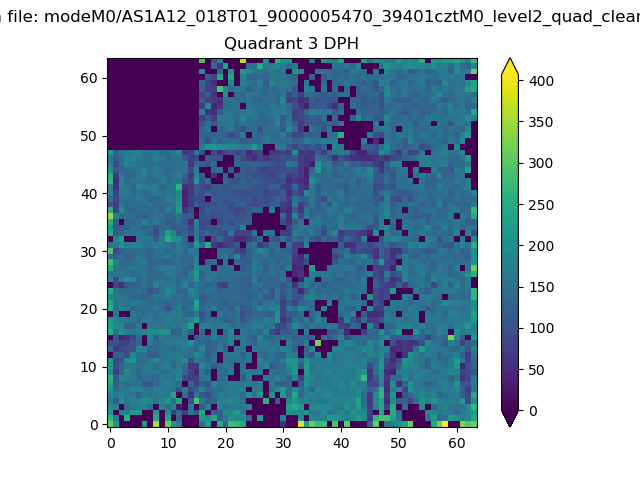 |
 |
Quadrant C |
| Plot type | Count rate plots | Images |
|---|---|---|
| Comparison with Poisson distribution Blue bars denote a histogram of data divided into 1 sec bins. Red curve is a Poisson curve with rate = median count rate of data. |
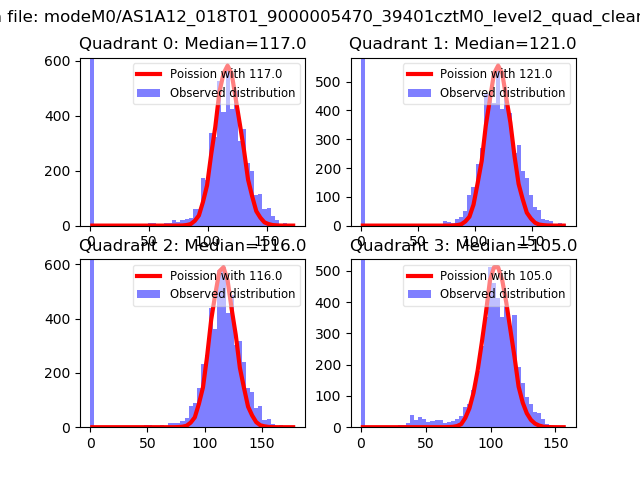 |
 |
| Quadrant-wise count rates Data is divided into 100 sec bins |
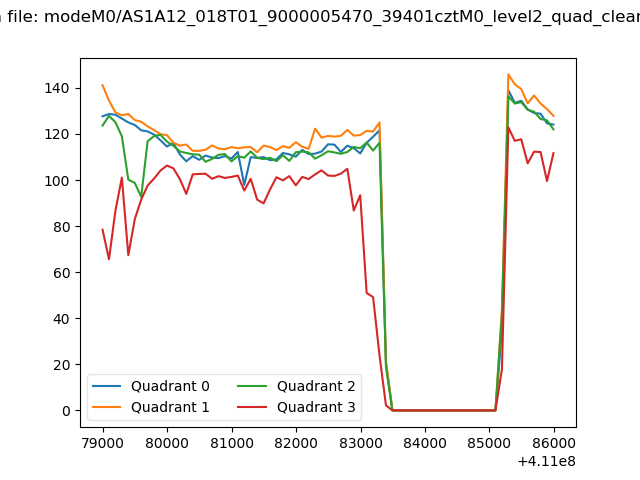 |
|
| Module-wise count rates for Quadrant A Data is divided into 100 sec bins |
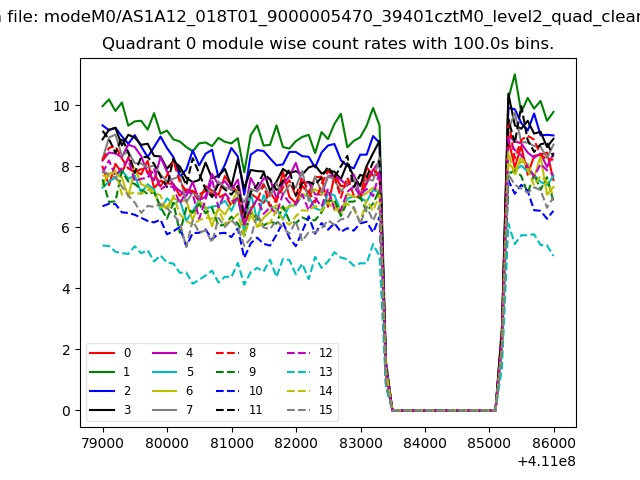 |
 |
| Module-wise count rates for Quadrant B Data is divided into 100 sec bins |
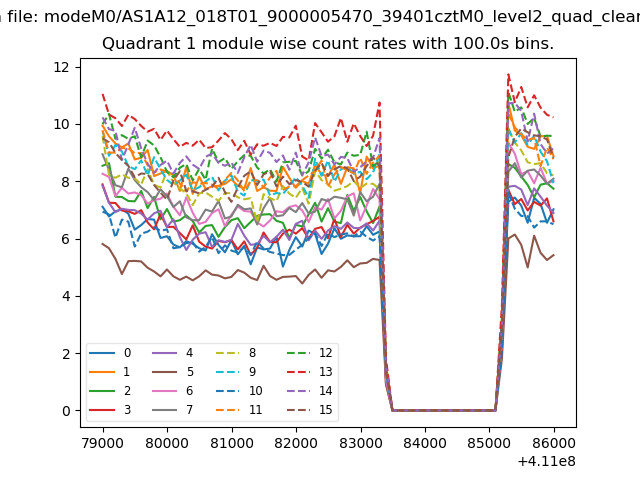 |
 |
| Module-wise count rates for Quadrant C Data is divided into 100 sec bins |
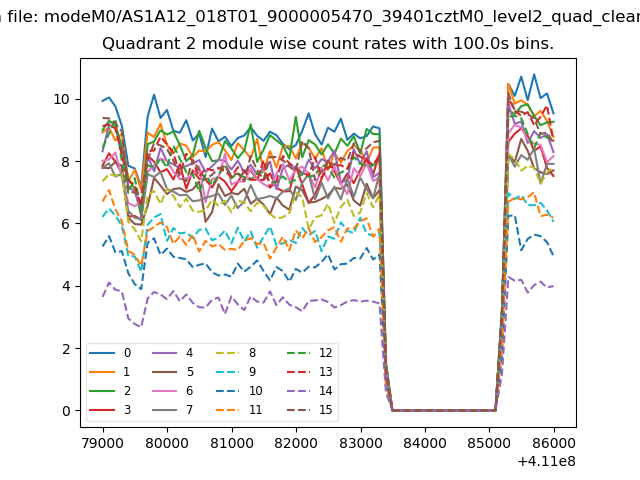 |
 |
| Module-wise count rates for Quadrant D Data is divided into 100 sec bins |
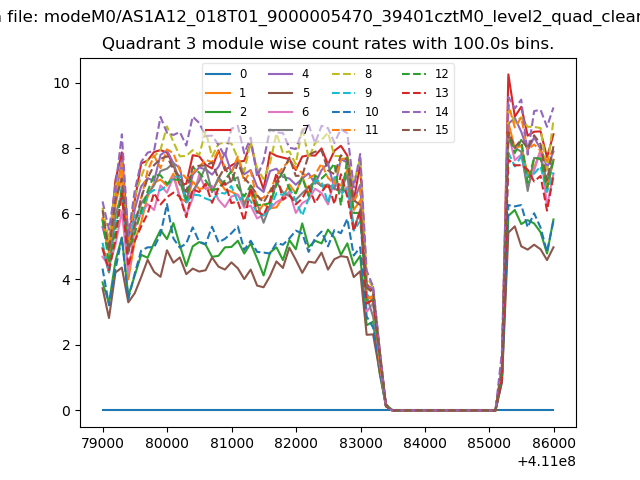 |
 |
| Parameter | Plot |
|---|---|
| CZT HV Monitor | 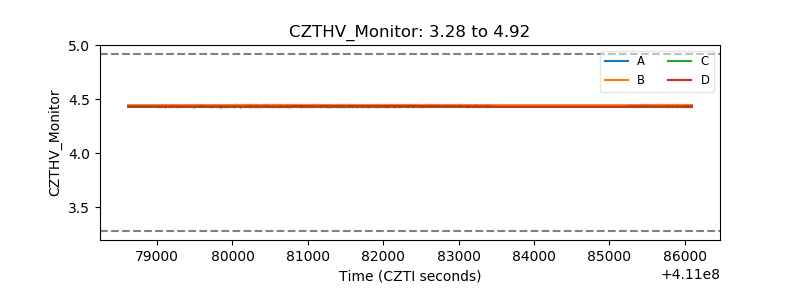 |
| D_VDD | 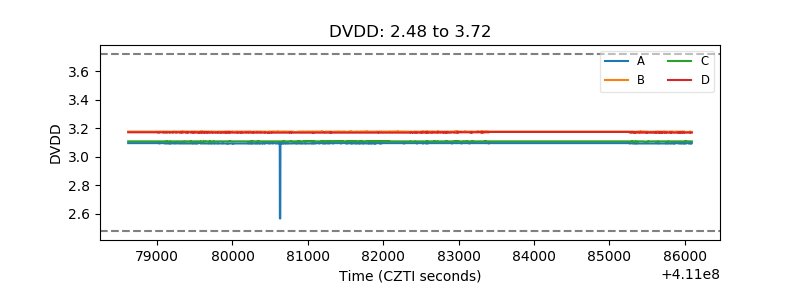 |
| Temperature 1 | 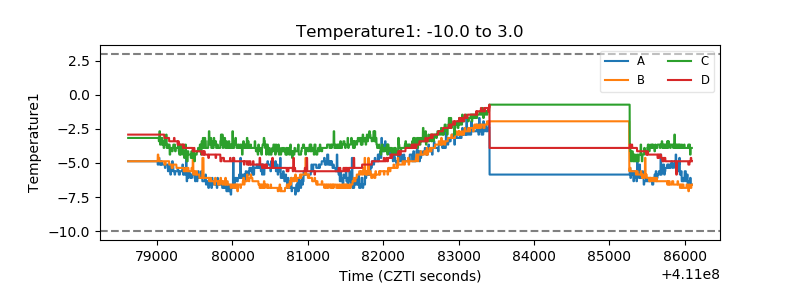 |
| Veto HV Monitor | 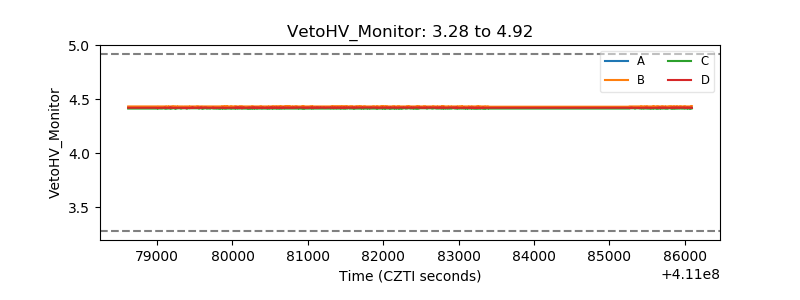 |
| Veto LLD | 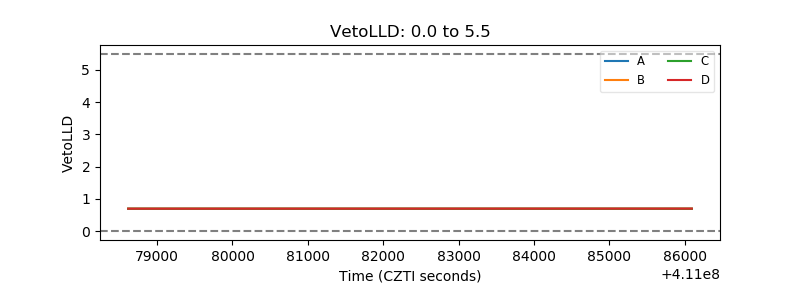 |
| Alpha Counter | 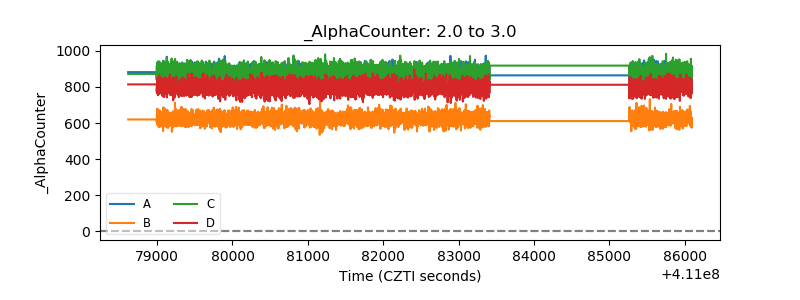 |
| _CPM_Rate | 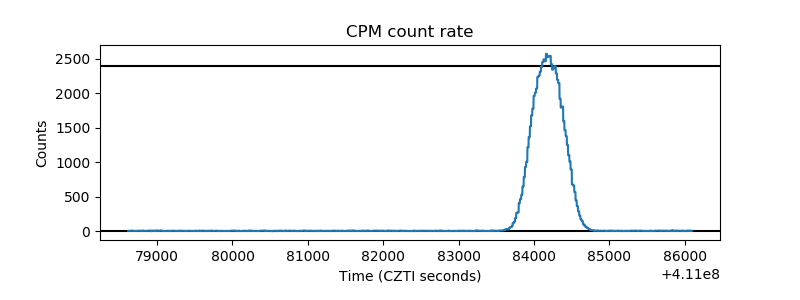 |
| CZT Counter | 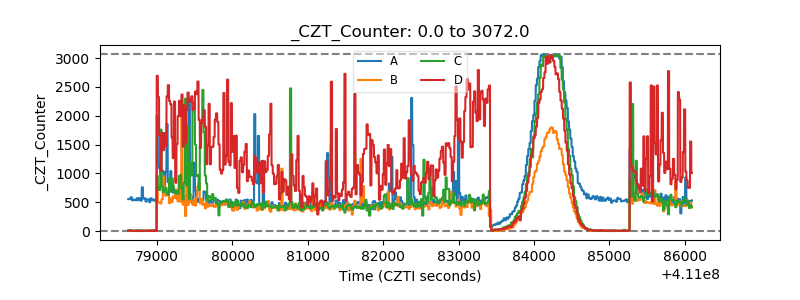 |
| +2.5 Volts monitor | 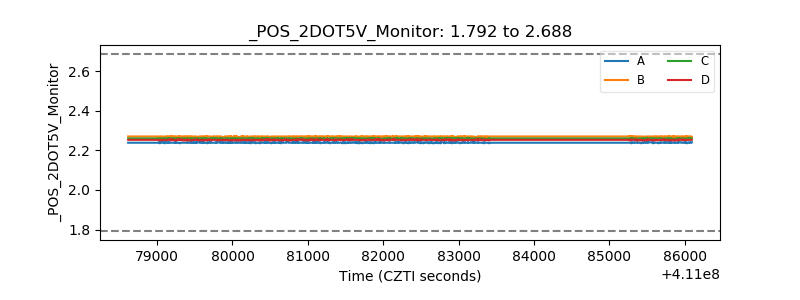 |
| +5 Volts monitor | 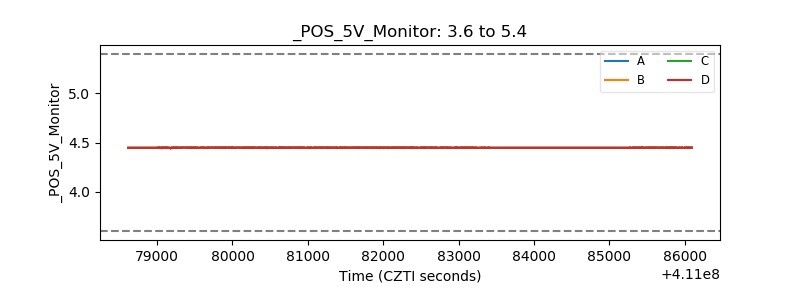 |
| _ROLL_ROT | 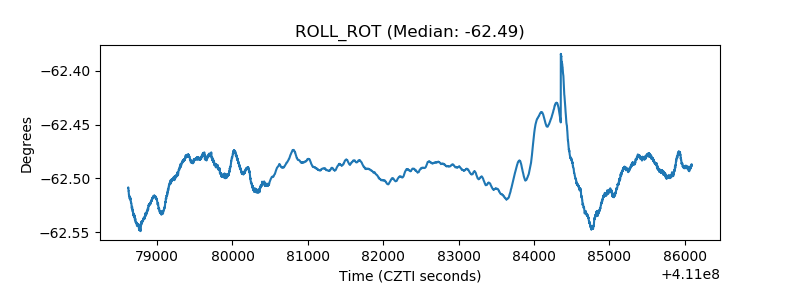 |
| _Roll_DEC | 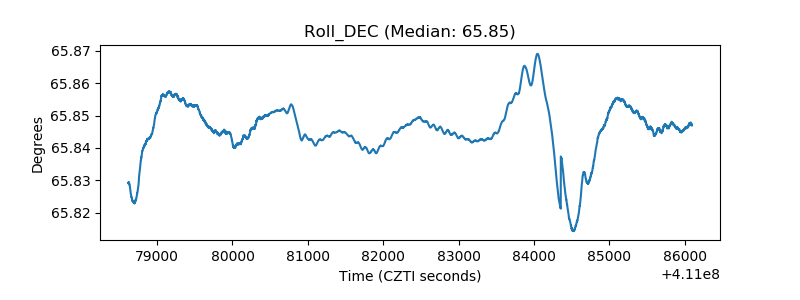 |
| _Roll_RA | 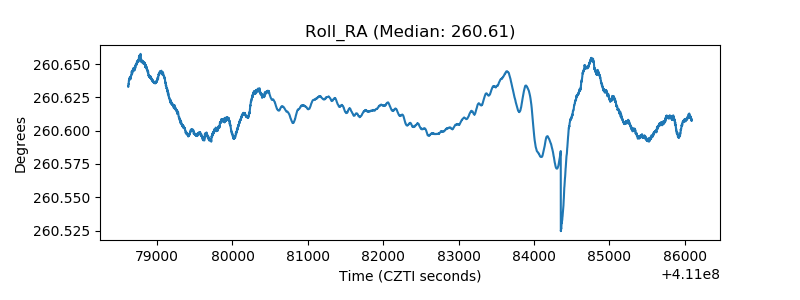 |
| Veto Counter | 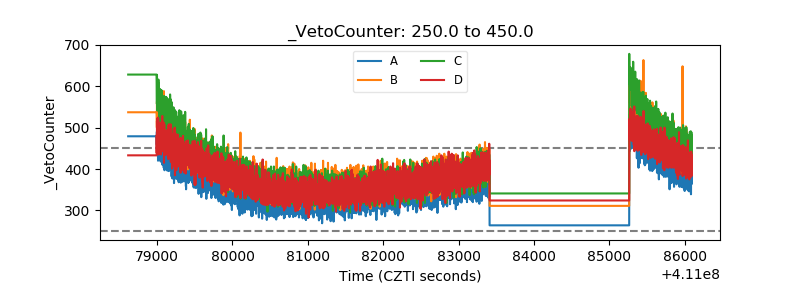 |