| Param | Original file | Final file |
|---|---|---|
| Filename | modeM0/AS1A12_018T01_9000005470_39402cztM0_level2.fits | modeM0/AS1A12_018T01_9000005470_39402cztM0_level2_quad_clean.evt |
| Size (bytes) | 427,273,920 | 89,962,560 |
| Size | 407.5 MB | 85.8 MB |
| Events in quadrant A | 3,517,805 | 607,683 |
| Events in quadrant B | 2,407,637 | 654,879 |
| Events in quadrant C | 2,529,009 | 624,197 |
| Events in quadrant D | 6,960,784 | 476,192 |
| Mode M9 | |||
|---|---|---|---|
| Quadrant | BADHDUFLAG | Total packets | Discarded packets |
| A | 0 | 32 | 0 |
| B | 0 | 32 | 0 |
| C | 0 | 32 | 0 |
| D | 0 | 33 | 0 |
| Mode SS | |||
|---|---|---|---|
| Quadrant | BADHDUFLAG | Total packets | Discarded packets |
| A | 0 | 104 | 0 |
| B | 0 | 104 | 0 |
| C | 0 | 104 | 0 |
| D | 0 | 104 | 0 |
| Mode M0 | |||
|---|---|---|---|
| Quadrant | BADHDUFLAG | Total packets | Discarded packets |
| A | 0 | 13773 | 3 |
| B | 0 | 10561 | 2 |
| C | 0 | 10785 | 2 |
| D | 0 | 24252 | 2 |
| Quadrant | Total seconds | Saturated seconds | Saturation percentage |
|---|---|---|---|
| A | 5158 | 259 | 5.021326% |
| B | 5158 | 9 | 0.174486% |
| C | 5158 | 3 | 0.058162% |
| D | 5158 | 1108 | 21.481194% |
Noise dominated data is calculated using 1-second bins in cleaned event files. If a bin has >2000 counts, and if more than 50% of those come from <1% of pixels, then it is considered to be noise-dominated and hence unusable.
| Quadrant | # 1 sec bins | Bins with >0 counts | Bins with >2000 counts | High rate bins dominated by noise | Noise dominated (total time) | Noise dominated (detector-on time) | Marked lightcurve |
|---|---|---|---|---|---|---|---|
| A | 7131 | 5159 | 190 | 190 | 2.66% | 3.68% | 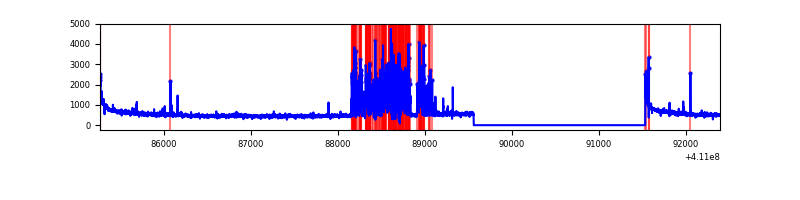 |
| B | 7131 | 5159 | 2 | 2 | 0.03% | 0.04% | 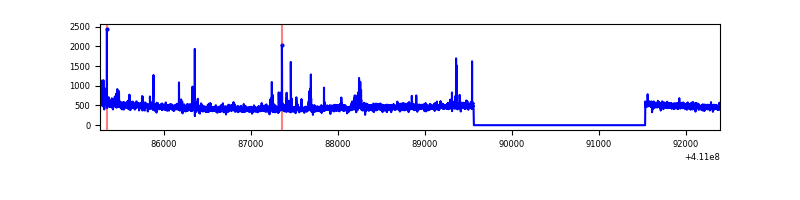 |
| C | 7131 | 5159 | 1 | 1 | 0.01% | 0.02% | 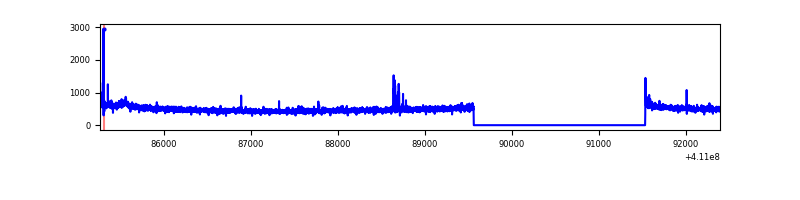 |
| D | 7131 | 5159 | 1004 | 1004 | 14.08% | 19.46% | 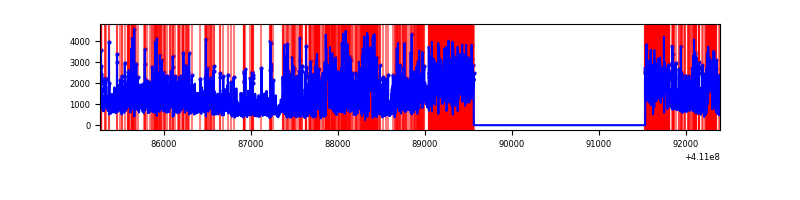 |
Top three noisy pixels from each quadrant. If the there are fewer than three noisy pixels in the level2.evt file, extra rows are filled as -1
| Pixel properties | Quadrant properties | ||||||
|---|---|---|---|---|---|---|---|
| Quadrant | DetID | PixID | Counts | Sigma | Mean | Median | Sigma |
| A | 13 | 248 | 852711 | 7235.02 | 577 | 566 | 117.8 |
| A | 10 | 83 | 405837 | 3440.9 | 577 | 566 | 117.8 |
| A | 13 | 6 | 10417 | 83.64 | 577 | 566 | 117.8 |
| B | 5 | 172 | 67649 | 595.63 | 588 | 573 | 112.6 |
| B | 5 | 255 | 17582 | 151.04 | 588 | 573 | 112.6 |
| B | 12 | 111 | 14131 | 120.39 | 588 | 573 | 112.6 |
| C | 15 | 214 | 219135 | 1648.38 | 577 | 583 | 132.6 |
| C | 9 | 187 | 28043 | 207.11 | 577 | 583 | 132.6 |
| C | 7 | 220 | 15016 | 108.86 | 577 | 583 | 132.6 |
| D | 12 | 235 | 3694650 | 29161.97 | 520 | 505 | 126.7 |
| D | 13 | 249 | 1008098 | 7954.04 | 520 | 505 | 126.7 |
| D | 2 | 249 | 209940 | 1653.3 | 520 | 505 | 126.7 |
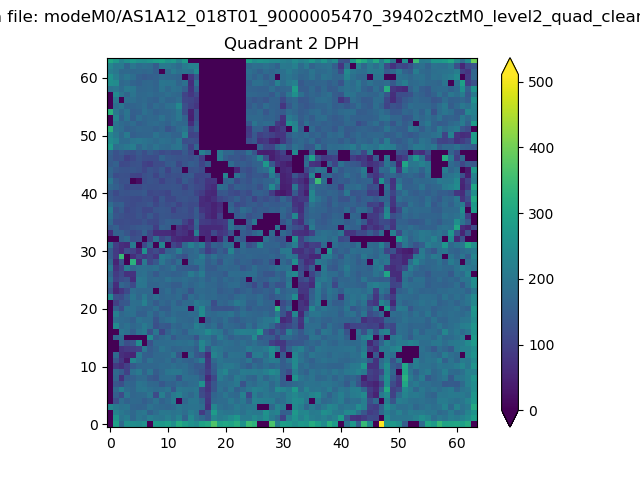
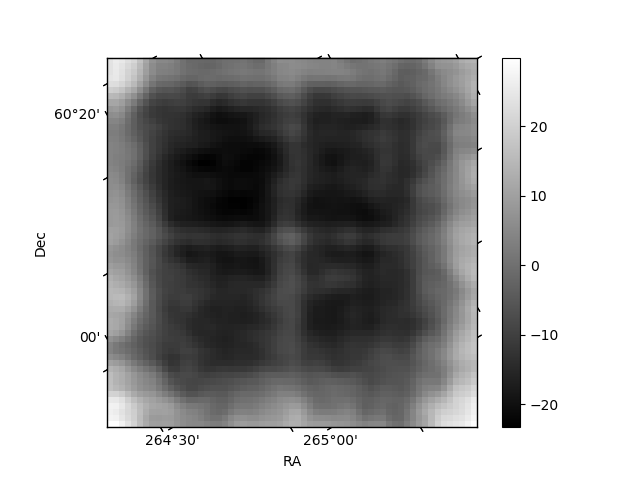
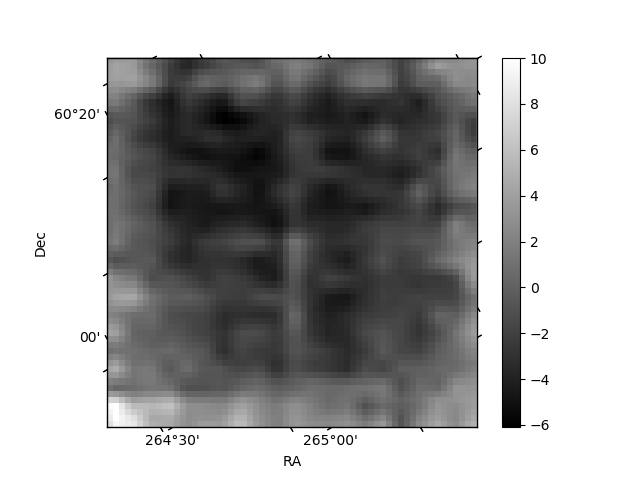
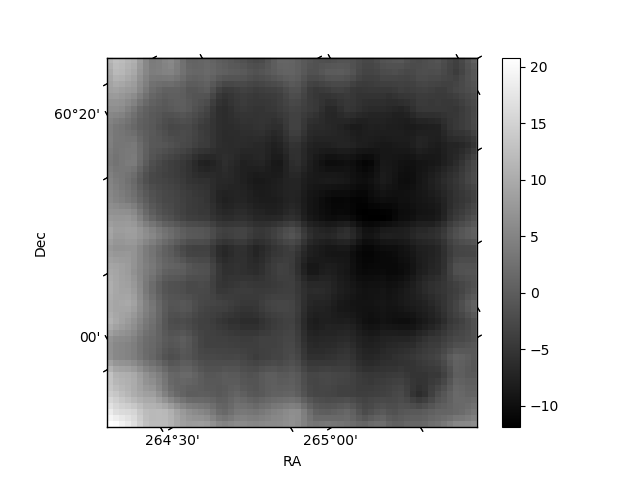
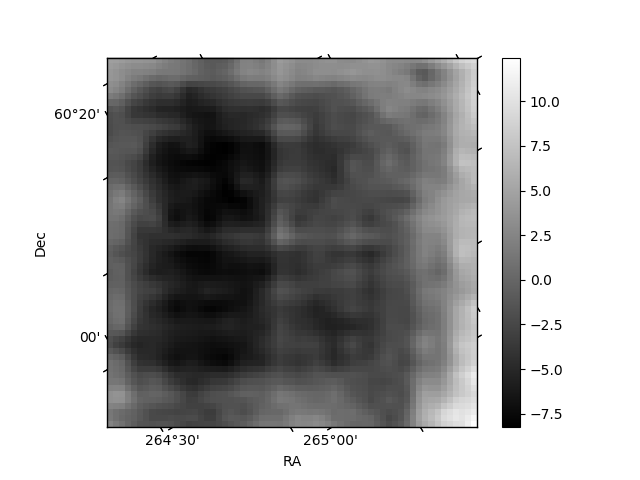
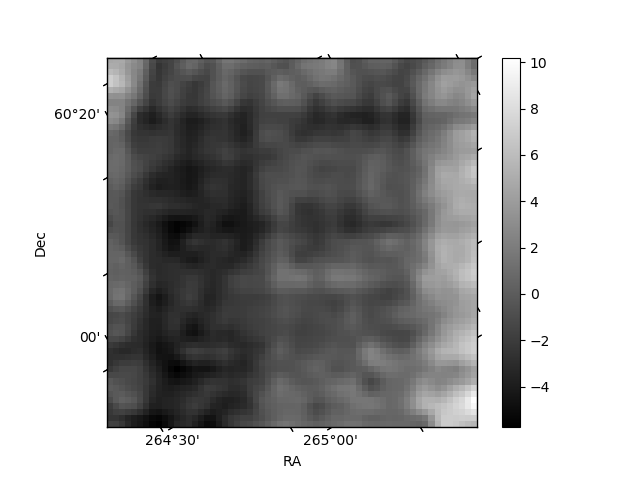
Histogram calculated using DETX and DETY for each event in the final _common_clean file
| Quadrant A | 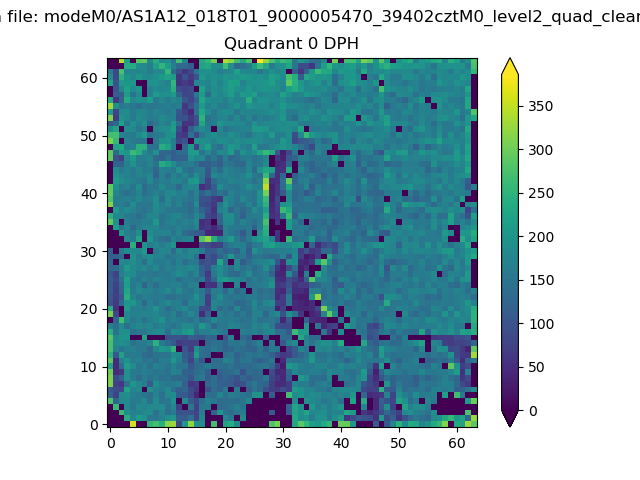 |
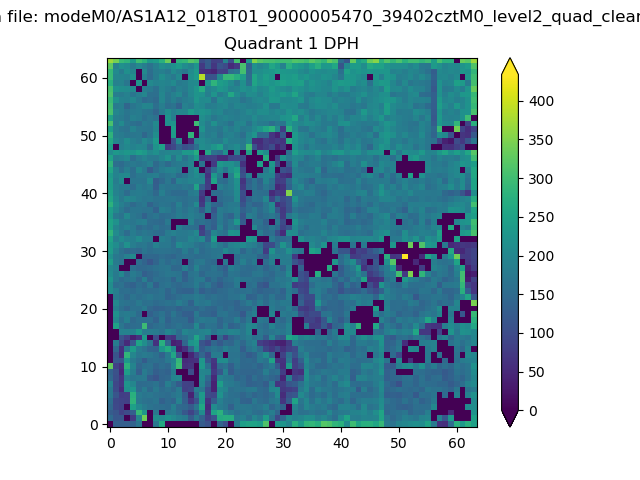 |
Quadrant B |
|---|---|---|---|
| Quadrant D | 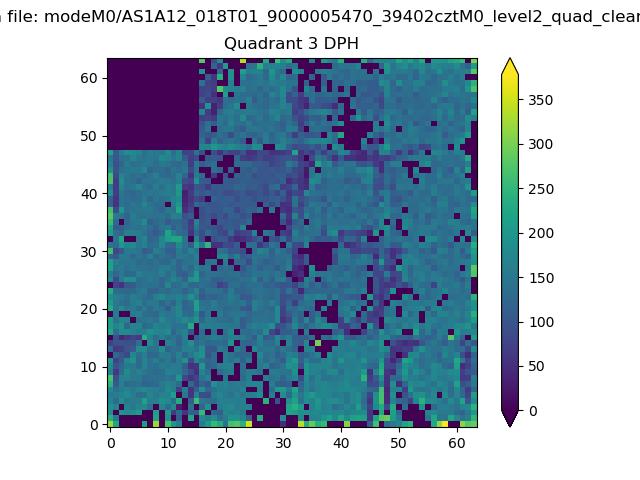 |
 |
Quadrant C |
| Plot type | Count rate plots | Images |
|---|---|---|
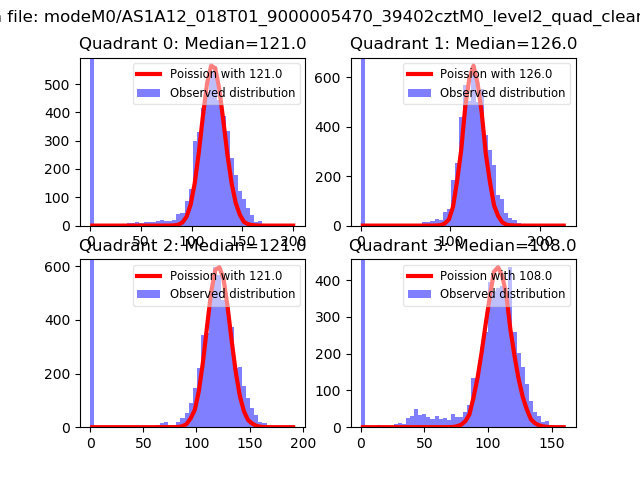
| Comparison with Poisson distribution Blue bars denote a histogram of data divided into 1 sec bins. Red curve is a Poisson curve with rate = median count rate of data. |
 |
 |
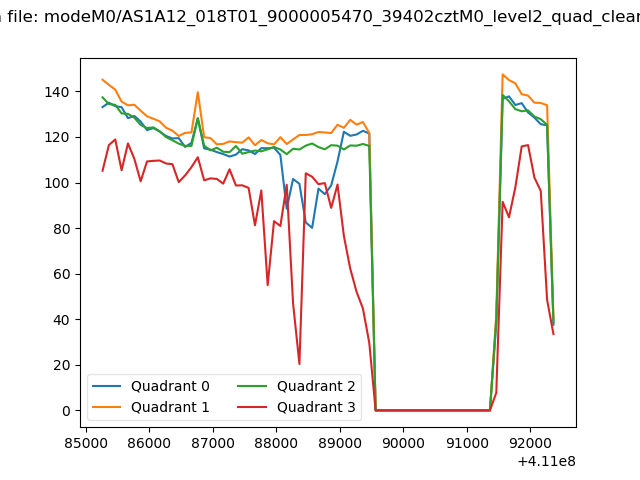
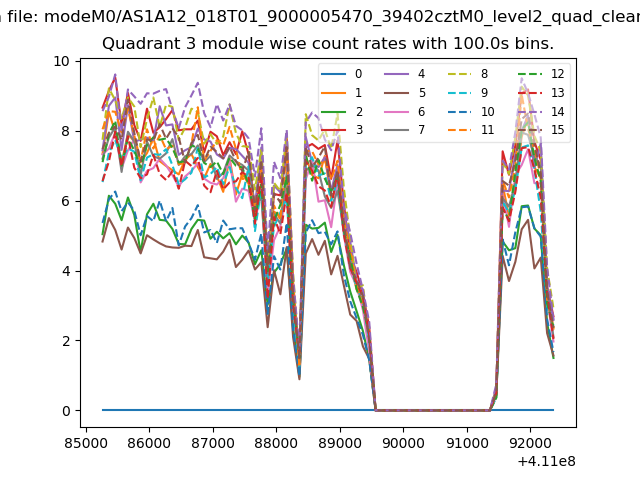
| Quadrant-wise count rates Data is divided into 100 sec bins |
 |
|
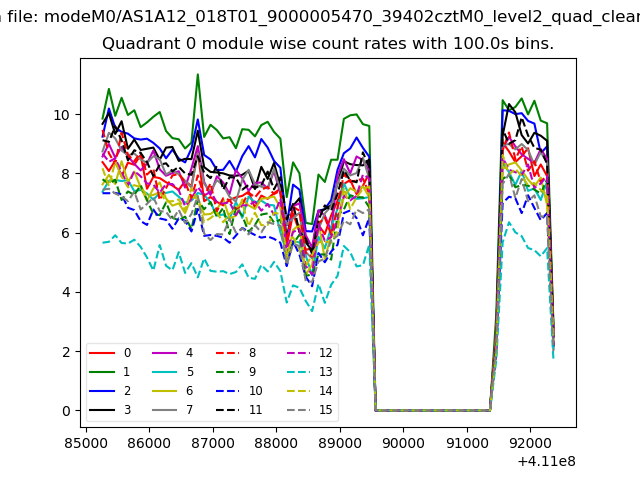
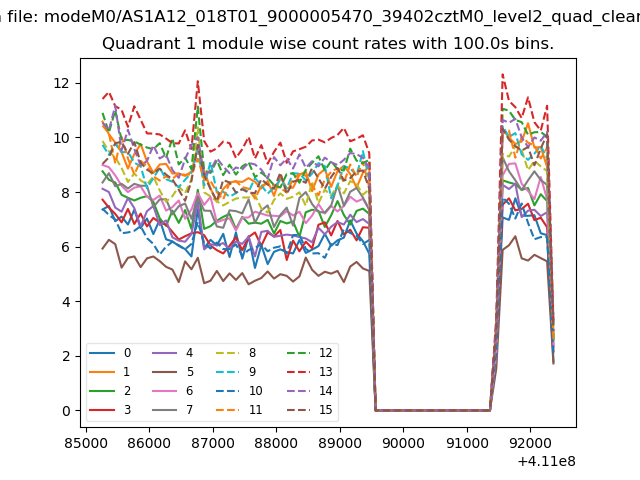
| Module-wise count rates for Quadrant A Data is divided into 100 sec bins |
 |
 |
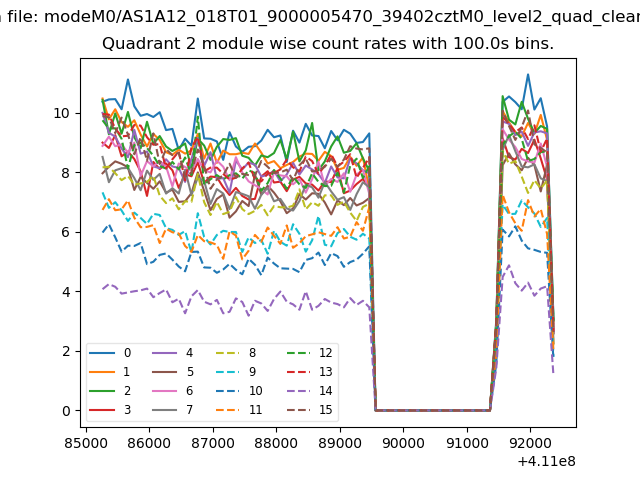
| Module-wise count rates for Quadrant B Data is divided into 100 sec bins |
 |
 |
| Module-wise count rates for Quadrant C Data is divided into 100 sec bins |
 |
 |
| Module-wise count rates for Quadrant D Data is divided into 100 sec bins |
 |
 |
| Parameter | Plot |
|---|---|
| CZT HV Monitor | 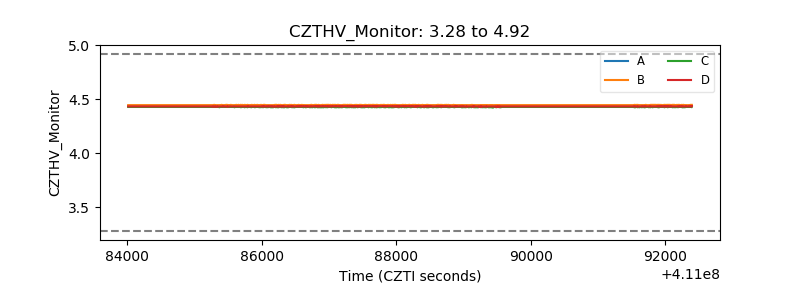 |
| D_VDD | 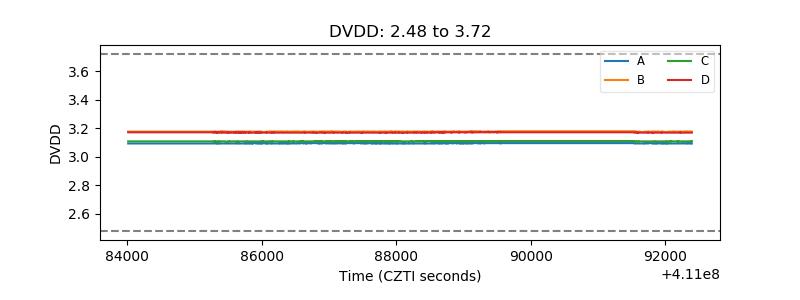 |
| Temperature 1 | 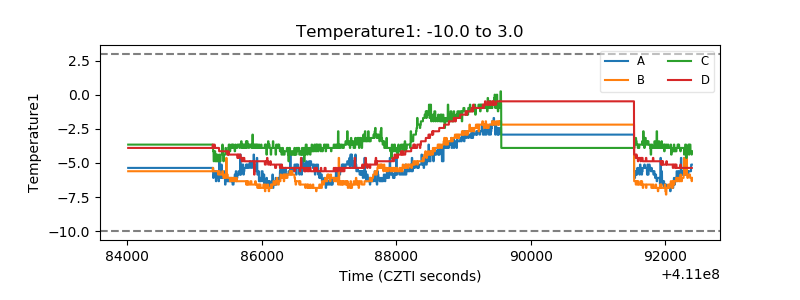 |
| Veto HV Monitor | 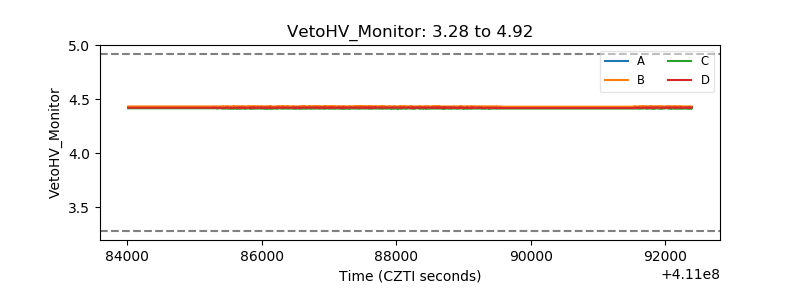 |
| Veto LLD | 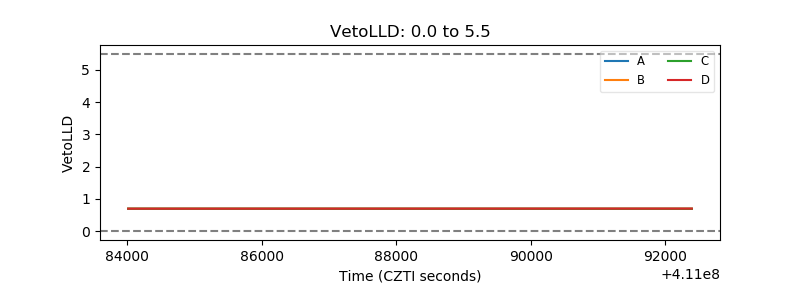 |
| Alpha Counter | 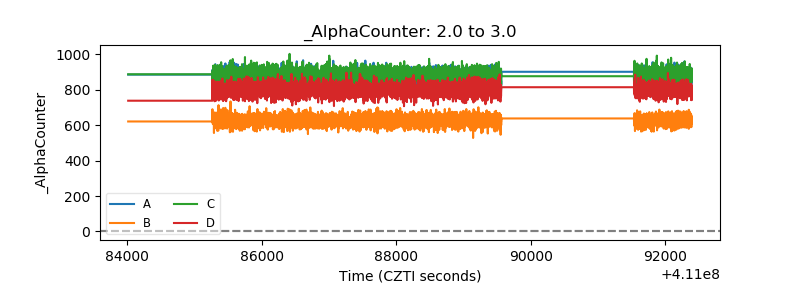 |
| _CPM_Rate | 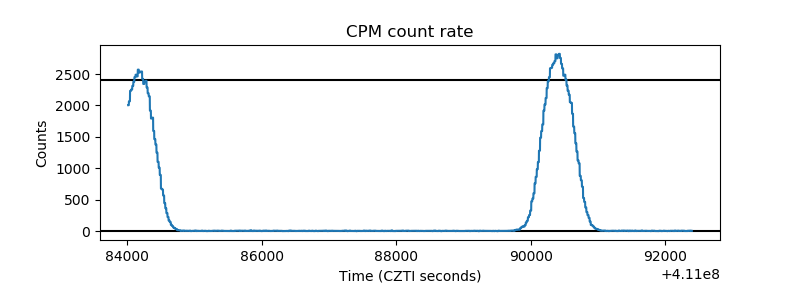 |
| CZT Counter | 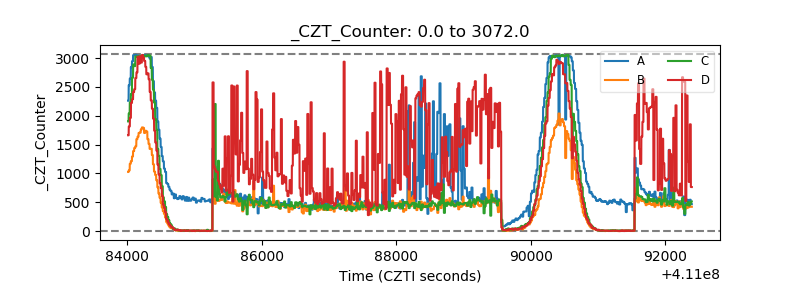 |
| +2.5 Volts monitor | 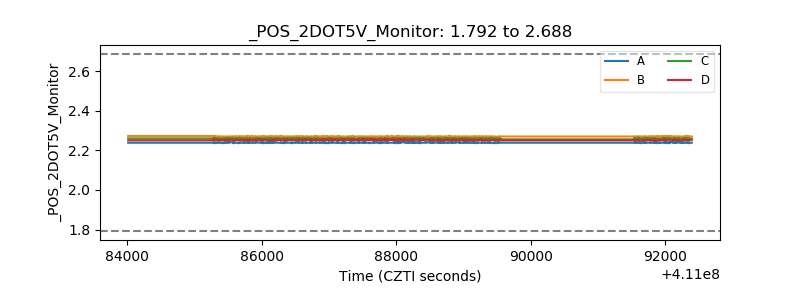 |
| +5 Volts monitor | 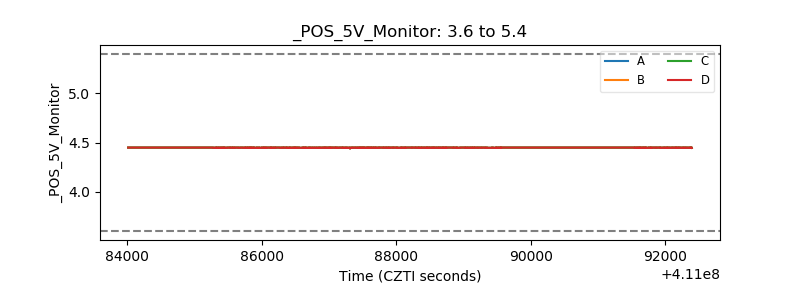 |
| _ROLL_ROT | 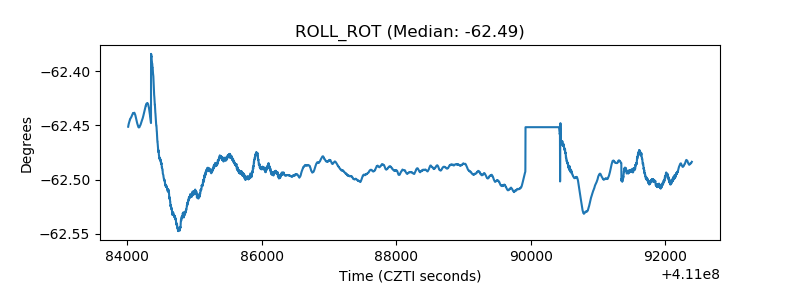 |
| _Roll_DEC | 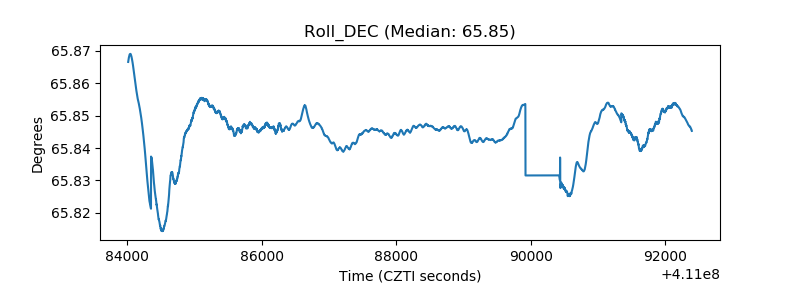 |
| _Roll_RA | 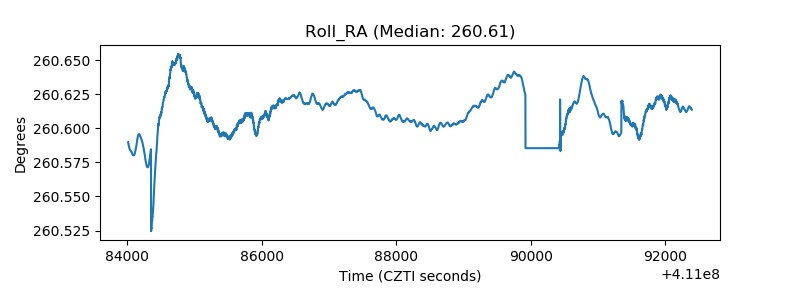 |
| Veto Counter | 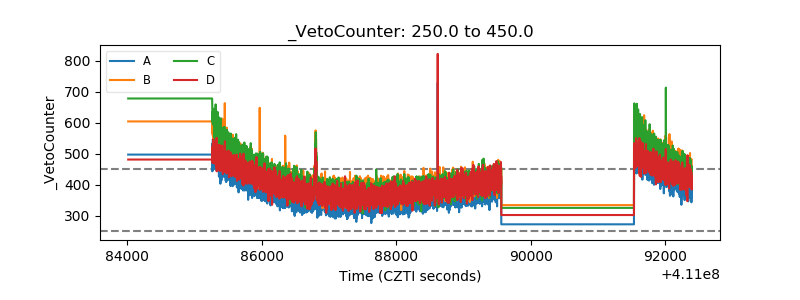 |