| Param | Original file | Final file |
|---|---|---|
| Filename | modeM0/AS1A12_018T01_9000005470_39403cztM0_level2.fits | modeM0/AS1A12_018T01_9000005470_39403cztM0_level2_quad_clean.evt |
| Size (bytes) | 466,436,160 | 89,648,640 |
| Size | 444.8 MB | 85.5 MB |
| Events in quadrant A | 2,981,347 | 634,999 |
| Events in quadrant B | 2,338,142 | 665,371 |
| Events in quadrant C | 2,871,353 | 623,714 |
| Events in quadrant D | 8,672,905 | 428,134 |
| Mode M9 | |||
|---|---|---|---|
| Quadrant | BADHDUFLAG | Total packets | Discarded packets |
| A | 0 | 31 | 0 |
| B | 0 | 31 | 0 |
| C | 0 | 31 | 0 |
| D | 0 | 32 | 0 |
| Mode SS | |||
|---|---|---|---|
| Quadrant | BADHDUFLAG | Total packets | Discarded packets |
| A | 0 | 104 | 0 |
| B | 0 | 104 | 0 |
| C | 0 | 104 | 0 |
| D | 0 | 104 | 0 |
| Mode M0 | |||
|---|---|---|---|
| Quadrant | BADHDUFLAG | Total packets | Discarded packets |
| A | 0 | 12031 | 3 |
| B | 0 | 10411 | 2 |
| C | 0 | 11812 | 2 |
| D | 0 | 29349 | 2 |
| Quadrant | Total seconds | Saturated seconds | Saturation percentage |
|---|---|---|---|
| A | 5177 | 44 | 0.849913% |
| B | 5177 | 5 | 0.096581% |
| C | 5177 | 24 | 0.463589% |
| D | 5177 | 1653 | 31.929689% |
Noise dominated data is calculated using 1-second bins in cleaned event files. If a bin has >2000 counts, and if more than 50% of those come from <1% of pixels, then it is considered to be noise-dominated and hence unusable.
| Quadrant | # 1 sec bins | Bins with >0 counts | Bins with >2000 counts | High rate bins dominated by noise | Noise dominated (total time) | Noise dominated (detector-on time) | Marked lightcurve |
|---|---|---|---|---|---|---|---|
| A | 7271 | 5178 | 33 | 33 | 0.45% | 0.64% | 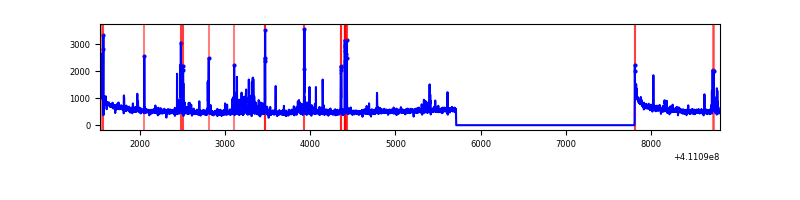 |
| B | 7271 | 5178 | 0 | 0 | 0.00% | 0.00% | 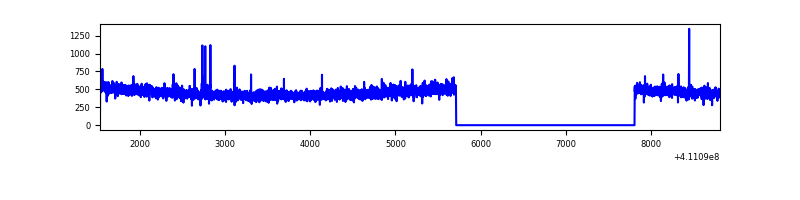 |
| C | 7271 | 5178 | 24 | 24 | 0.33% | 0.46% | 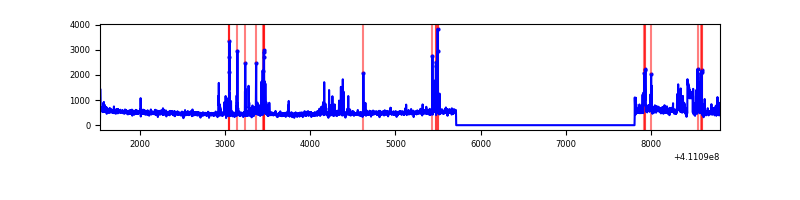 |
| D | 7271 | 5178 | 1703 | 1703 | 23.42% | 32.89% | 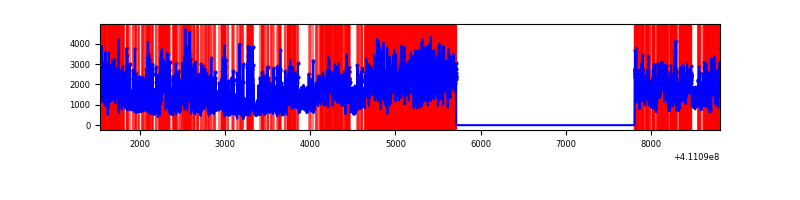 |
Top three noisy pixels from each quadrant. If the there are fewer than three noisy pixels in the level2.evt file, extra rows are filled as -1
| Pixel properties | Quadrant properties | ||||||
|---|---|---|---|---|---|---|---|
| Quadrant | DetID | PixID | Counts | Sigma | Mean | Median | Sigma |
| A | 10 | 83 | 419129 | 3524.8 | 588 | 578 | 118.7 |
| A | 13 | 248 | 223530 | 1877.58 | 588 | 578 | 118.7 |
| A | 2 | 79 | 55371 | 461.44 | 588 | 578 | 118.7 |
| B | 12 | 111 | 14046 | 119.99 | 592 | 578 | 112.2 |
| B | 11 | 111 | 12460 | 105.86 | 592 | 578 | 112.2 |
| B | 14 | 111 | 12417 | 105.48 | 592 | 578 | 112.2 |
| C | 14 | 254 | 393461 | 2981.41 | 571 | 575 | 131.8 |
| C | 15 | 214 | 217984 | 1649.81 | 571 | 575 | 131.8 |
| C | 9 | 187 | 25602 | 189.92 | 571 | 575 | 131.8 |
| D | 12 | 235 | 6293800 | 50928.79 | 504 | 490 | 123.6 |
| D | 2 | 249 | 244619 | 1975.62 | 504 | 490 | 123.6 |
| D | 13 | 249 | 129406 | 1043.26 | 504 | 490 | 123.6 |
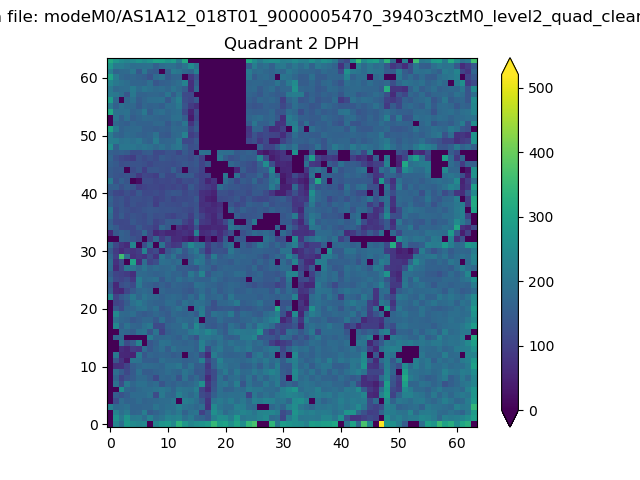
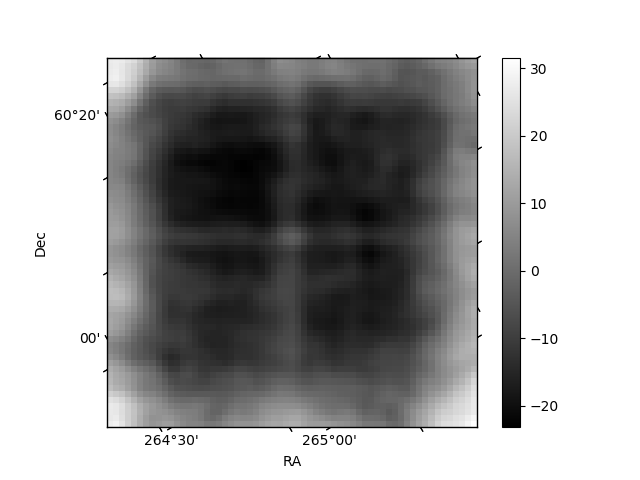
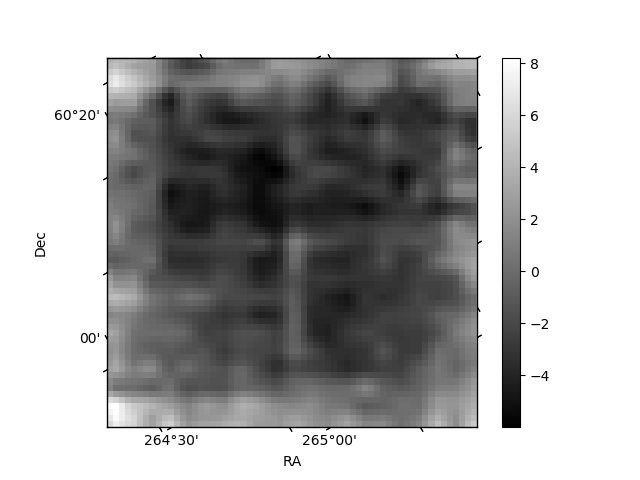
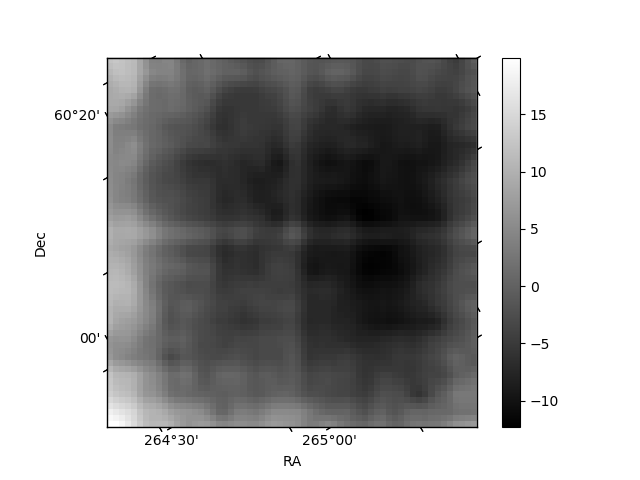
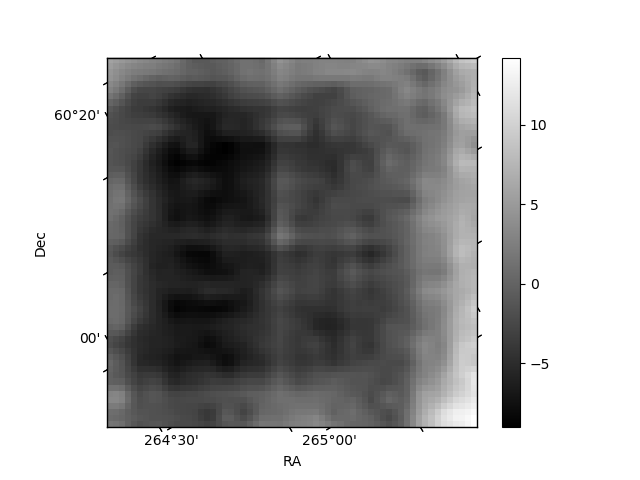
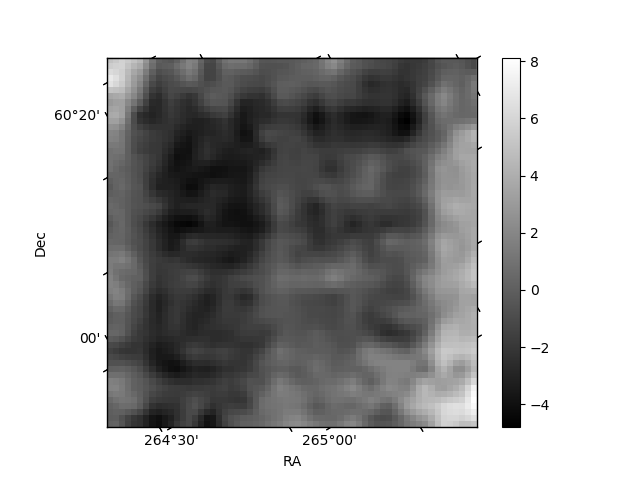
Histogram calculated using DETX and DETY for each event in the final _common_clean file
| Quadrant A | 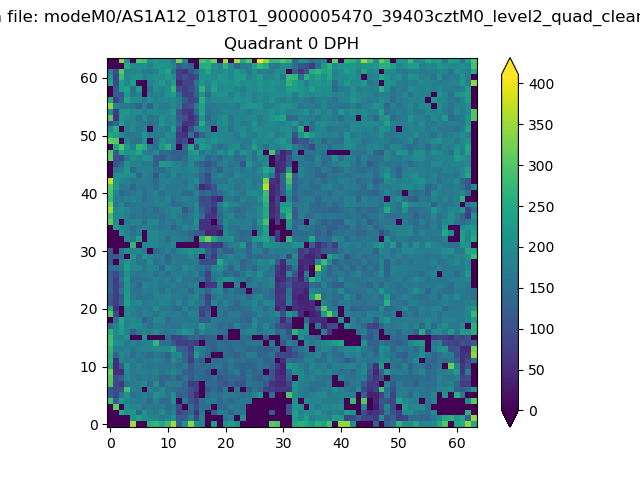 |
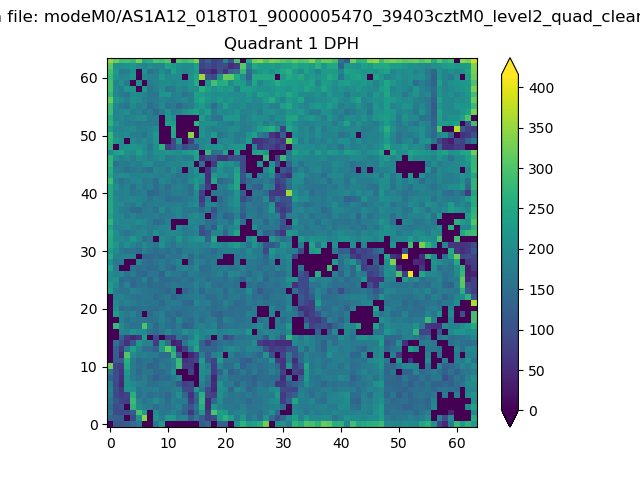 |
Quadrant B |
|---|---|---|---|
| Quadrant D | 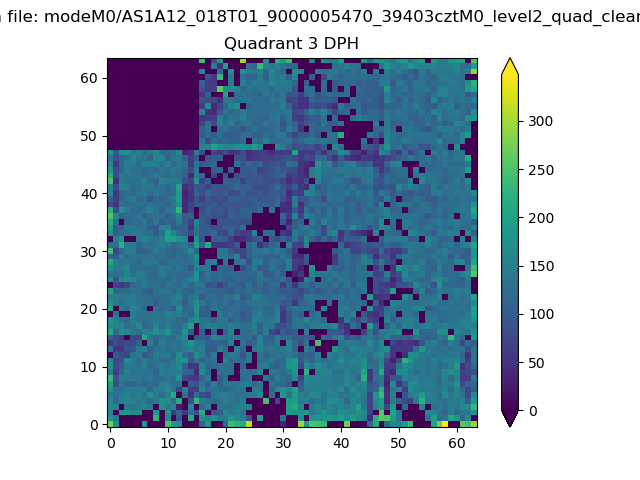 |
 |
Quadrant C |
| Plot type | Count rate plots | Images |
|---|---|---|
| Comparison with Poisson distribution Blue bars denote a histogram of data divided into 1 sec bins. Red curve is a Poisson curve with rate = median count rate of data. |
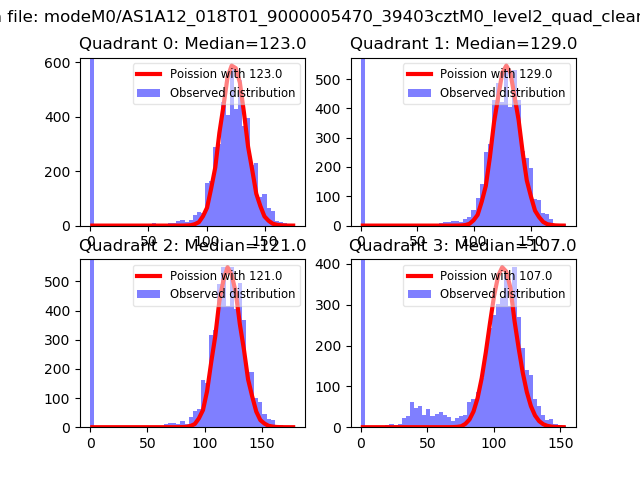 |
 |
| Quadrant-wise count rates Data is divided into 100 sec bins |
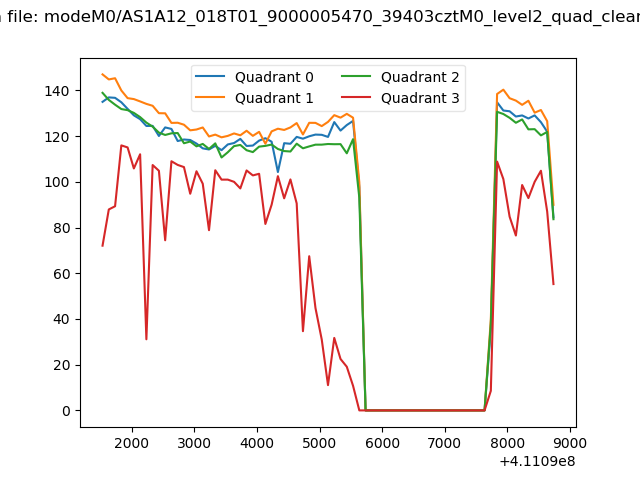 |
|
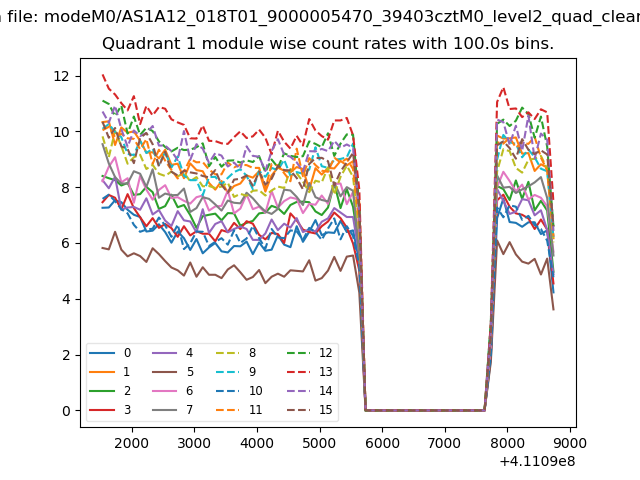
| Module-wise count rates for Quadrant A Data is divided into 100 sec bins |
 |
 |
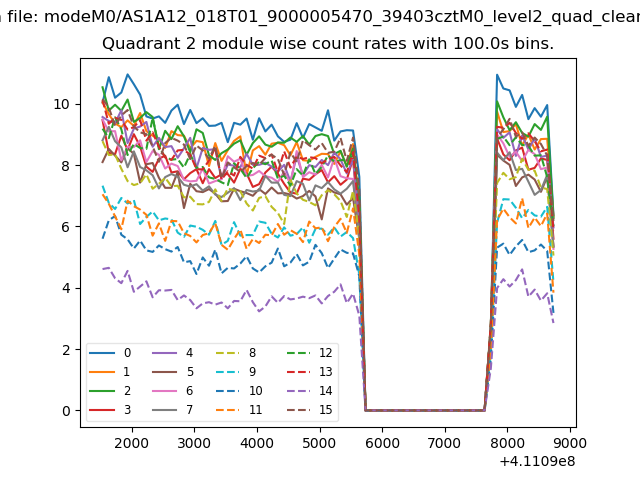
| Module-wise count rates for Quadrant B Data is divided into 100 sec bins |
 |
 |
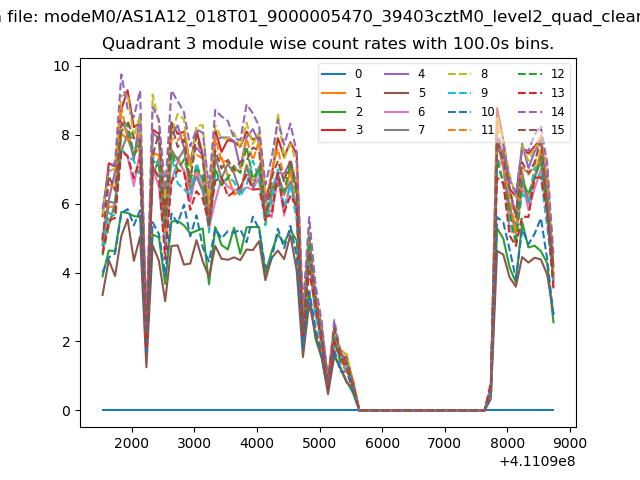
| Module-wise count rates for Quadrant C Data is divided into 100 sec bins |
 |
 |
| Module-wise count rates for Quadrant D Data is divided into 100 sec bins |
 |
 |
| Parameter | Plot |
|---|---|
| CZT HV Monitor | 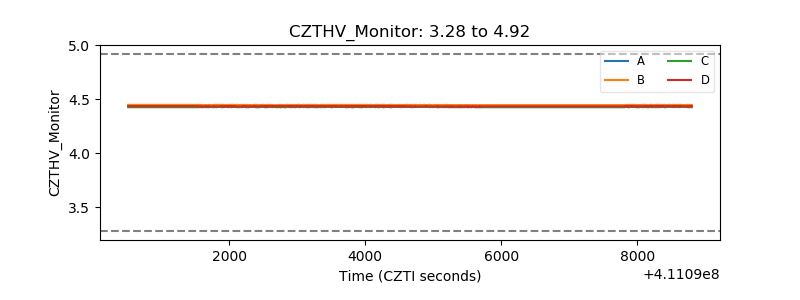 |
| D_VDD | 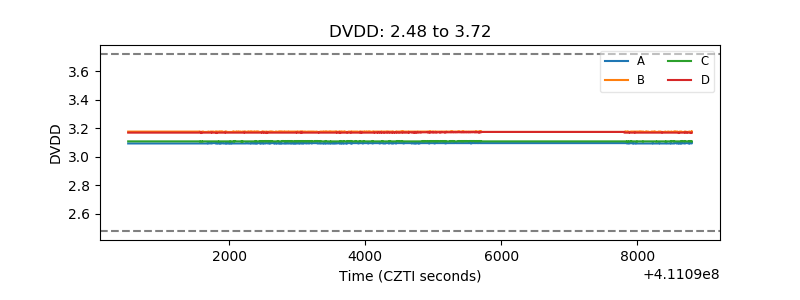 |
| Temperature 1 | 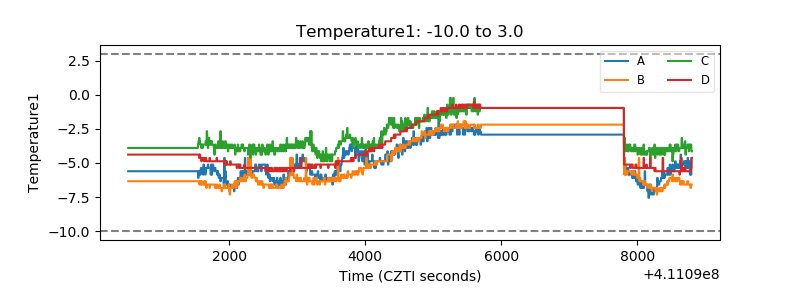 |
| Veto HV Monitor | 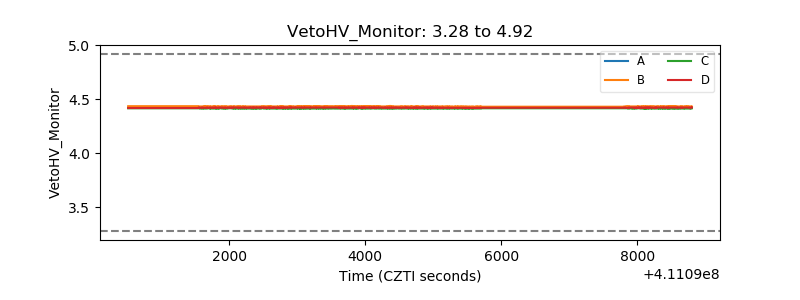 |
| Veto LLD | 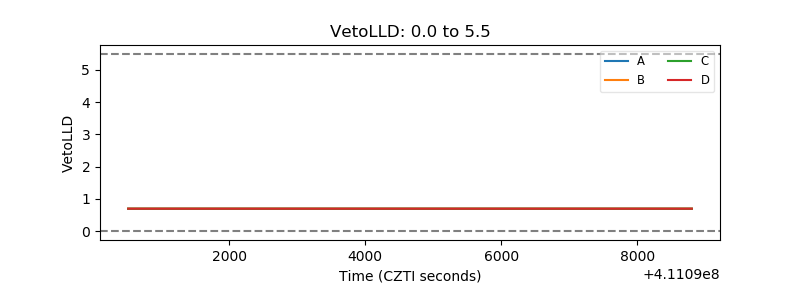 |
| Alpha Counter | 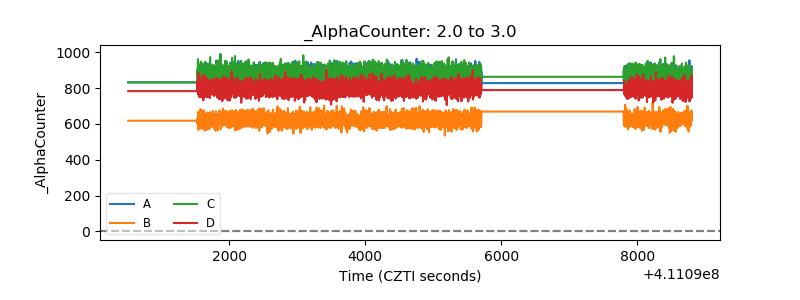 |
| _CPM_Rate | 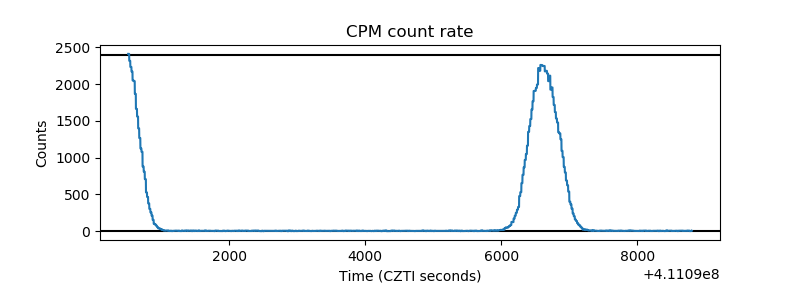 |
| CZT Counter | 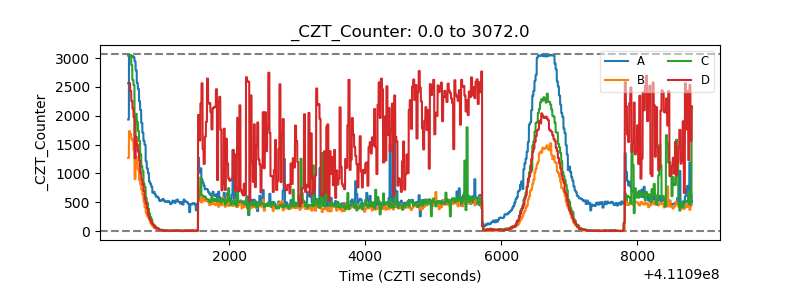 |
| +2.5 Volts monitor | 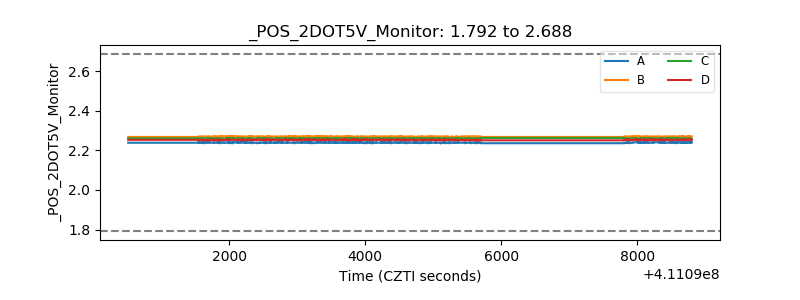 |
| +5 Volts monitor |  |
| _ROLL_ROT | 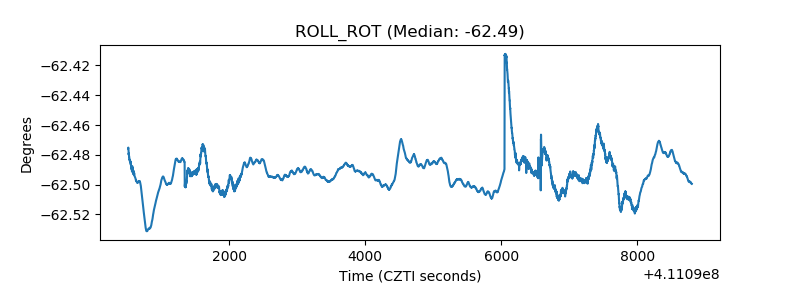 |
| _Roll_DEC | 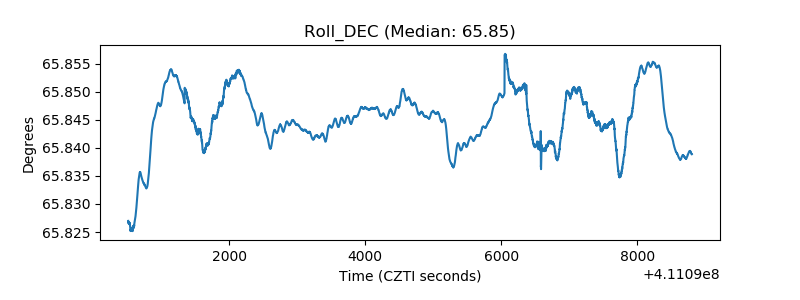 |
| _Roll_RA | 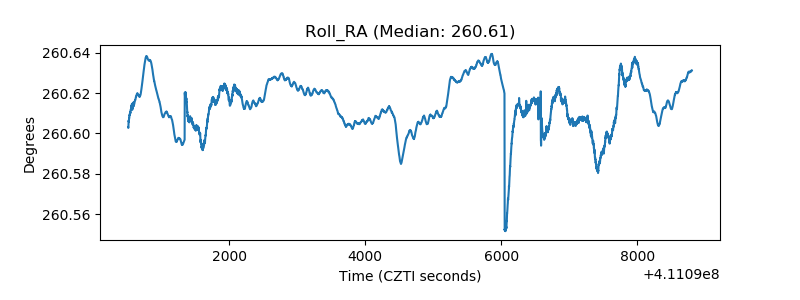 |
| Veto Counter | 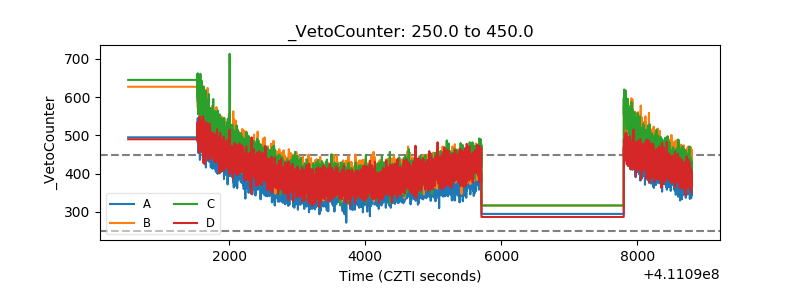 |