| Param | Original file | Final file |
|---|---|---|
| Filename | modeM0/AS1A12_018T01_9000005470_39404cztM0_level2.fits | modeM0/AS1A12_018T01_9000005470_39404cztM0_level2_quad_clean.evt |
| Size (bytes) | 523,059,840 | 77,342,400 |
| Size | 498.8 MB | 73.8 MB |
| Events in quadrant A | 2,896,471 | 593,116 |
| Events in quadrant B | 2,221,435 | 618,036 |
| Events in quadrant C | 2,986,169 | 564,814 |
| Events in quadrant D | 10,877,015 | 221,900 |
| Mode M9 | |||
|---|---|---|---|
| Quadrant | BADHDUFLAG | Total packets | Discarded packets |
| A | 0 | 31 | 0 |
| B | 0 | 31 | 0 |
| C | 0 | 31 | 0 |
| D | 0 | 32 | 0 |
| Mode SS | |||
|---|---|---|---|
| Quadrant | BADHDUFLAG | Total packets | Discarded packets |
| A | 0 | 102 | 0 |
| B | 0 | 102 | 0 |
| C | 0 | 102 | 0 |
| D | 0 | 102 | 0 |
| Mode M0 | |||
|---|---|---|---|
| Quadrant | BADHDUFLAG | Total packets | Discarded packets |
| A | 0 | 11614 | 3 |
| B | 0 | 9864 | 2 |
| C | 0 | 12004 | 2 |
| D | 0 | 35660 | 2 |
| Quadrant | Total seconds | Saturated seconds | Saturation percentage |
|---|---|---|---|
| A | 4897 | 45 | 0.918930% |
| B | 4897 | 2 | 0.040841% |
| C | 4897 | 123 | 2.511742% |
| D | 4897 | 3178 | 64.896876% |
Noise dominated data is calculated using 1-second bins in cleaned event files. If a bin has >2000 counts, and if more than 50% of those come from <1% of pixels, then it is considered to be noise-dominated and hence unusable.
| Quadrant | # 1 sec bins | Bins with >0 counts | Bins with >2000 counts | High rate bins dominated by noise | Noise dominated (total time) | Noise dominated (detector-on time) | Marked lightcurve |
|---|---|---|---|---|---|---|---|
| A | 7019 | 4898 | 27 | 27 | 0.38% | 0.55% | 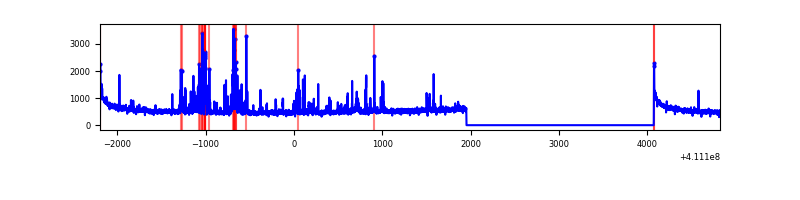 |
| B | 7019 | 4898 | 0 | 0 | 0.00% | 0.00% | 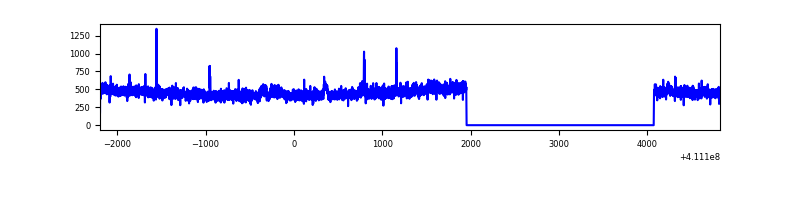 |
| C | 7019 | 4898 | 101 | 101 | 1.44% | 2.06% | 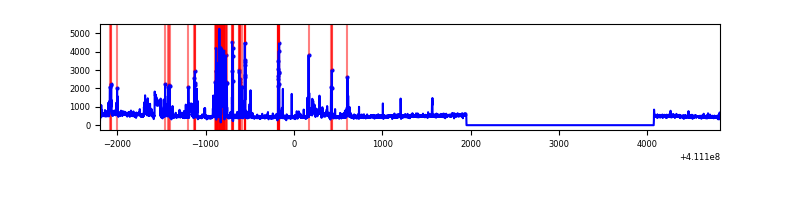 |
| D | 7019 | 4898 | 3052 | 3052 | 43.48% | 62.31% | 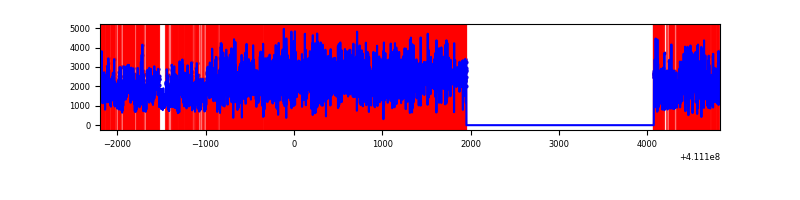 |
Top three noisy pixels from each quadrant. If the there are fewer than three noisy pixels in the level2.evt file, extra rows are filled as -1
| Pixel properties | Quadrant properties | ||||||
|---|---|---|---|---|---|---|---|
| Quadrant | DetID | PixID | Counts | Sigma | Mean | Median | Sigma |
| A | 10 | 83 | 406239 | 3638.07 | 550 | 540 | 111.5 |
| A | 13 | 248 | 309225 | 2768.1 | 550 | 540 | 111.5 |
| A | 2 | 79 | 44383 | 393.16 | 550 | 540 | 111.5 |
| B | 0 | 190 | 25978 | 242.59 | 550 | 536 | 104.9 |
| B | 4 | 170 | 22690 | 211.24 | 550 | 536 | 104.9 |
| B | 12 | 111 | 13095 | 119.75 | 550 | 536 | 104.9 |
| C | 14 | 254 | 720826 | 5931.1 | 525 | 527 | 121.4 |
| C | 15 | 214 | 206254 | 1694.0 | 525 | 527 | 121.4 |
| C | 9 | 187 | 5010 | 36.91 | 525 | 527 | 121.4 |
| D | 12 | 235 | 8682664 | 95534.26 | 371 | 360 | 90.9 |
| D | 12 | 227 | 526390 | 5788.08 | 371 | 360 | 90.9 |
| D | 2 | 249 | 97162 | 1065.14 | 371 | 360 | 90.9 |
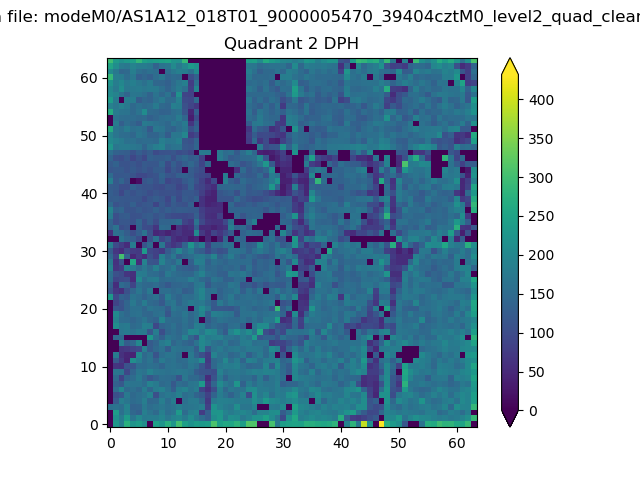
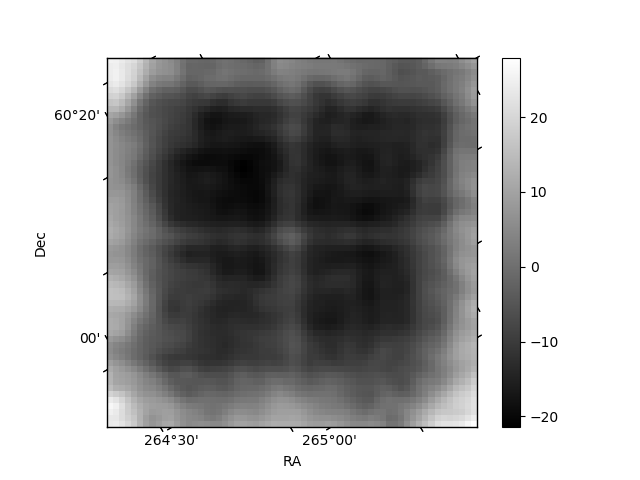
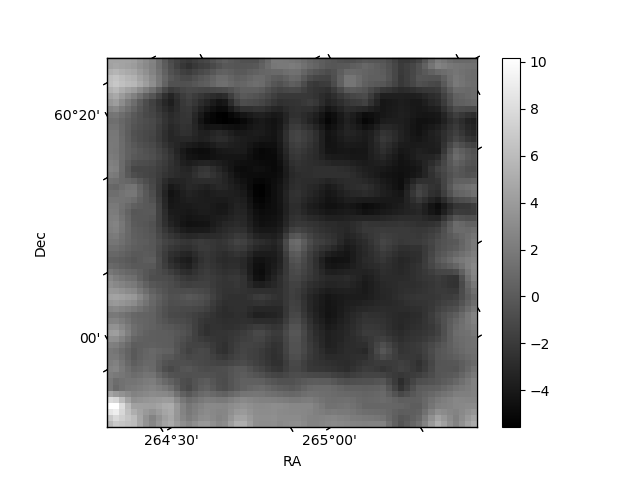
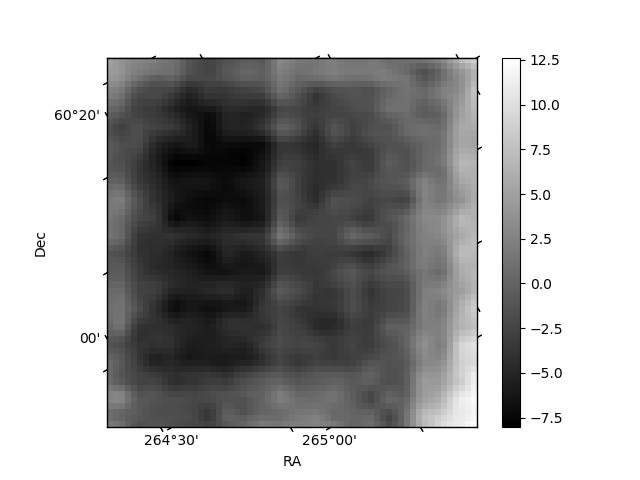
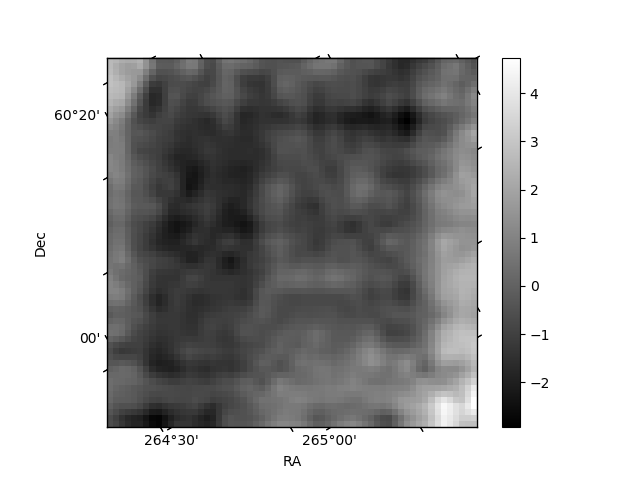
Histogram calculated using DETX and DETY for each event in the final _common_clean file
| Quadrant A | 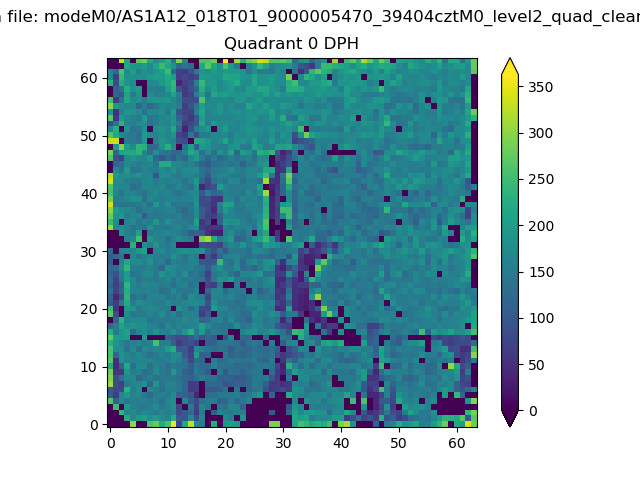 |
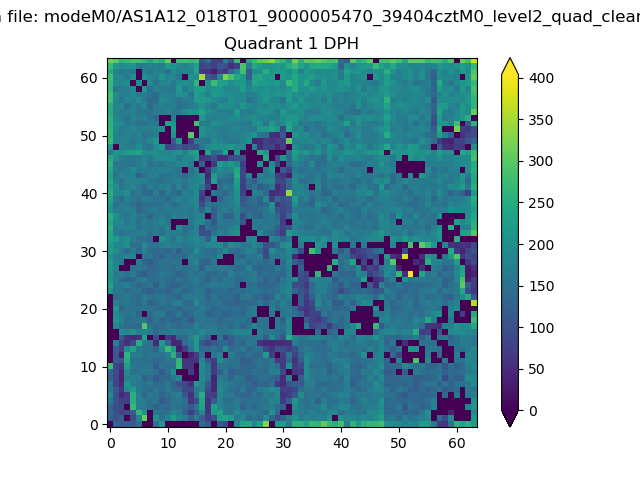 |
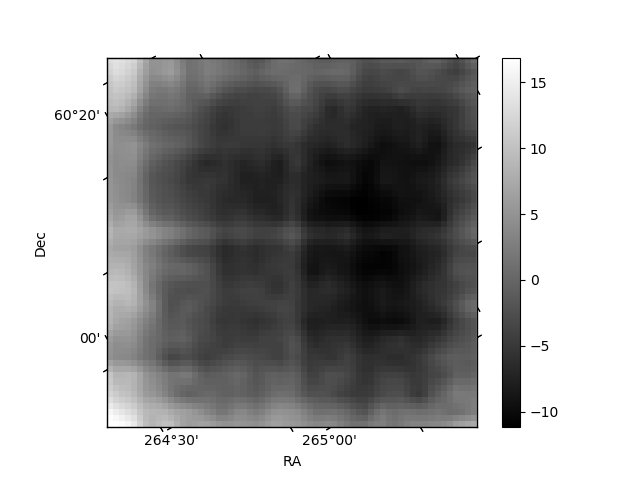
Quadrant B |
|---|---|---|---|
| Quadrant D | 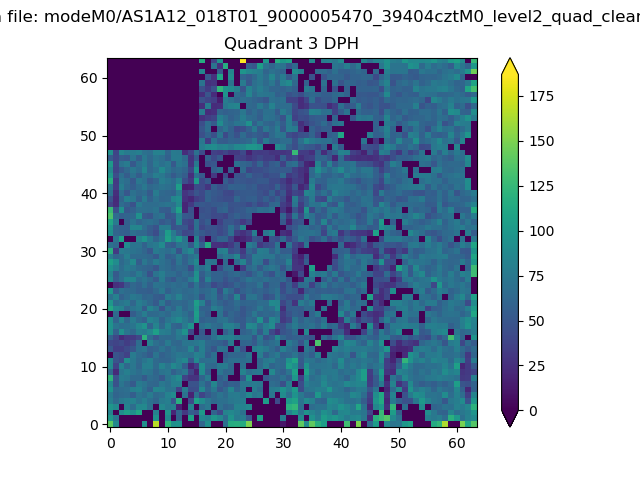 |
 |
Quadrant C |
| Plot type | Count rate plots | Images |
|---|---|---|
| Comparison with Poisson distribution Blue bars denote a histogram of data divided into 1 sec bins. Red curve is a Poisson curve with rate = median count rate of data. |
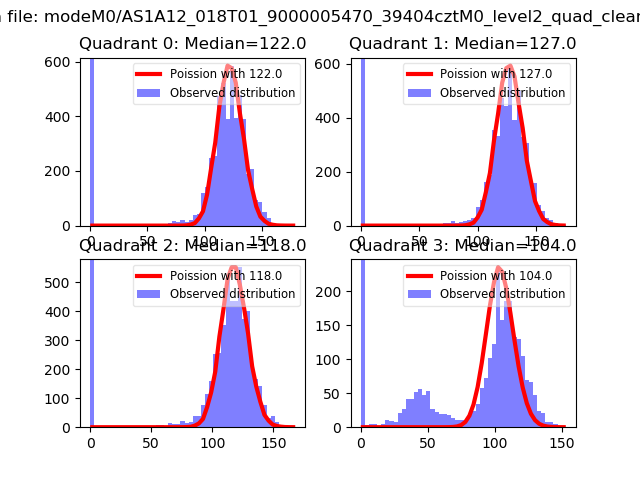 |
 |
| Quadrant-wise count rates Data is divided into 100 sec bins |
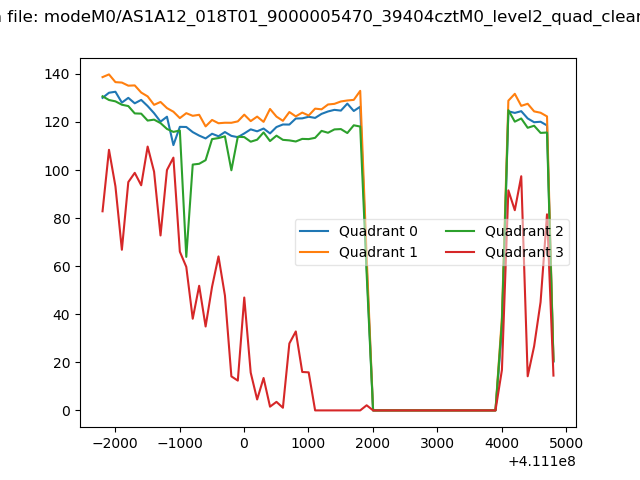 |
|
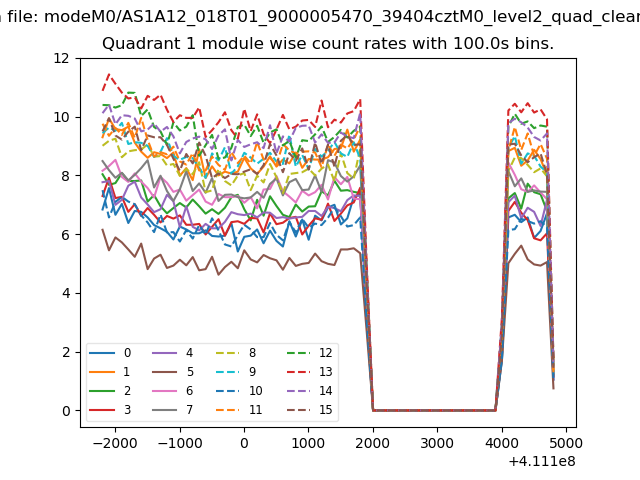
| Module-wise count rates for Quadrant A Data is divided into 100 sec bins |
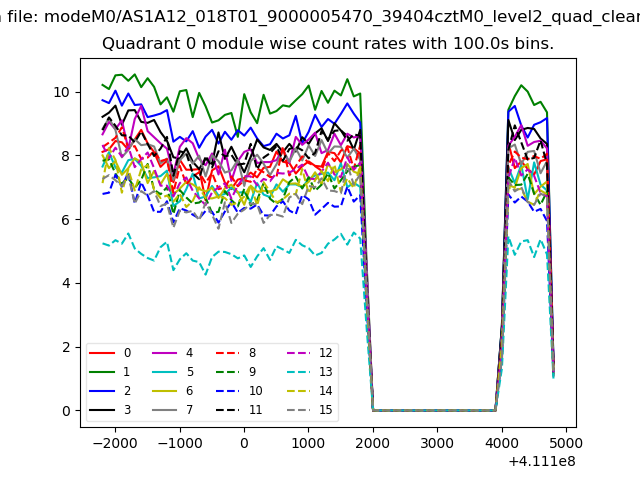 |
 |
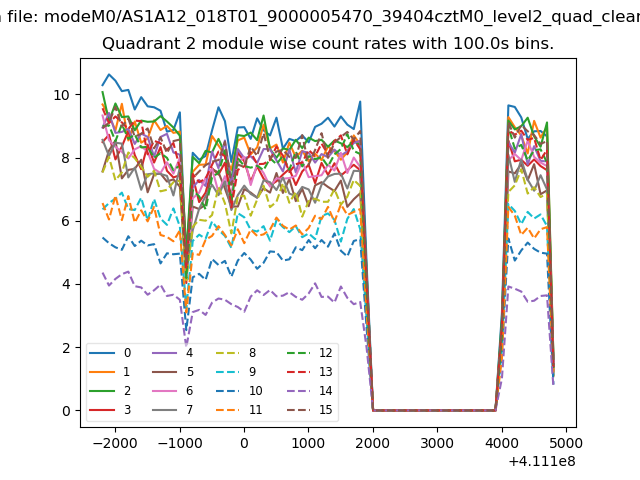
| Module-wise count rates for Quadrant B Data is divided into 100 sec bins |
 |
 |
| Module-wise count rates for Quadrant C Data is divided into 100 sec bins |
 |
 |
| Module-wise count rates for Quadrant D Data is divided into 100 sec bins |
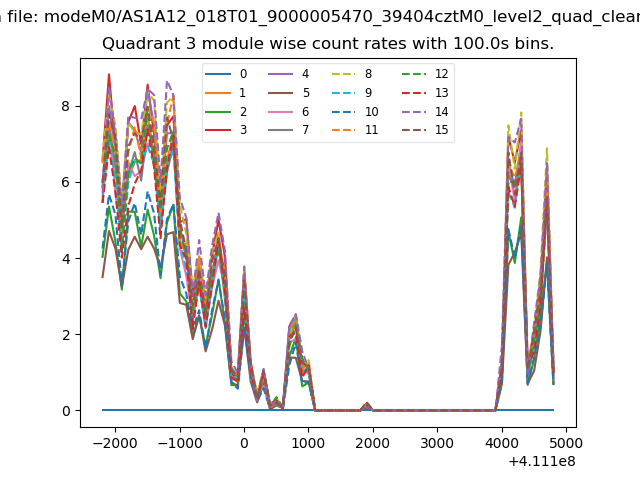 |
 |
| Parameter | Plot |
|---|---|
| CZT HV Monitor | 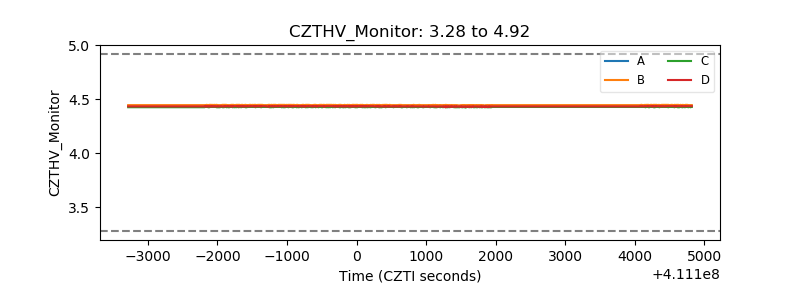 |
| D_VDD | 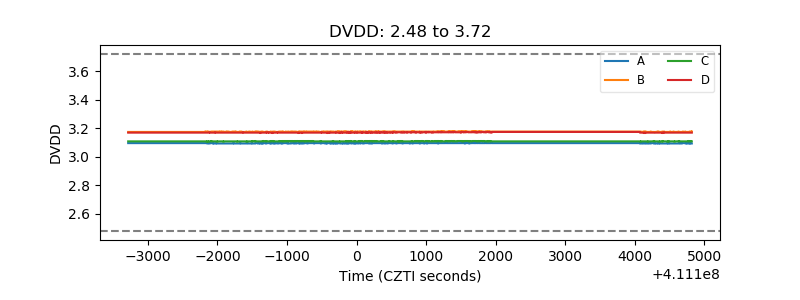 |
| Temperature 1 | 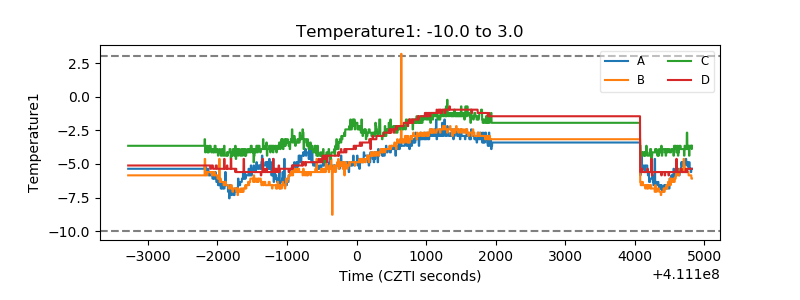 |
| Veto HV Monitor | 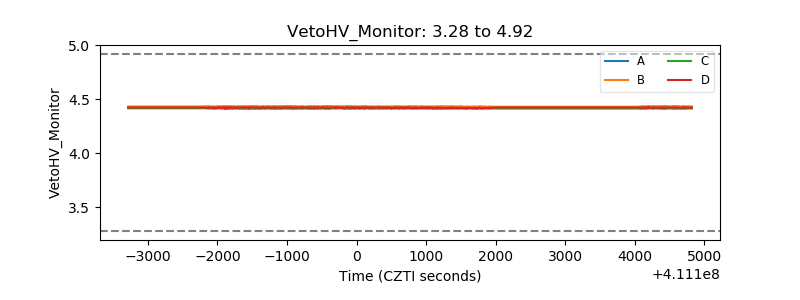 |
| Veto LLD | 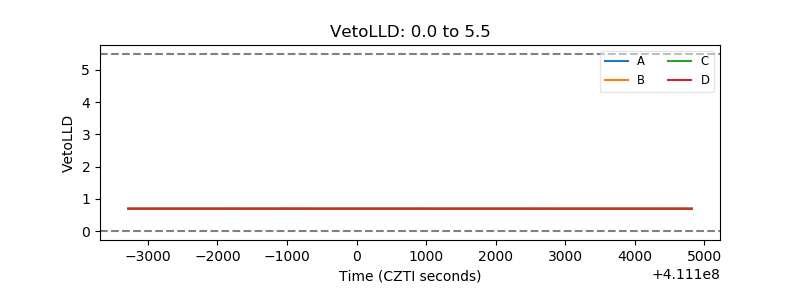 |
| Alpha Counter | 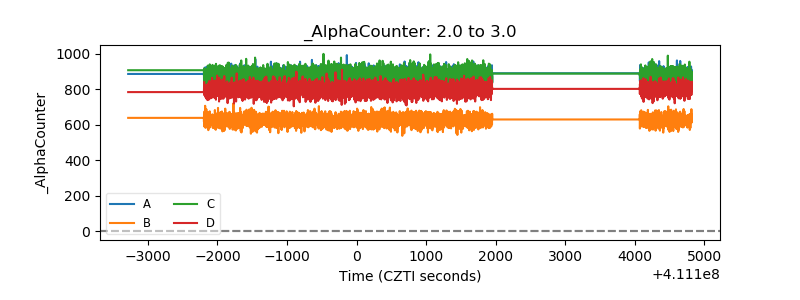 |
| _CPM_Rate | 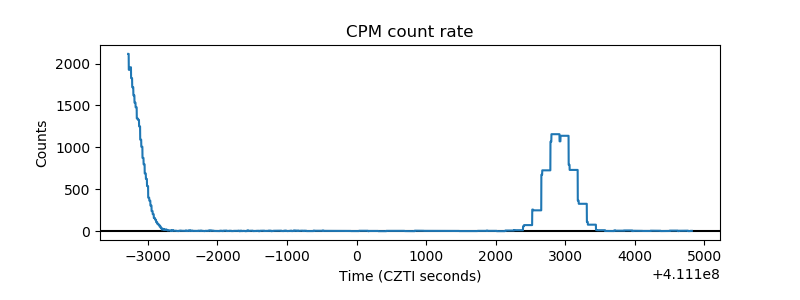 |
| CZT Counter | 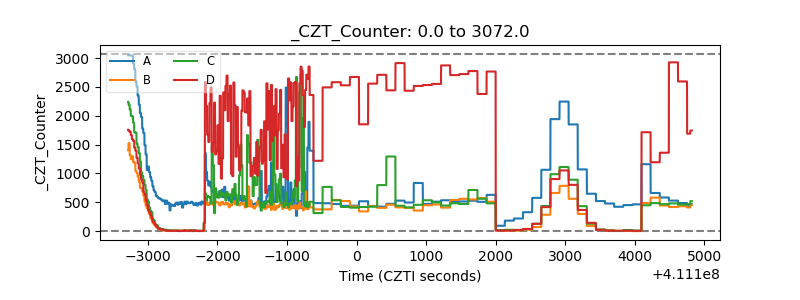 |
| +2.5 Volts monitor | 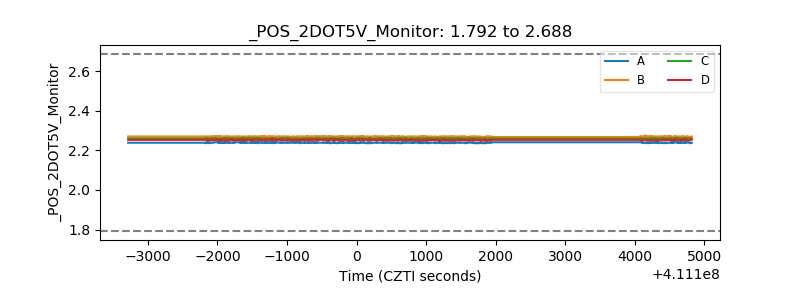 |
| +5 Volts monitor | 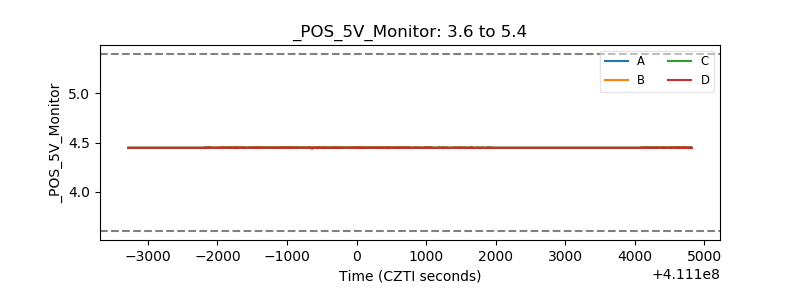 |
| _ROLL_ROT | 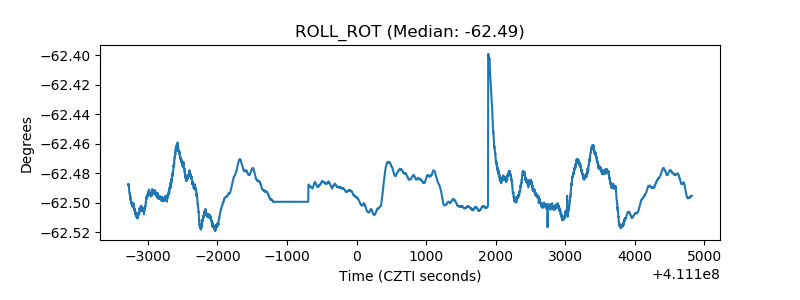 |
| _Roll_DEC | 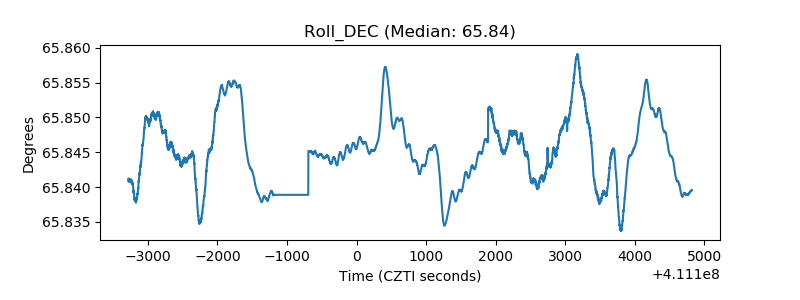 |
| _Roll_RA | 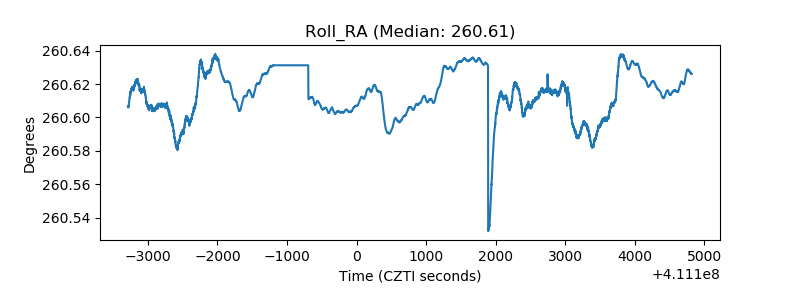 |
| Veto Counter | 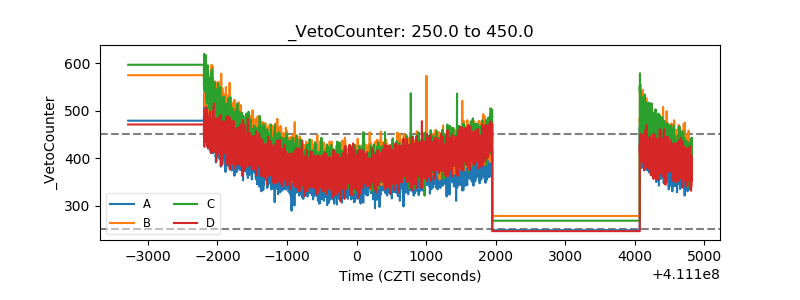 |