| Param | Original file | Final file |
|---|---|---|
| Filename | modeM0/AS1A12_018T01_9000005470_39406cztM0_level2.fits | modeM0/AS1A12_018T01_9000005470_39406cztM0_level2_quad_clean.evt |
| Size (bytes) | 852,753,600 | 142,692,480 |
| Size | 813.2 MB | 136.1 MB |
| Events in quadrant A | 4,804,149 | 1,052,369 |
| Events in quadrant B | 4,140,232 | 1,086,699 |
| Events in quadrant C | 4,720,951 | 1,008,380 |
| Events in quadrant D | 17,187,579 | 534,817 |
| Mode M9 | |||
|---|---|---|---|
| Quadrant | BADHDUFLAG | Total packets | Discarded packets |
| A | 0 | 41 | 0 |
| B | 0 | 41 | 0 |
| C | 0 | 41 | 0 |
| D | 0 | 41 | 0 |
| Mode SS | |||
|---|---|---|---|
| Quadrant | BADHDUFLAG | Total packets | Discarded packets |
| A | 0 | 186 | 0 |
| B | 0 | 186 | 0 |
| C | 0 | 186 | 0 |
| D | 0 | 186 | 0 |
| Mode M0 | |||
|---|---|---|---|
| Quadrant | BADHDUFLAG | Total packets | Discarded packets |
| A | 0 | 19830 | 2 |
| B | 0 | 18773 | 1 |
| C | 0 | 20195 | 1 |
| D | 0 | 57485 | 1 |
| Quadrant | Total seconds | Saturated seconds | Saturation percentage |
|---|---|---|---|
| A | 9207 | 54 | 0.586510% |
| B | 9207 | 13 | 0.141197% |
| C | 9207 | 46 | 0.499620% |
| D | 9207 | 4362 | 47.376996% |
Noise dominated data is calculated using 1-second bins in cleaned event files. If a bin has >2000 counts, and if more than 50% of those come from <1% of pixels, then it is considered to be noise-dominated and hence unusable.
| Quadrant | # 1 sec bins | Bins with >0 counts | Bins with >2000 counts | High rate bins dominated by noise | Noise dominated (total time) | Noise dominated (detector-on time) | Marked lightcurve |
|---|---|---|---|---|---|---|---|
| A | 13212 | 9209 | 41 | 41 | 0.31% | 0.45% | 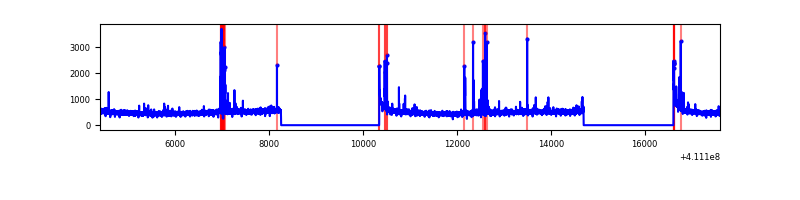 |
| B | 13212 | 9209 | 4 | 4 | 0.03% | 0.04% | 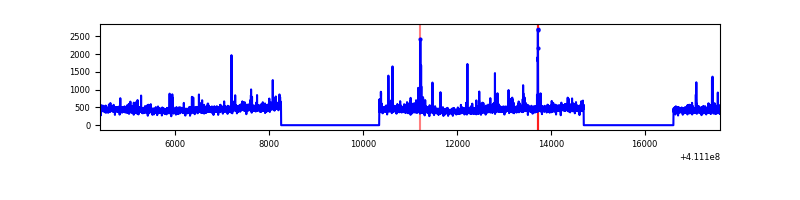 |
| C | 13212 | 9209 | 44 | 44 | 0.33% | 0.48% | 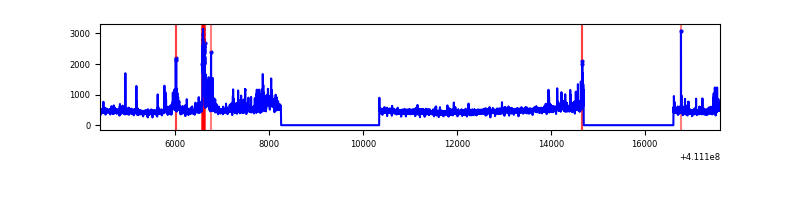 |
| D | 13212 | 9209 | 4057 | 4057 | 30.71% | 44.05% | 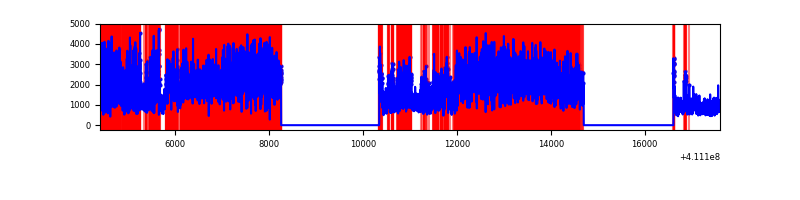 |
Top three noisy pixels from each quadrant. If the there are fewer than three noisy pixels in the level2.evt file, extra rows are filled as -1
| Pixel properties | Quadrant properties | ||||||
|---|---|---|---|---|---|---|---|
| Quadrant | DetID | PixID | Counts | Sigma | Mean | Median | Sigma |
| A | 10 | 83 | 618968 | 3048.6 | 1006 | 988 | 202.7 |
| A | 13 | 248 | 200453 | 983.99 | 1006 | 988 | 202.7 |
| A | 15 | 174 | 52115 | 252.22 | 1006 | 988 | 202.7 |
| B | 5 | 172 | 109170 | 574.42 | 999 | 973 | 188.4 |
| B | 5 | 255 | 30131 | 154.8 | 999 | 973 | 188.4 |
| B | 4 | 170 | 29221 | 149.97 | 999 | 973 | 188.4 |
| C | 9 | 187 | 502153 | 2244.12 | 963 | 970 | 223.3 |
| C | 15 | 214 | 382523 | 1708.46 | 963 | 970 | 223.3 |
| C | 14 | 254 | 47584 | 208.72 | 963 | 970 | 223.3 |
| D | 12 | 235 | 12365915 | 63692.0 | 796 | 771 | 194.1 |
| D | 12 | 227 | 959576 | 4938.74 | 796 | 771 | 194.1 |
| D | 13 | 249 | 307682 | 1580.88 | 796 | 771 | 194.1 |
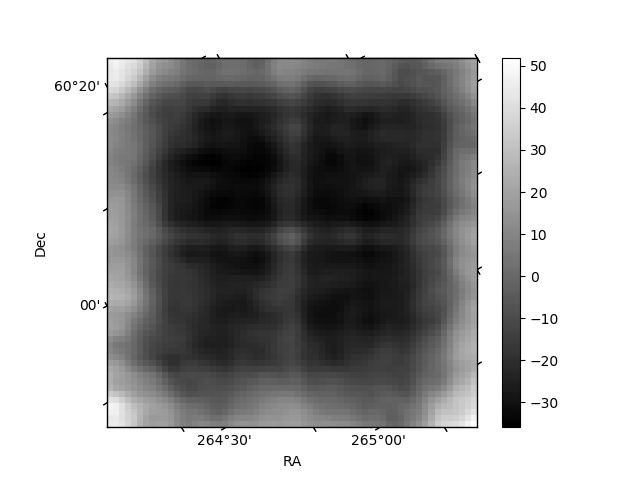
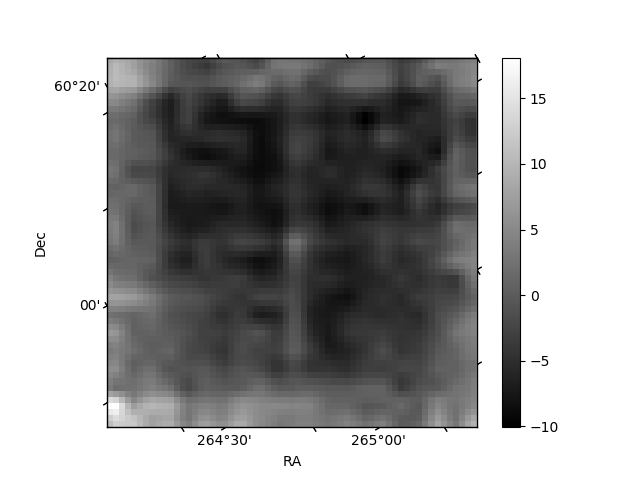
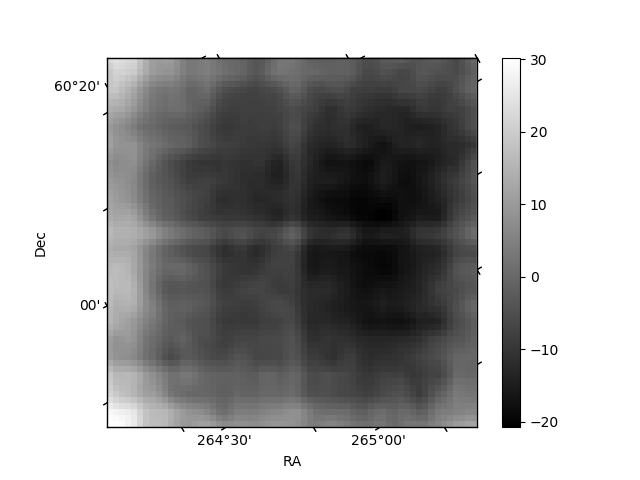
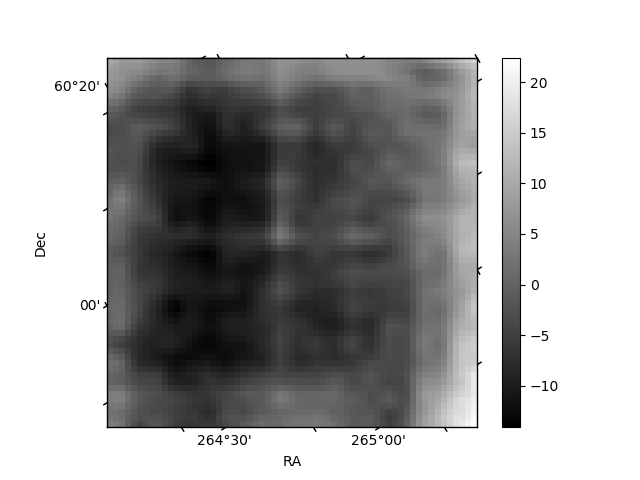
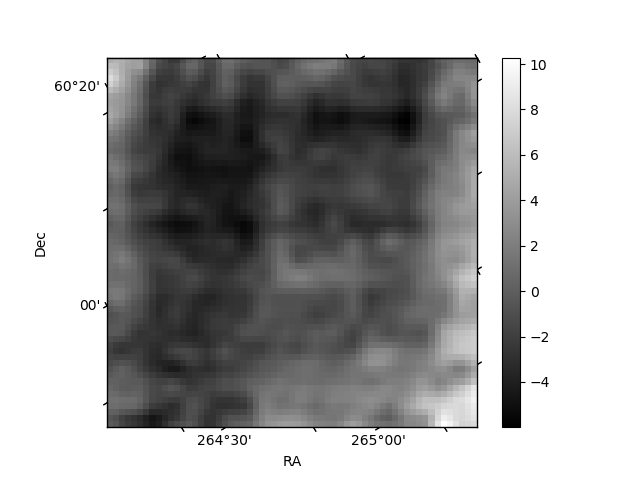
Histogram calculated using DETX and DETY for each event in the final _common_clean file
| Quadrant A | 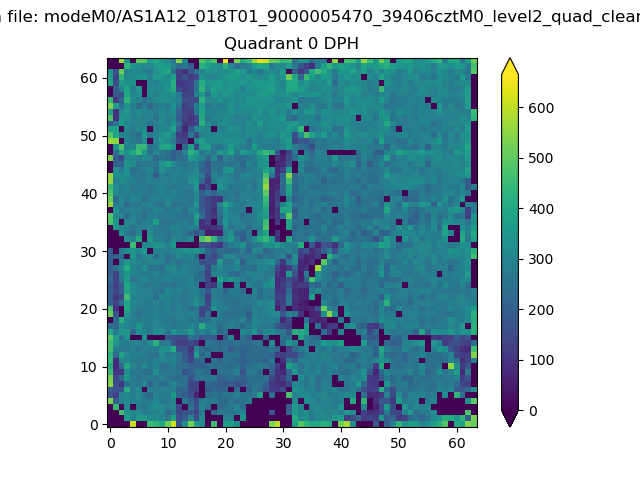 |
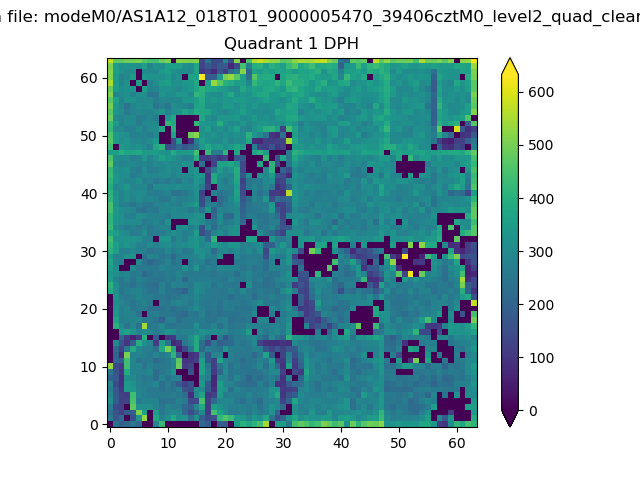 |
Quadrant B |
|---|---|---|---|
| Quadrant D | 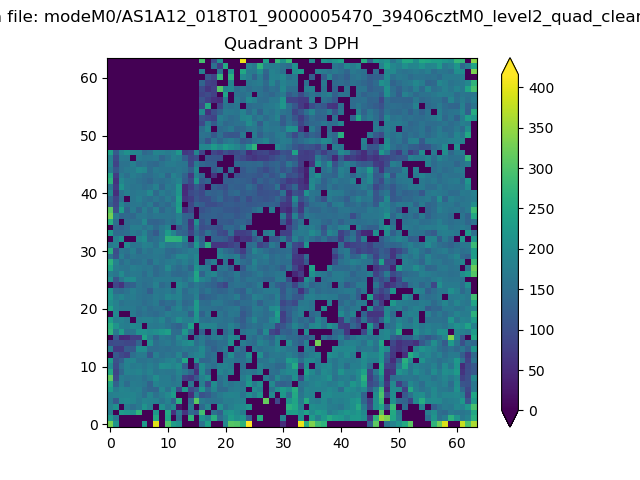 |
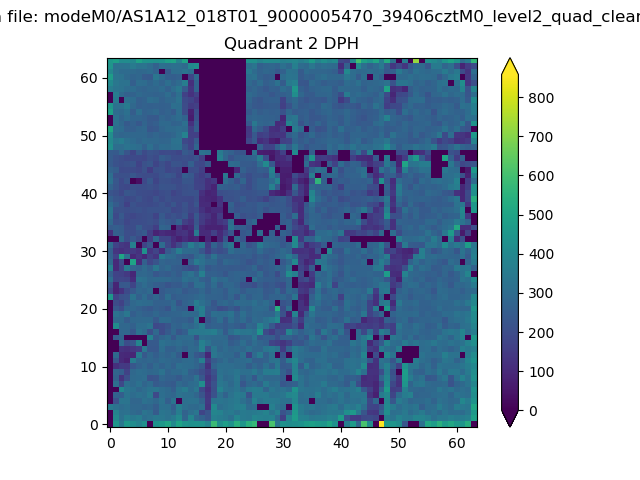 |
Quadrant C |
| Plot type | Count rate plots | Images |
|---|---|---|
| Comparison with Poisson distribution Blue bars denote a histogram of data divided into 1 sec bins. Red curve is a Poisson curve with rate = median count rate of data. |
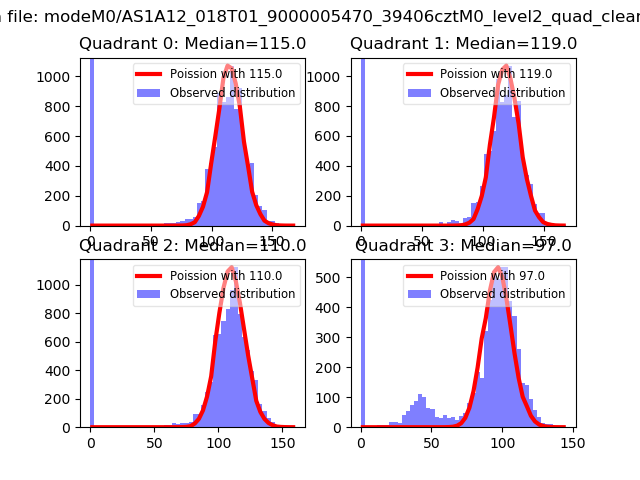 |
 |
| Quadrant-wise count rates Data is divided into 100 sec bins |
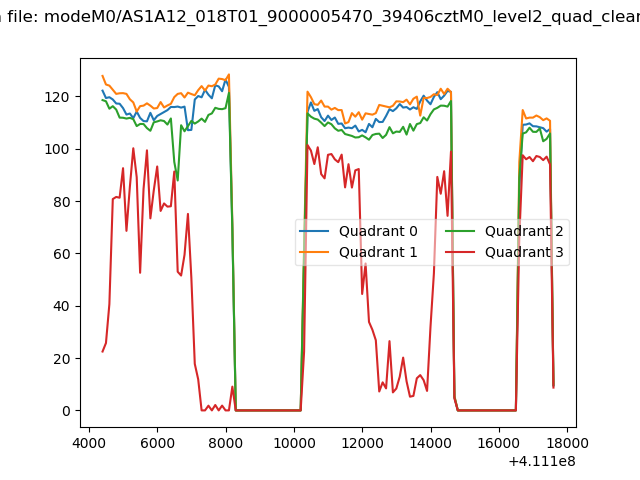 |
|
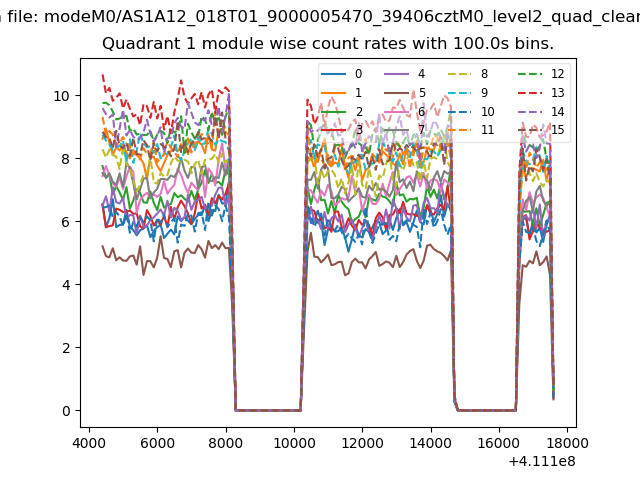
| Module-wise count rates for Quadrant A Data is divided into 100 sec bins |
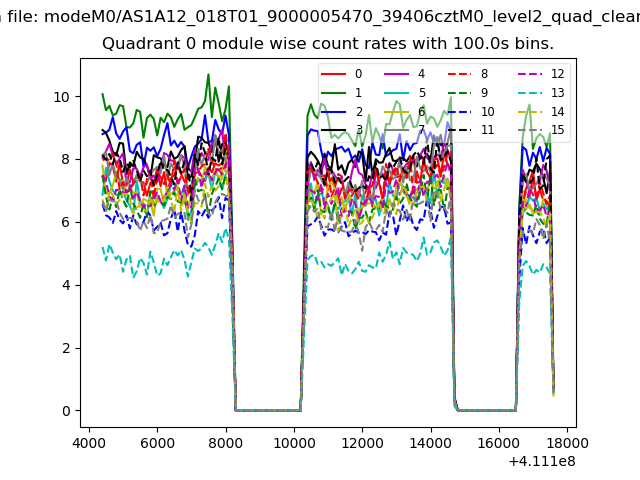 |
 |
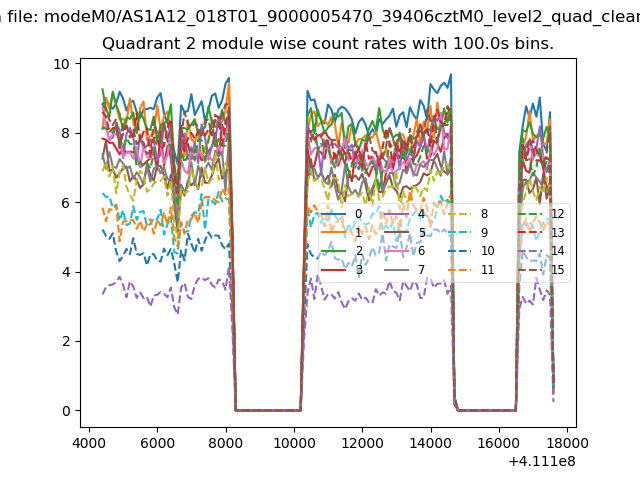
| Module-wise count rates for Quadrant B Data is divided into 100 sec bins |
 |
 |
| Module-wise count rates for Quadrant C Data is divided into 100 sec bins |
 |
 |
| Module-wise count rates for Quadrant D Data is divided into 100 sec bins |
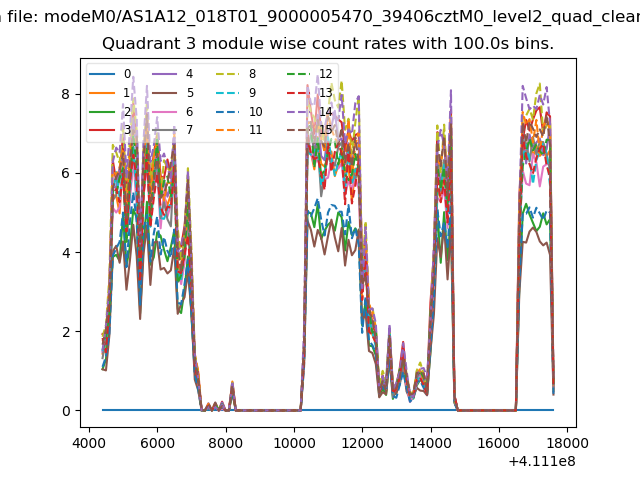 |
 |
| Parameter | Plot |
|---|---|
| CZT HV Monitor | 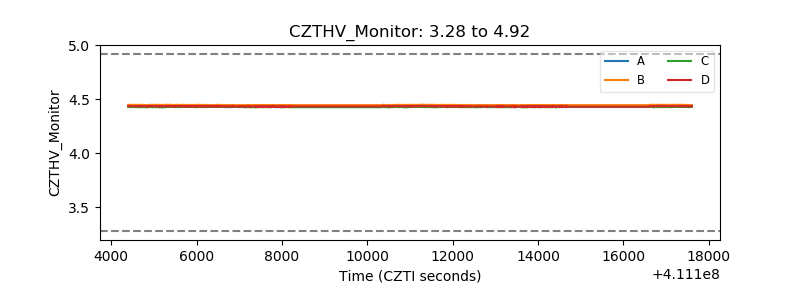 |
| D_VDD | 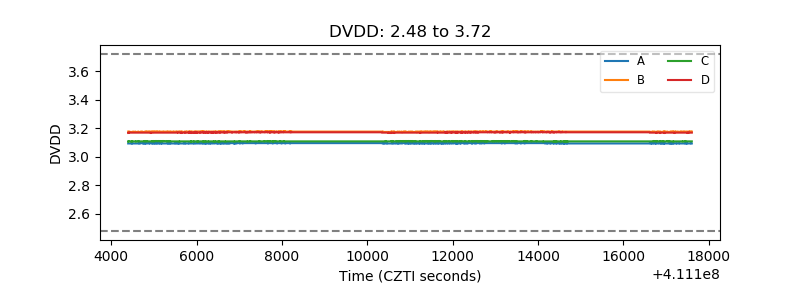 |
| Temperature 1 | 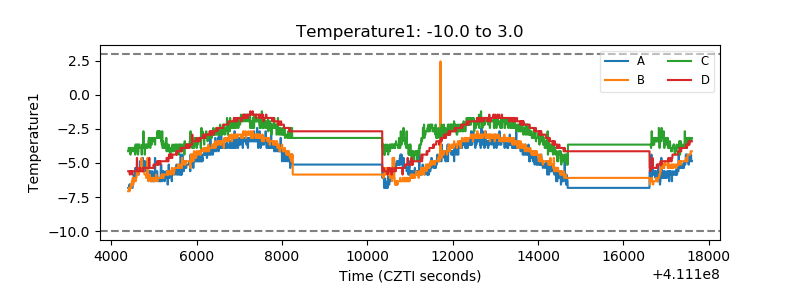 |
| Veto HV Monitor | 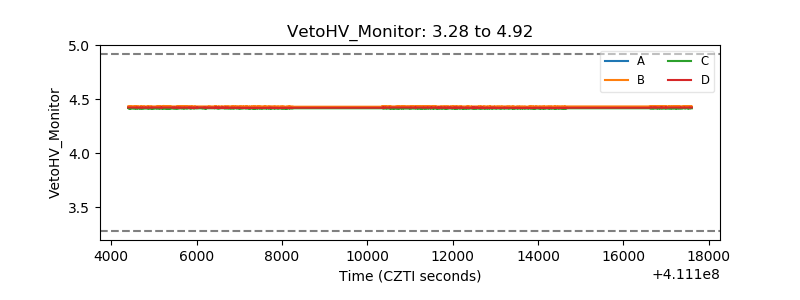 |
| Veto LLD | 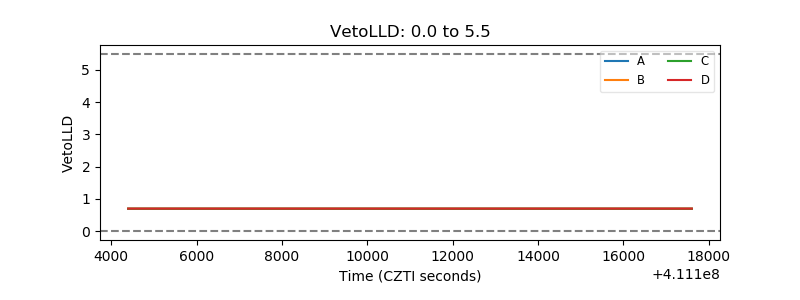 |
| Alpha Counter | 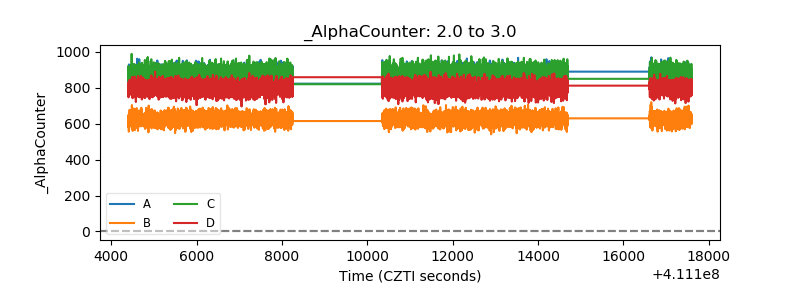 |
| _CPM_Rate | 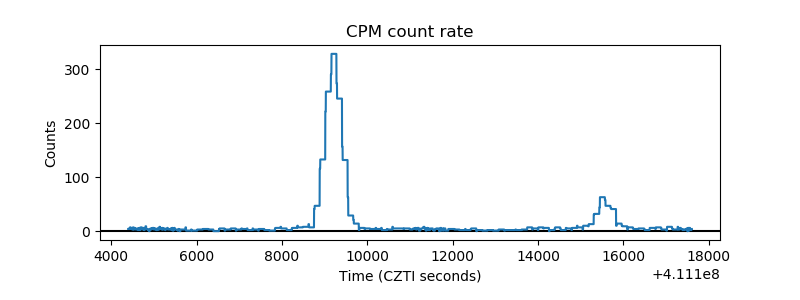 |
| CZT Counter | 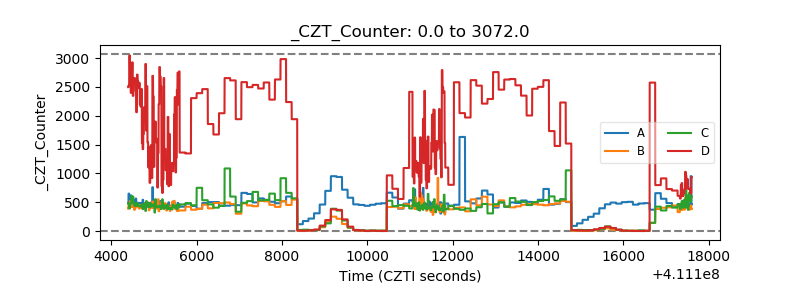 |
| +2.5 Volts monitor | 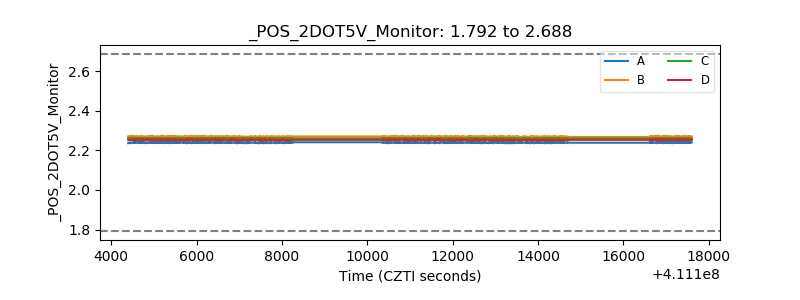 |
| +5 Volts monitor | 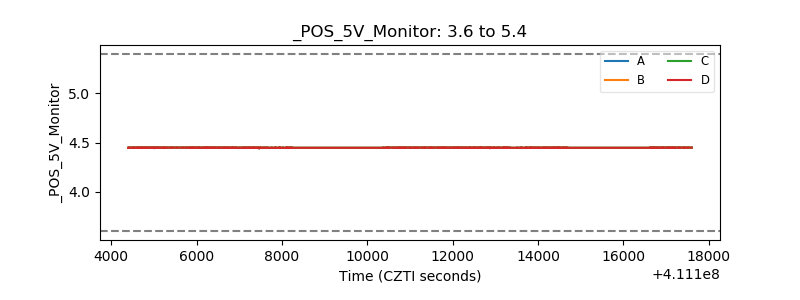 |
| _ROLL_ROT | 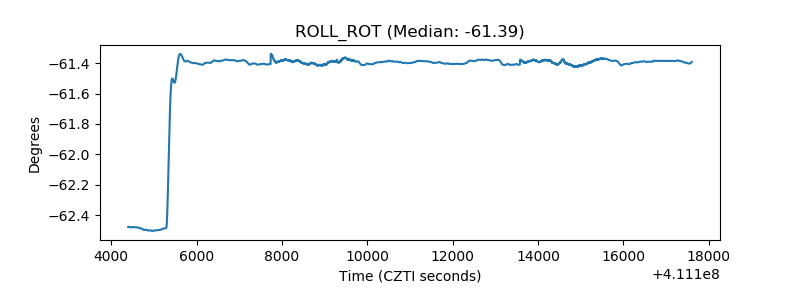 |
| _Roll_DEC | 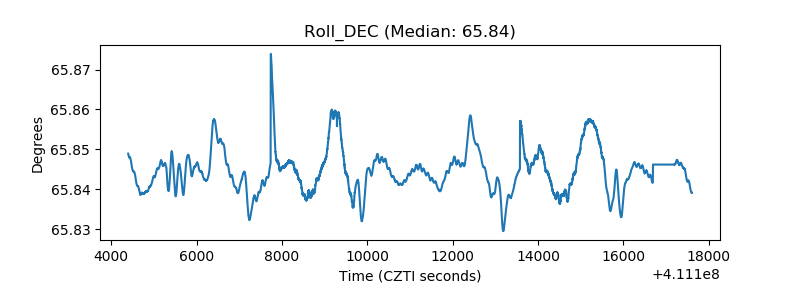 |
| _Roll_RA | 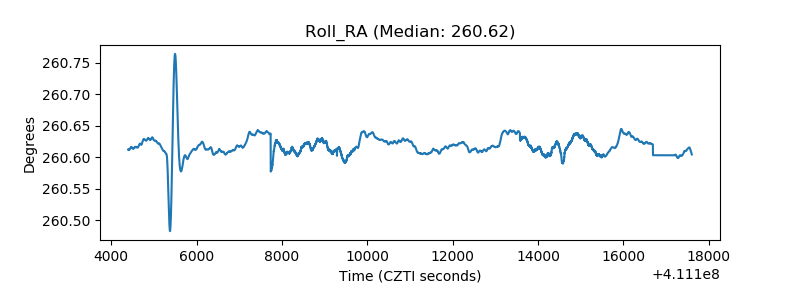 |
| Veto Counter | 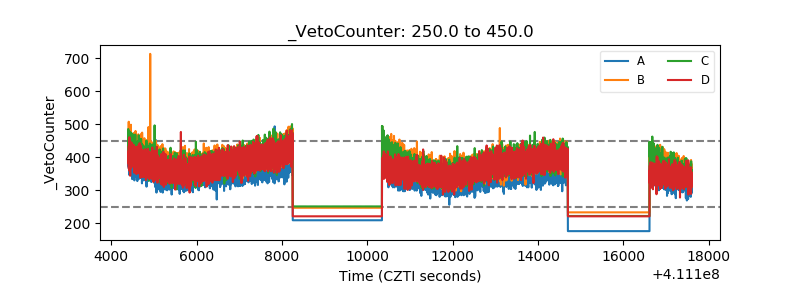 |