| Param | Original file | Final file |
|---|---|---|
| Filename | modeM0/AS1A12_018T01_9000005470_39409cztM0_level2.fits | modeM0/AS1A12_018T01_9000005470_39409cztM0_level2_quad_clean.evt |
| Size (bytes) | 354,407,040 | 62,271,360 |
| Size | 338.0 MB | 59.4 MB |
| Events in quadrant A | 2,461,227 | 418,482 |
| Events in quadrant B | 2,133,771 | 436,580 |
| Events in quadrant C | 2,511,466 | 403,176 |
| Events in quadrant D | 5,707,735 | 350,602 |
| Mode M9 | |||
|---|---|---|---|
| Quadrant | BADHDUFLAG | Total packets | Discarded packets |
| A | 1 | 140632024721448 | 140630114172974 |
| B | 1 | -1 | -1 |
| C | 1 | -1 | -1 |
| D | 1 | -1 | -1 |
| Mode SS | |||
|---|---|---|---|
| Quadrant | BADHDUFLAG | Total packets | Discarded packets |
| A | 0 | 78 | 0 |
| B | 0 | 78 | 0 |
| C | 0 | 78 | 0 |
| D | 0 | 78 | 0 |
| Mode M0 | |||
|---|---|---|---|
| Quadrant | BADHDUFLAG | Total packets | Discarded packets |
| A | 0 | 9757 | 1 |
| B | 0 | 9134 | 1 |
| C | 0 | 9999 | 1 |
| D | 0 | 19695 | 1 |
| Quadrant | Total seconds | Saturated seconds | Saturation percentage |
|---|---|---|---|
| A | 3918 | 151 | 3.854007% |
| B | 3918 | 28 | 0.714650% |
| C | 3918 | 85 | 2.169474% |
| D | 3918 | 575 | 14.675855% |
Noise dominated data is calculated using 1-second bins in cleaned event files. If a bin has >2000 counts, and if more than 50% of those come from <1% of pixels, then it is considered to be noise-dominated and hence unusable.
| Quadrant | # 1 sec bins | Bins with >0 counts | Bins with >2000 counts | High rate bins dominated by noise | Noise dominated (total time) | Noise dominated (detector-on time) | Marked lightcurve |
|---|---|---|---|---|---|---|---|
| A | 3918 | 3918 | 112 | 112 | 2.86% | 2.86% | 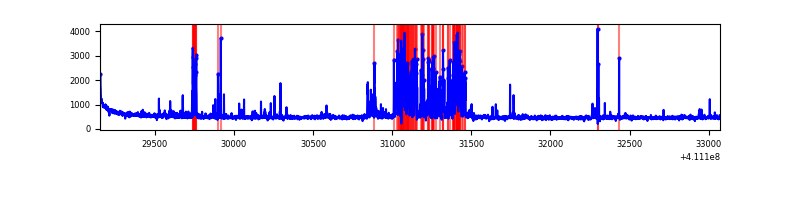 |
| B | 3918 | 3918 | 27 | 27 | 0.69% | 0.69% | 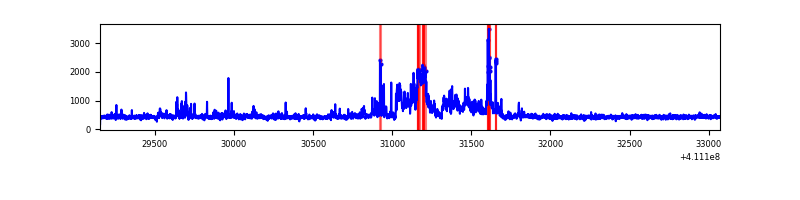 |
| C | 3918 | 3918 | 73 | 73 | 1.86% | 1.86% | 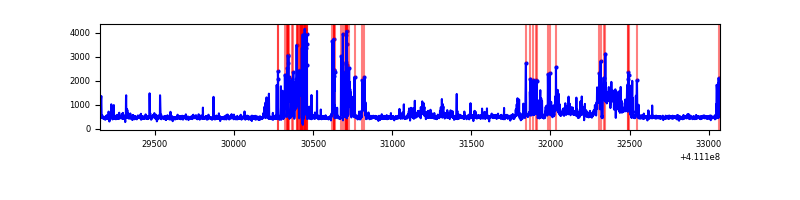 |
| D | 3918 | 3918 | 629 | 629 | 16.05% | 16.05% | 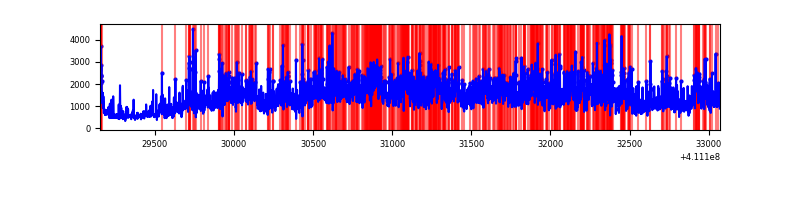 |
Top three noisy pixels from each quadrant. If the there are fewer than three noisy pixels in the level2.evt file, extra rows are filled as -1
| Pixel properties | Quadrant properties | ||||||
|---|---|---|---|---|---|---|---|
| Quadrant | DetID | PixID | Counts | Sigma | Mean | Median | Sigma |
| A | 13 | 248 | 564966 | 6585.66 | 415 | 406 | 85.7 |
| A | 10 | 83 | 281652 | 3280.77 | 415 | 406 | 85.7 |
| A | 13 | 254 | 4701 | 50.1 | 415 | 406 | 85.7 |
| B | 6 | 203 | 348083 | 4269.26 | 417 | 405 | 81.4 |
| B | 4 | 170 | 75987 | 928.1 | 417 | 405 | 81.4 |
| B | 5 | 172 | 58253 | 710.34 | 417 | 405 | 81.4 |
| C | 15 | 208 | 685859 | 7153.71 | 407 | 409 | 95.8 |
| C | 15 | 214 | 161186 | 1677.95 | 407 | 409 | 95.8 |
| C | 9 | 187 | 63524 | 658.7 | 407 | 409 | 95.8 |
| D | 12 | 235 | 3672280 | 37216.16 | 396 | 383 | 98.7 |
| D | 13 | 249 | 194116 | 1963.56 | 396 | 383 | 98.7 |
| D | 5 | 222 | 183923 | 1860.25 | 396 | 383 | 98.7 |
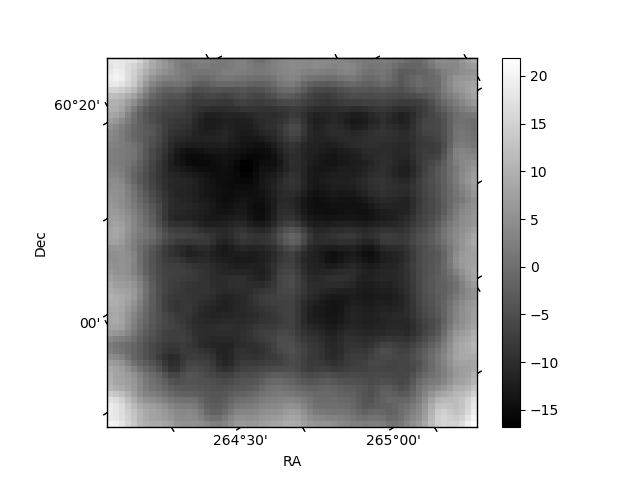
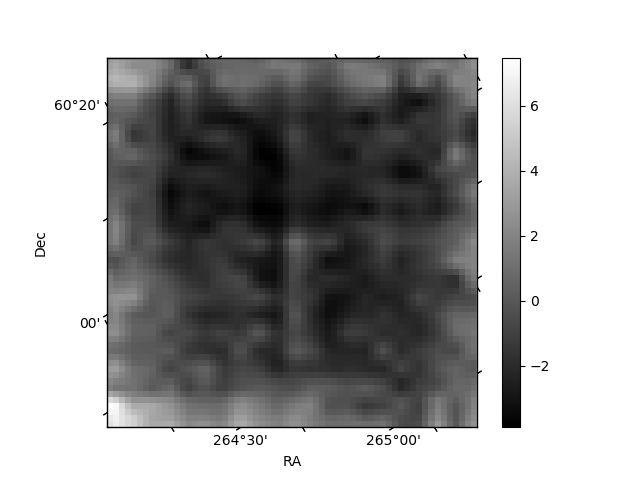
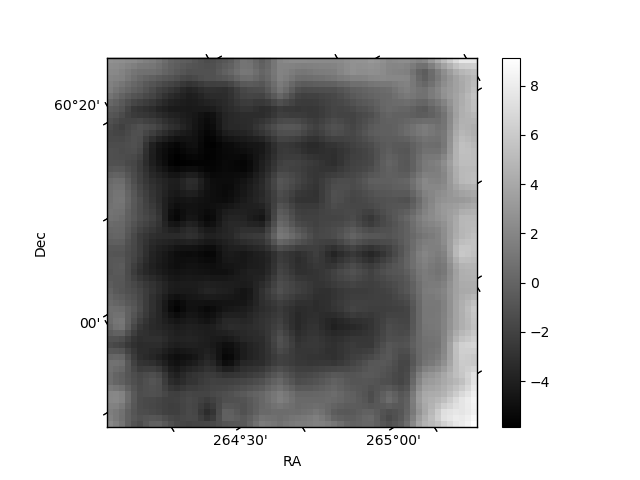
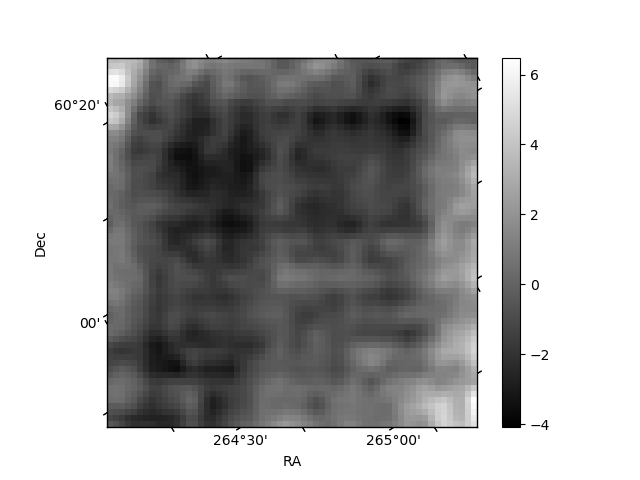
Histogram calculated using DETX and DETY for each event in the final _common_clean file
| Quadrant A | 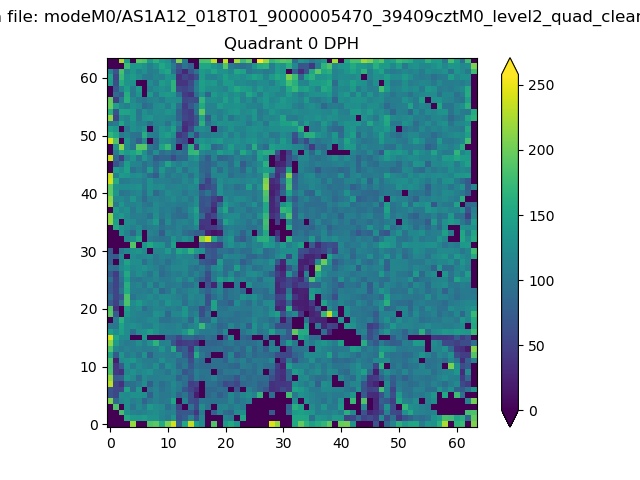 |
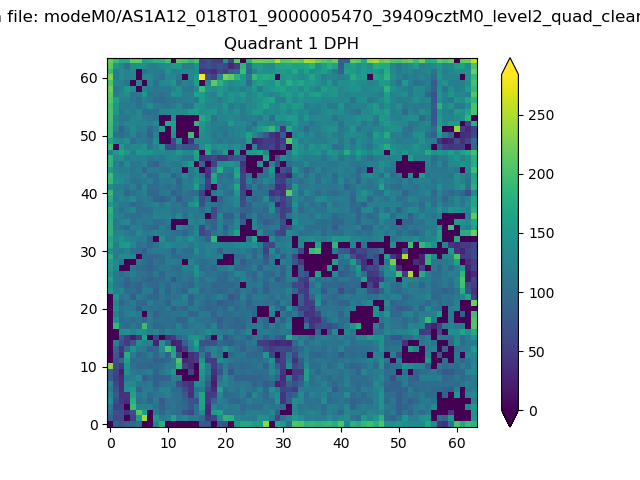 |
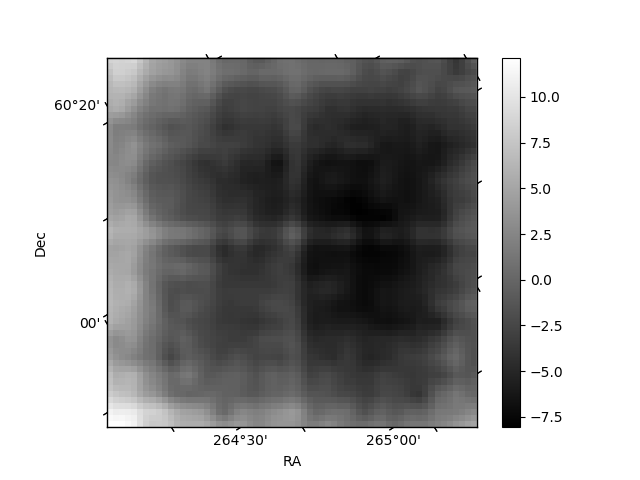
Quadrant B |
|---|---|---|---|
| Quadrant D | 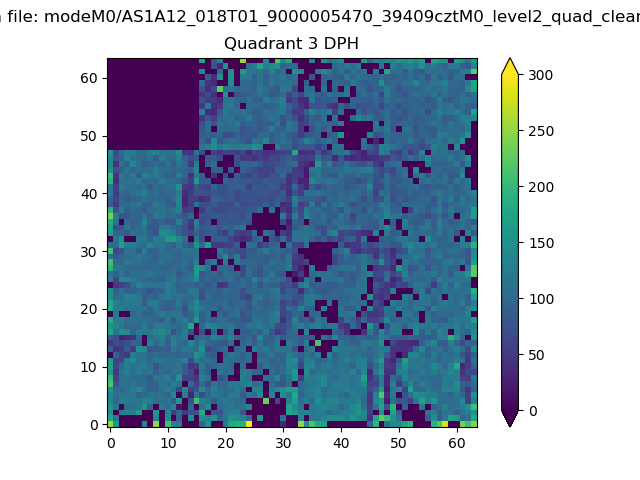 |
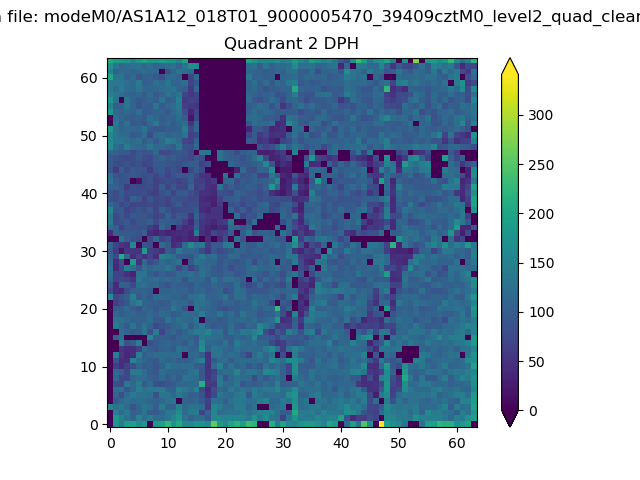 |
Quadrant C |
| Plot type | Count rate plots | Images |
|---|---|---|
| Comparison with Poisson distribution Blue bars denote a histogram of data divided into 1 sec bins. Red curve is a Poisson curve with rate = median count rate of data. |
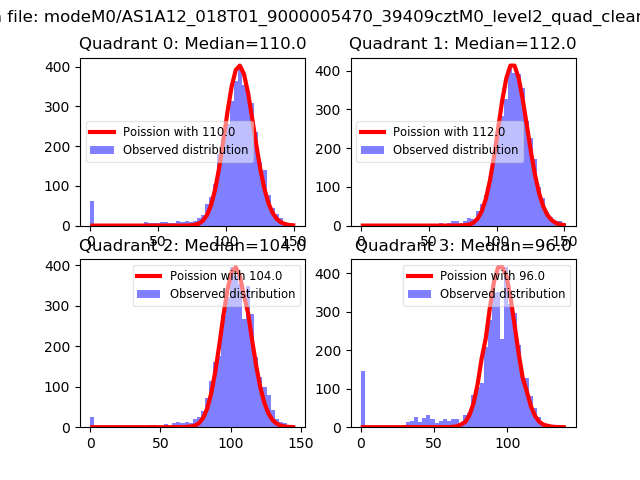 |
 |
| Quadrant-wise count rates Data is divided into 100 sec bins |
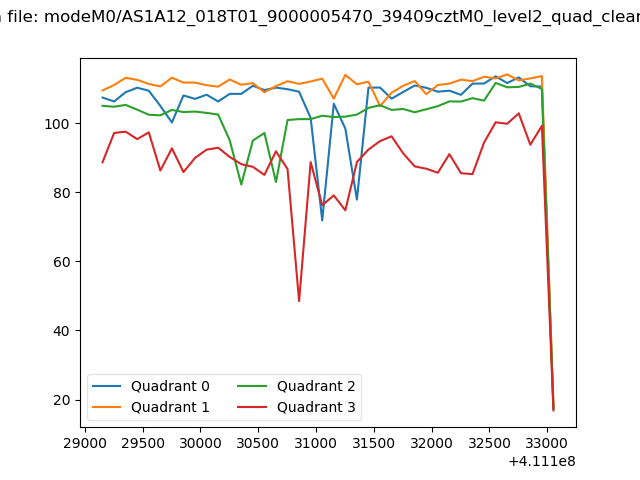 |
|
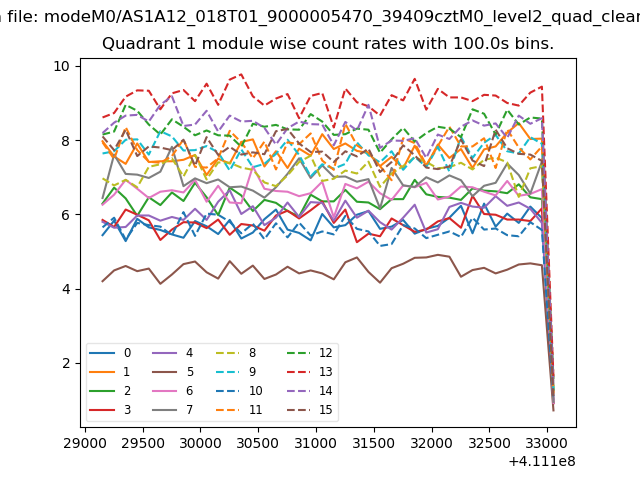
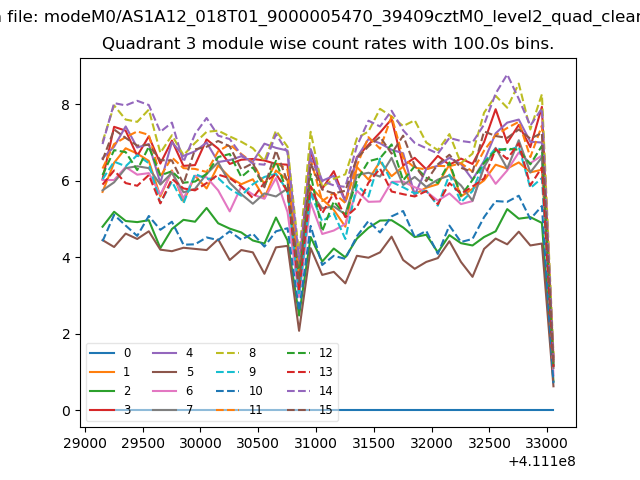
| Module-wise count rates for Quadrant A Data is divided into 100 sec bins |
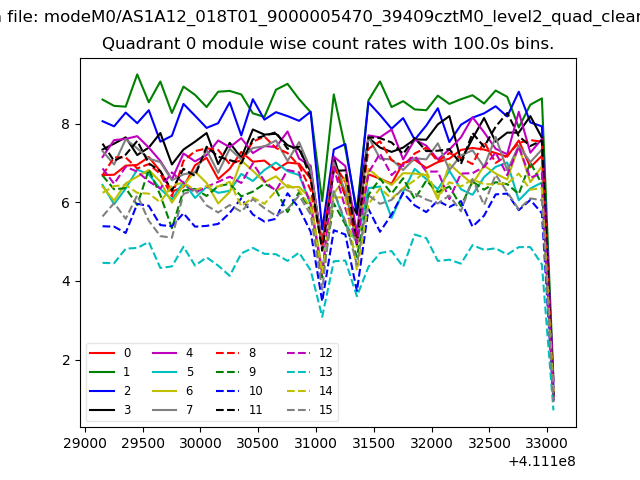 |
 |
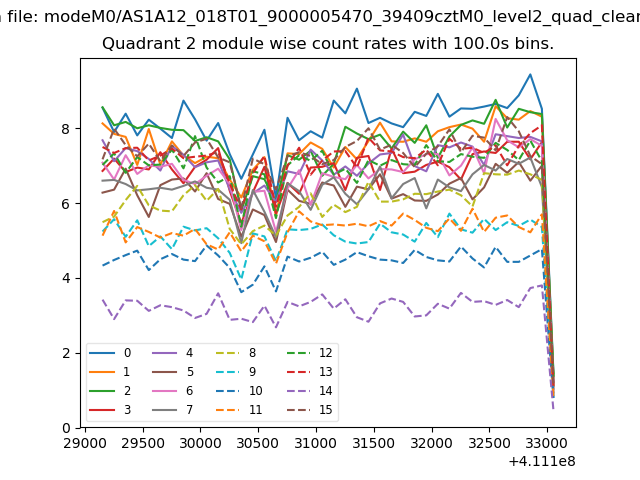
| Module-wise count rates for Quadrant B Data is divided into 100 sec bins |
 |
 |
| Module-wise count rates for Quadrant C Data is divided into 100 sec bins |
 |
 |
| Module-wise count rates for Quadrant D Data is divided into 100 sec bins |
 |
 |
| Parameter | Plot |
|---|---|
| CZT HV Monitor | 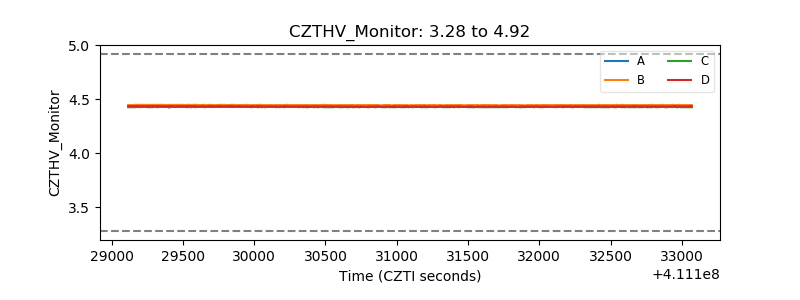 |
| D_VDD | 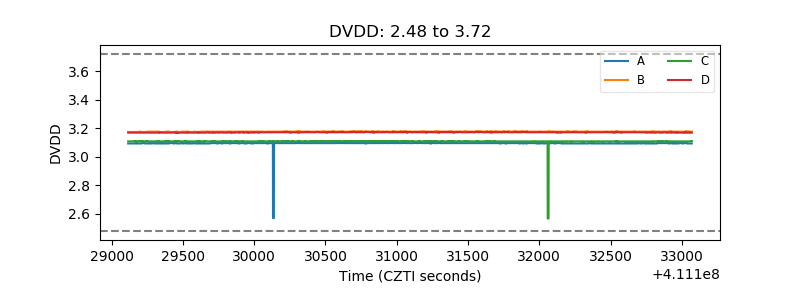 |
| Temperature 1 | 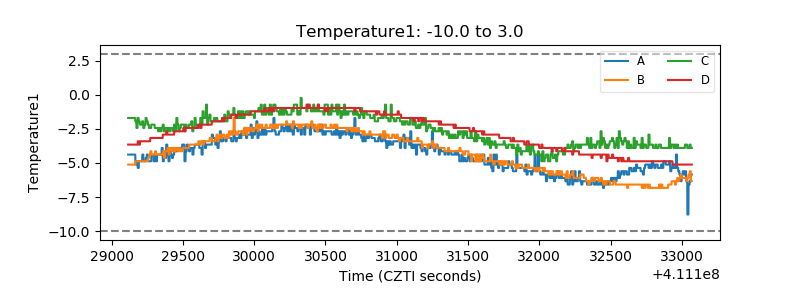 |
| Veto HV Monitor | 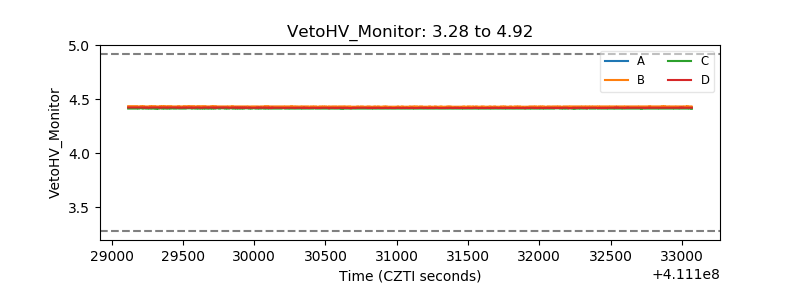 |
| Veto LLD | 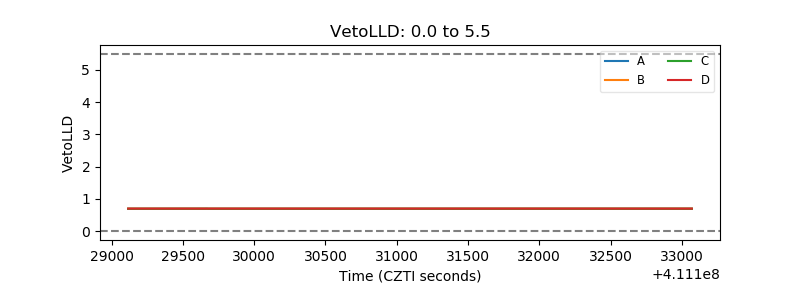 |
| Alpha Counter | 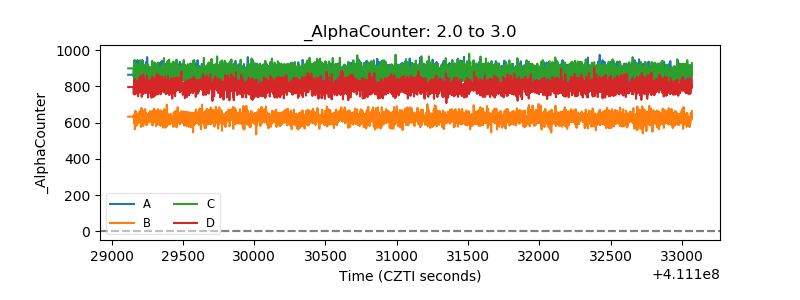 |
| _CPM_Rate | 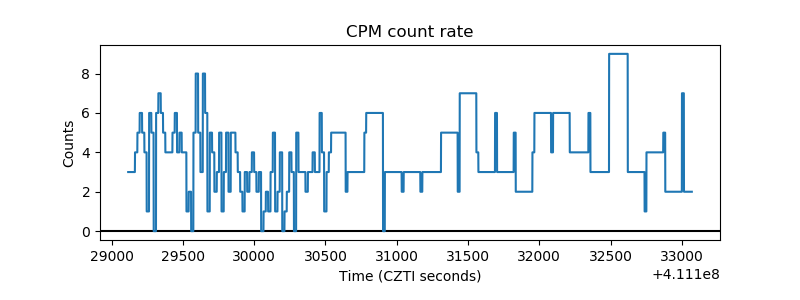 |
| CZT Counter | 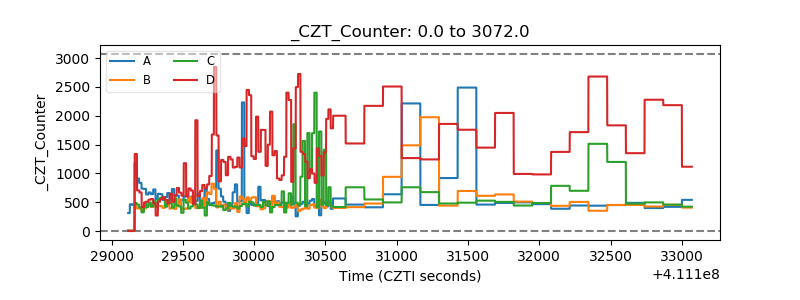 |
| +2.5 Volts monitor |  |
| +5 Volts monitor | 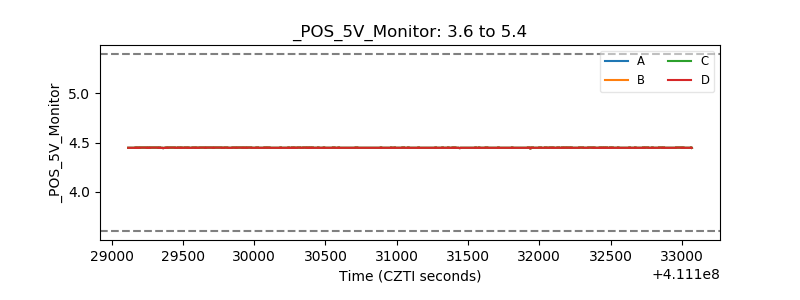 |
| _ROLL_ROT | 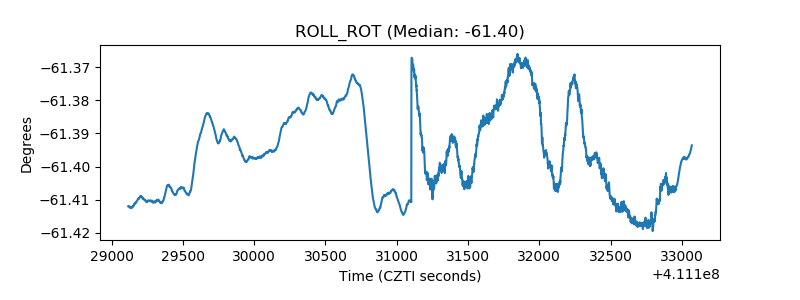 |
| _Roll_DEC | 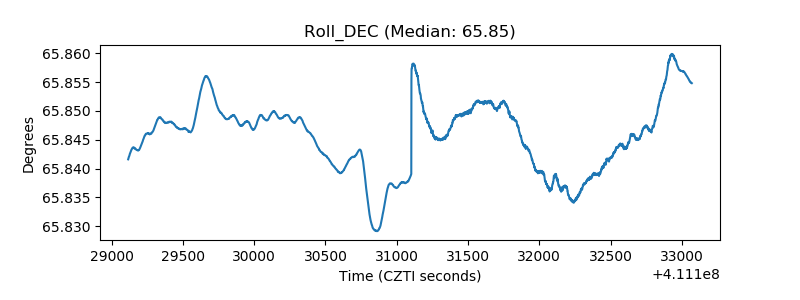 |
| _Roll_RA | 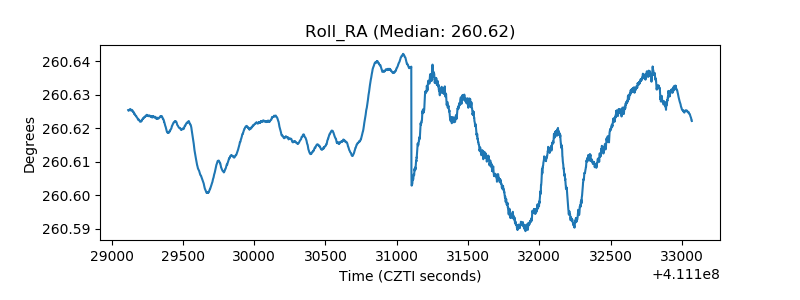 |
| Veto Counter | 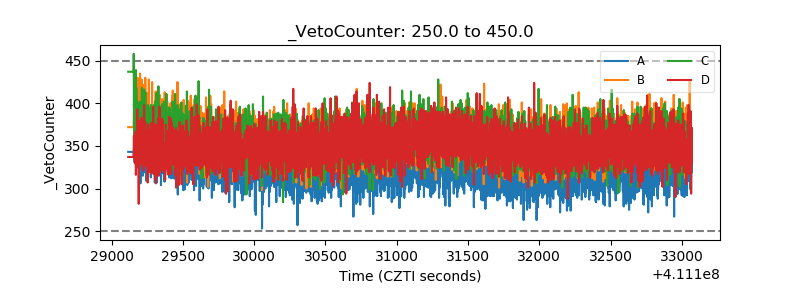 |