| Param | Original file | Final file |
|---|---|---|
| Filename | modeM0/AS1T05_074T01_9000005472_39409cztM0_level2.fits | modeM0/AS1T05_074T01_9000005472_39409cztM0_level2_quad_clean.evt |
| Size (bytes) | 100,589,760 | 18,313,920 |
| Size | 95.9 MB | 17.5 MB |
| Events in quadrant A | 1,150,404 | 105,227 |
| Events in quadrant B | 660,677 | 128,903 |
| Events in quadrant C | 754,009 | 122,554 |
| Events in quadrant D | 1,065,864 | 111,172 |
| Mode M9 | |||
|---|---|---|---|
| Quadrant | BADHDUFLAG | Total packets | Discarded packets |
| A | 0 | 14 | 0 |
| B | 0 | 14 | 0 |
| C | 0 | 14 | 0 |
| D | 0 | 14 | 0 |
| Mode M0 | |||
|---|---|---|---|
| Quadrant | BADHDUFLAG | Total packets | Discarded packets |
| A | 0 | 4167 | 2 |
| B | 0 | 2697 | 1 |
| C | 0 | 2939 | 1 |
| D | 0 | 4008 | 1 |
| Mode SS | |||
|---|---|---|---|
| Quadrant | BADHDUFLAG | Total packets | Discarded packets |
| A | 0 | 22 | 0 |
| B | 0 | 22 | 0 |
| C | 0 | 22 | 0 |
| D | 0 | 22 | 0 |
| Quadrant | Total seconds | Saturated seconds | Saturation percentage |
|---|---|---|---|
| A | 1153 | 235 | 20.381613% |
| B | 1153 | 51 | 4.423244% |
| C | 1153 | 27 | 2.341717% |
| D | 1153 | 53 | 4.596704% |
Noise dominated data is calculated using 1-second bins in cleaned event files. If a bin has >2000 counts, and if more than 50% of those come from <1% of pixels, then it is considered to be noise-dominated and hence unusable.
| Quadrant | # 1 sec bins | Bins with >0 counts | Bins with >2000 counts | High rate bins dominated by noise | Noise dominated (total time) | Noise dominated (detector-on time) | Marked lightcurve |
|---|---|---|---|---|---|---|---|
| A | 2466 | 1154 | 156 | 156 | 6.33% | 13.52% | 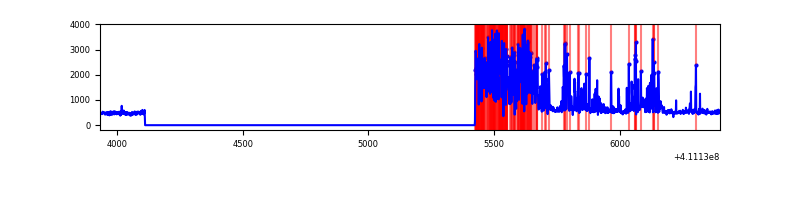 |
| B | 2466 | 1154 | 37 | 37 | 1.50% | 3.21% | 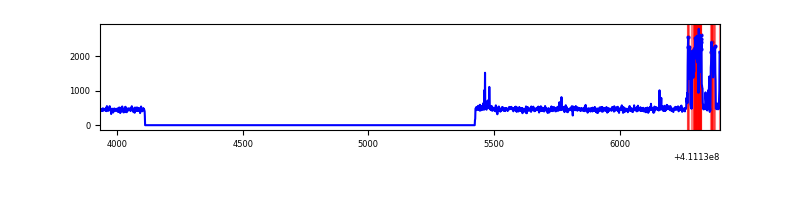 |
| C | 2466 | 1154 | 21 | 21 | 0.85% | 1.82% | 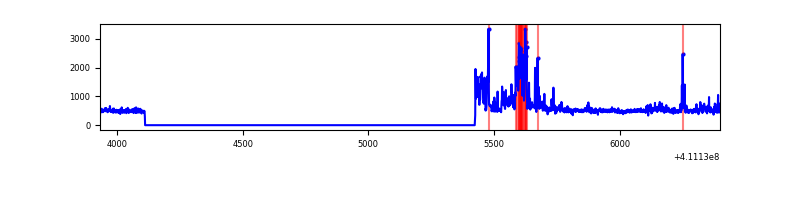 |
| D | 2466 | 1154 | 42 | 42 | 1.70% | 3.64% | 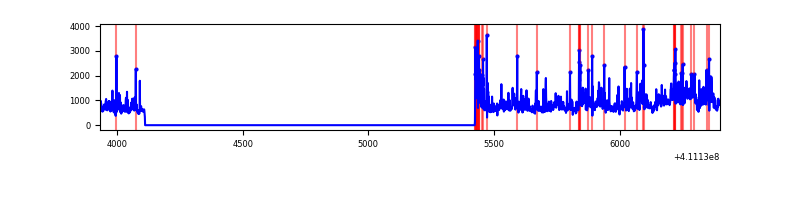 |
Top three noisy pixels from each quadrant. If the there are fewer than three noisy pixels in the level2.evt file, extra rows are filled as -1
| Pixel properties | Quadrant properties | ||||||
|---|---|---|---|---|---|---|---|
| Quadrant | DetID | PixID | Counts | Sigma | Mean | Median | Sigma |
| A | 13 | 248 | 564181 | 21000.68 | 121 | 119 | 26.9 |
| A | 10 | 83 | 111624 | 4151.46 | 121 | 119 | 26.9 |
| A | 2 | 79 | 2869 | 102.39 | 121 | 119 | 26.9 |
| B | 4 | 170 | 131136 | 4722.21 | 131 | 127 | 27.7 |
| B | 5 | 172 | 8826 | 313.55 | 131 | 127 | 27.7 |
| B | 12 | 111 | 3320 | 115.09 | 131 | 127 | 27.7 |
| C | 15 | 208 | 182652 | 5795.56 | 127 | 127 | 31.5 |
| C | 15 | 214 | 53060 | 1680.73 | 127 | 127 | 31.5 |
| C | 9 | 187 | 19380 | 611.32 | 127 | 127 | 31.5 |
| D | 12 | 235 | 465040 | 14119.9 | 126 | 122 | 32.9 |
| D | 13 | 249 | 50981 | 1544.63 | 126 | 122 | 32.9 |
| D | 12 | 227 | 48714 | 1475.78 | 126 | 122 | 32.9 |
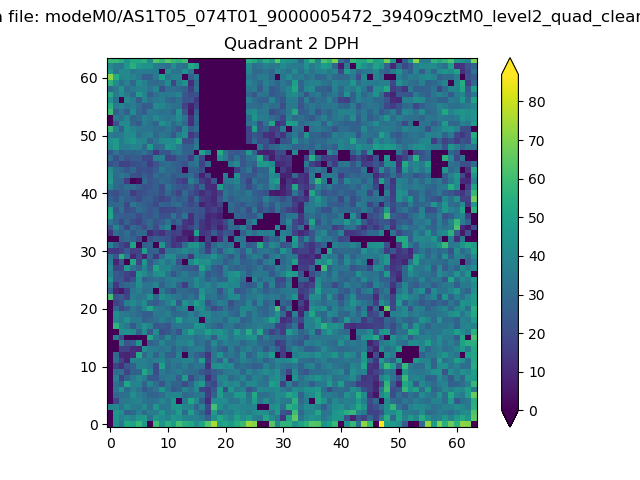
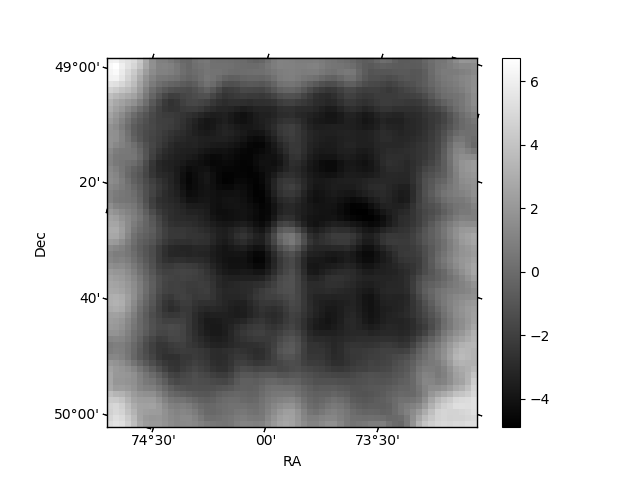
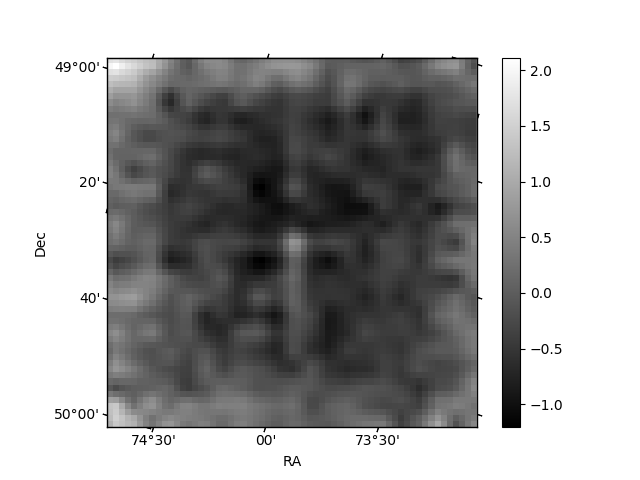
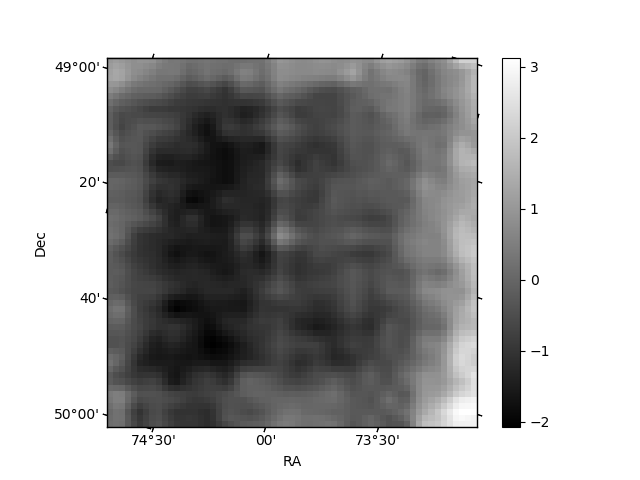
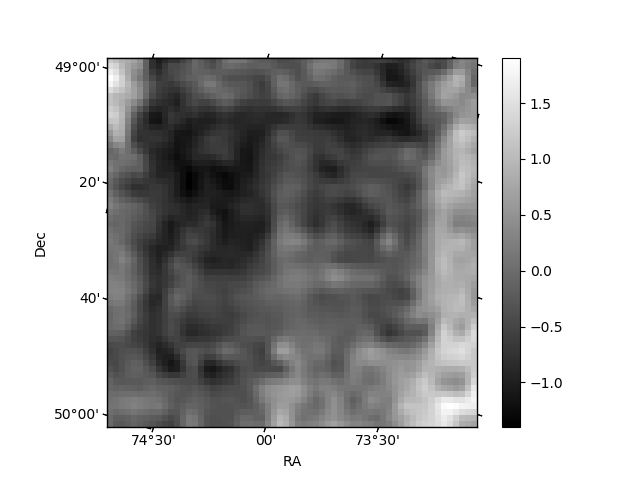
Histogram calculated using DETX and DETY for each event in the final _common_clean file
| Quadrant A | 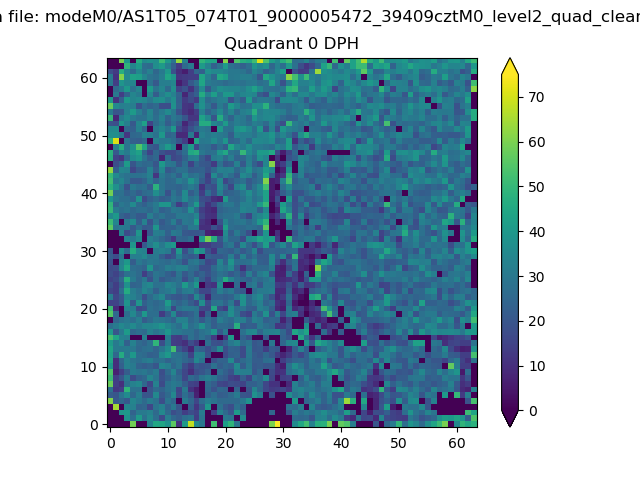 |
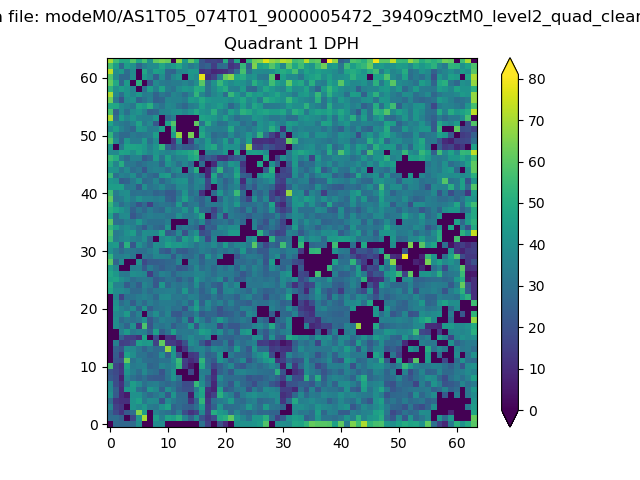 |
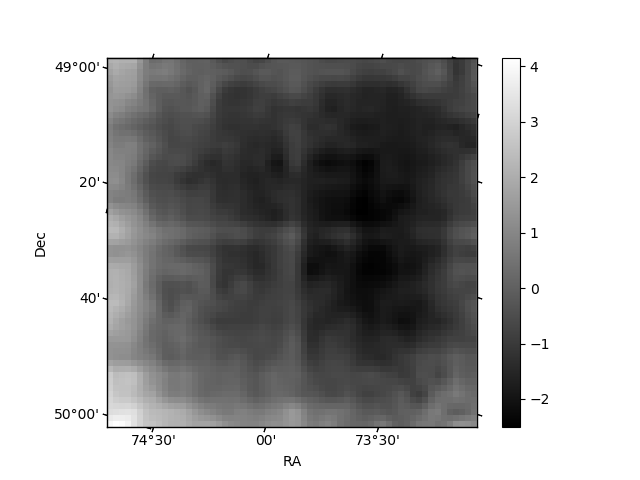
Quadrant B |
|---|---|---|---|
| Quadrant D | 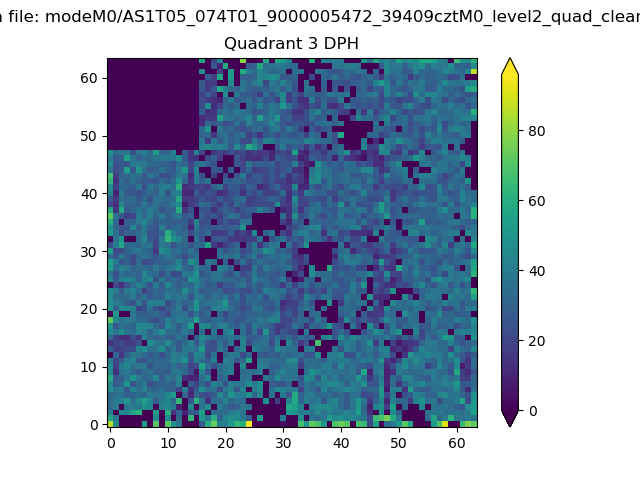 |
 |
Quadrant C |
| Plot type | Count rate plots | Images |
|---|---|---|
| Comparison with Poisson distribution Blue bars denote a histogram of data divided into 1 sec bins. Red curve is a Poisson curve with rate = median count rate of data. |
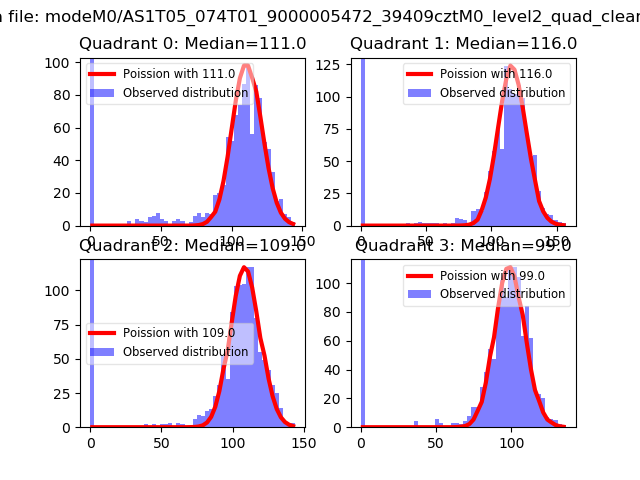 |
 |
| Quadrant-wise count rates Data is divided into 100 sec bins |
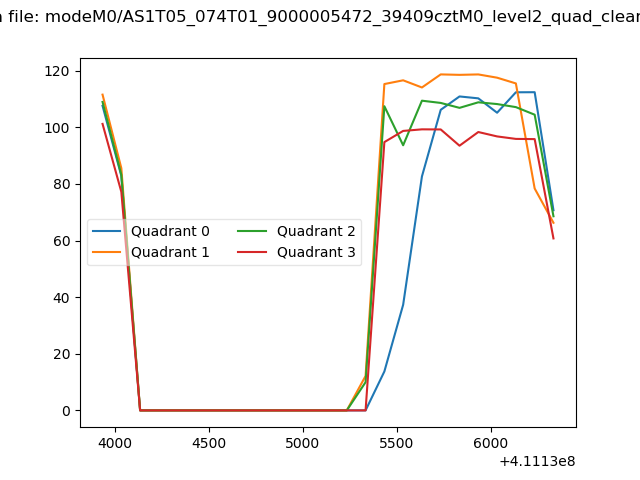 |
|
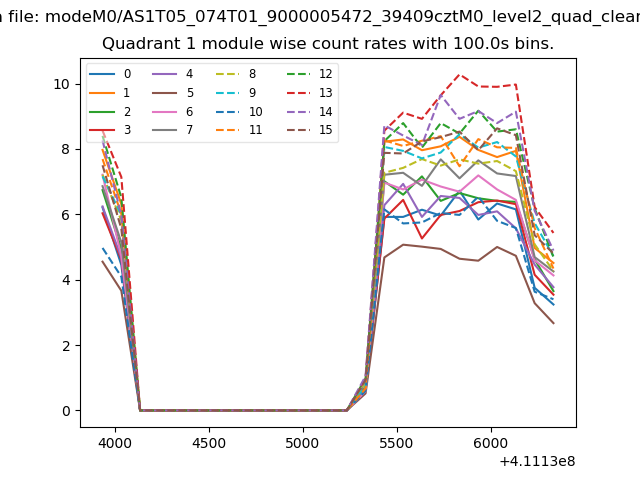
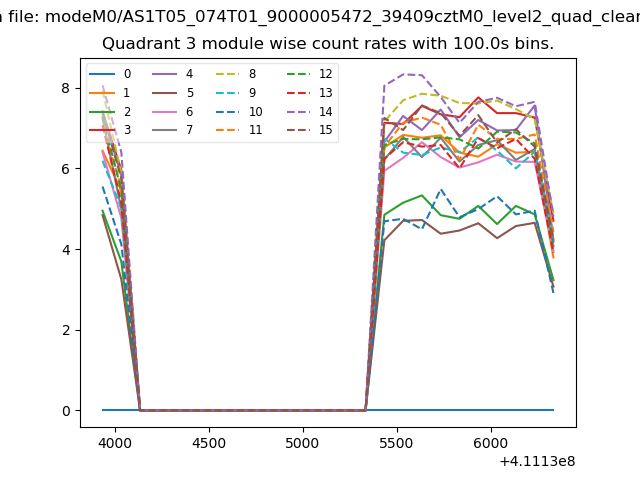
| Module-wise count rates for Quadrant A Data is divided into 100 sec bins |
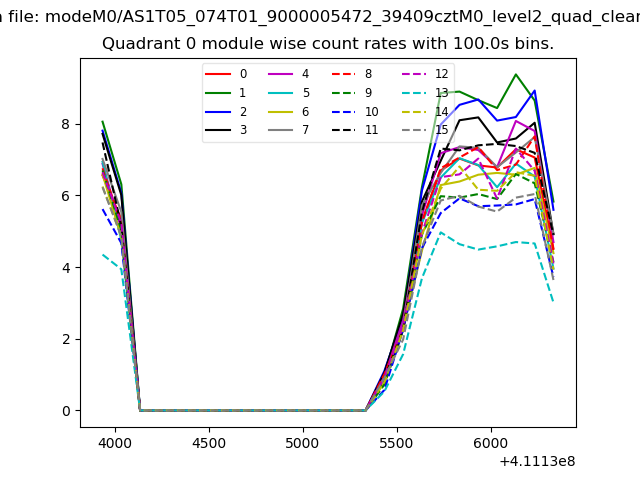 |
 |
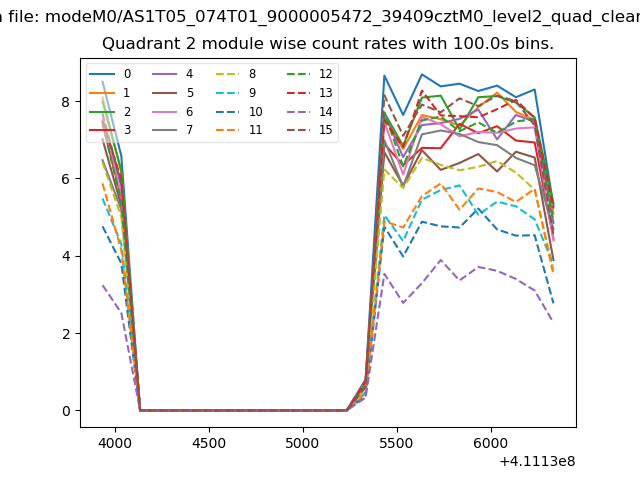
| Module-wise count rates for Quadrant B Data is divided into 100 sec bins |
 |
 |
| Module-wise count rates for Quadrant C Data is divided into 100 sec bins |
 |
 |
| Module-wise count rates for Quadrant D Data is divided into 100 sec bins |
 |
 |
| Parameter | Plot |
|---|---|
| CZT HV Monitor | 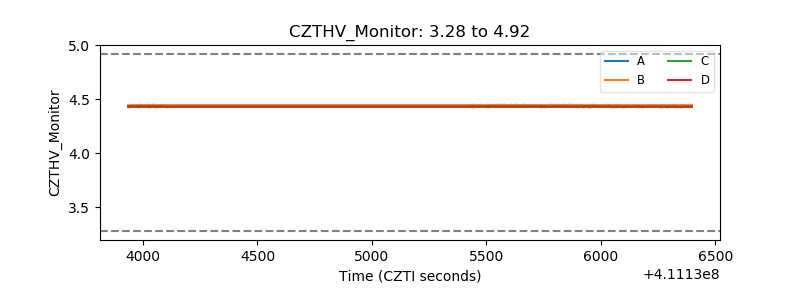 |
| D_VDD | 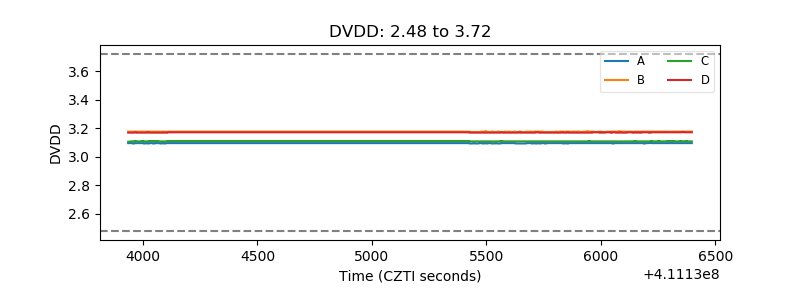 |
| Temperature 1 | 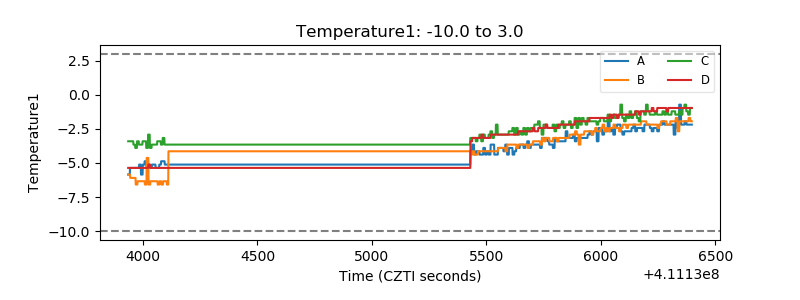 |
| Veto HV Monitor | 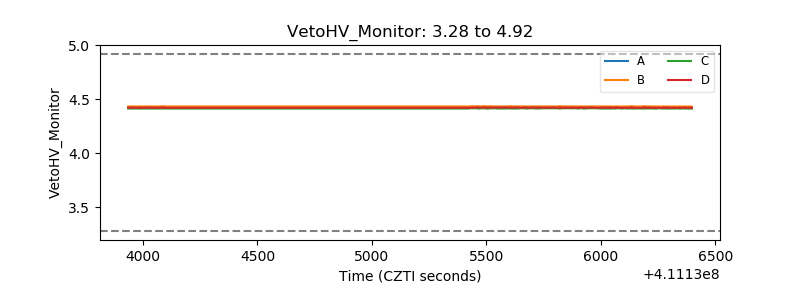 |
| Veto LLD | 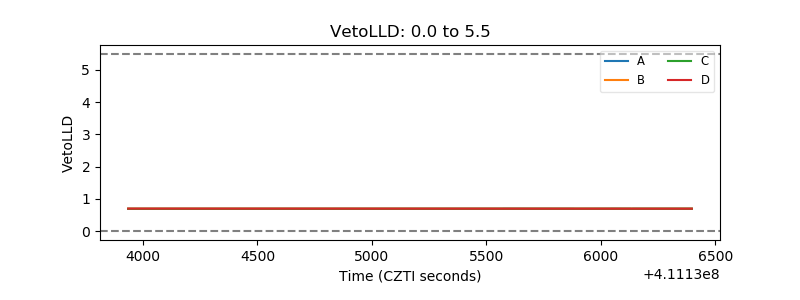 |
| Alpha Counter | 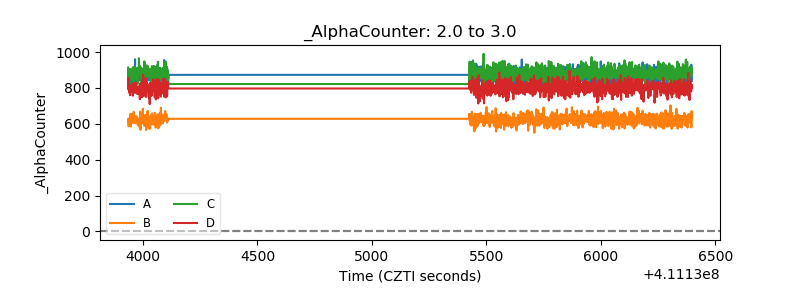 |
| _CPM_Rate |  |
| CZT Counter | 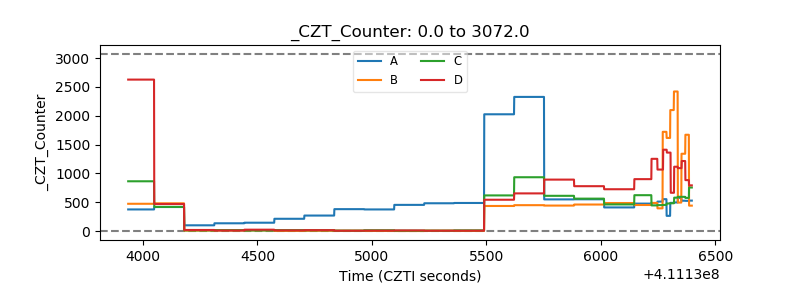 |
| +2.5 Volts monitor | 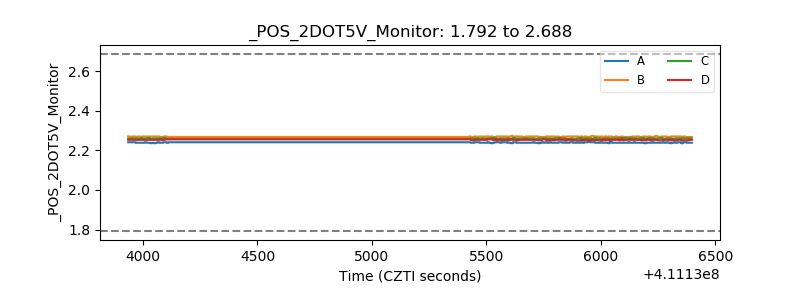 |
| +5 Volts monitor | 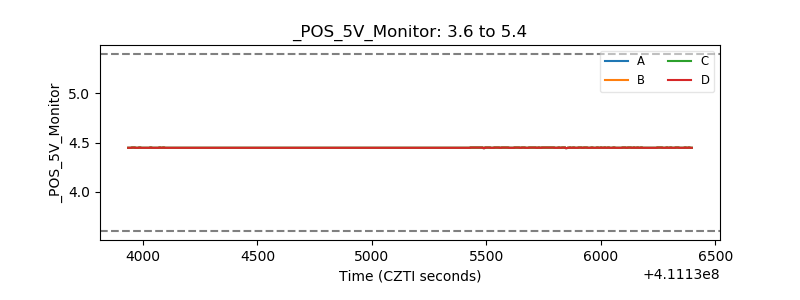 |
| _ROLL_ROT | 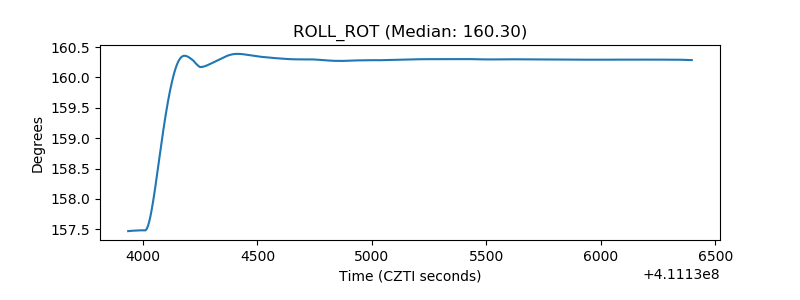 |
| _Roll_DEC | 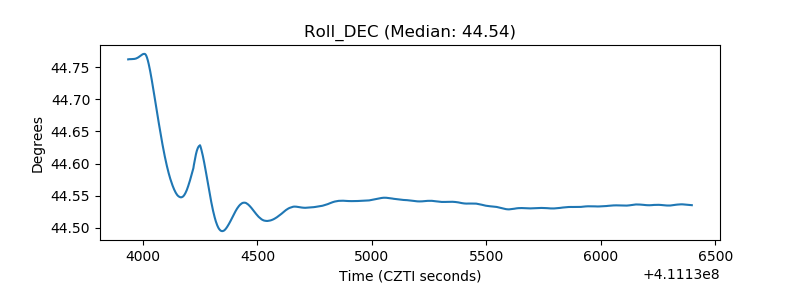 |
| _Roll_RA | 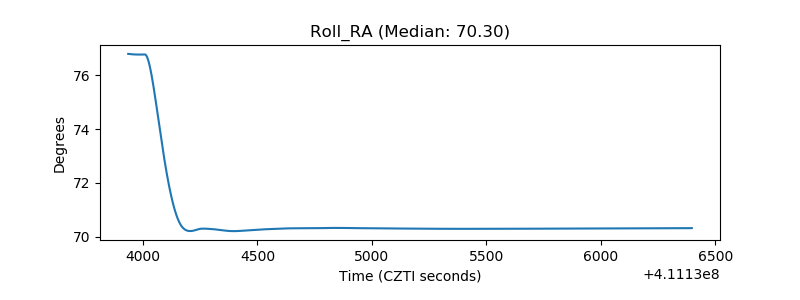 |
| Veto Counter | 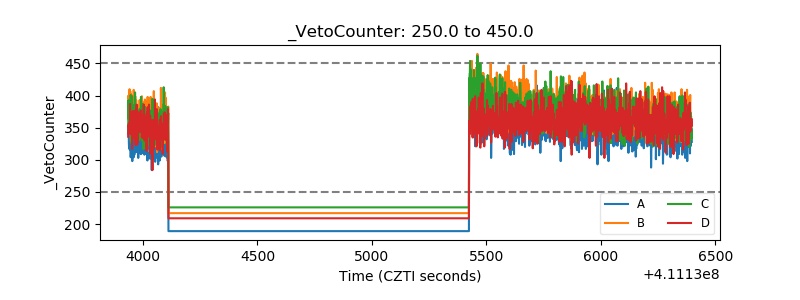 |