| Param | Original file | Final file |
|---|---|---|
| Filename | modeM0/AS1T05_074T01_9000005472_39411cztM0_level2.fits | modeM0/AS1T05_074T01_9000005472_39411cztM0_level2_quad_clean.evt |
| Size (bytes) | 1,091,462,400 | 166,956,480 |
| Size | 1.0 GB | 159.2 MB |
| Events in quadrant A | 6,387,193 | 1,160,920 |
| Events in quadrant B | 9,029,407 | 1,096,657 |
| Events in quadrant C | 8,850,522 | 1,107,681 |
| Events in quadrant D | 15,309,055 | 947,219 |
| Mode M9 | |||
|---|---|---|---|
| Quadrant | BADHDUFLAG | Total packets | Discarded packets |
| A | 0 | 28 | 0 |
| B | 0 | 28 | 0 |
| C | 0 | 28 | 0 |
| D | 0 | 28 | 0 |
| Mode M0 | |||
|---|---|---|---|
| Quadrant | BADHDUFLAG | Total packets | Discarded packets |
| A | 0 | 25754 | 4 |
| B | 0 | 34154 | 3 |
| C | 0 | 33245 | 3 |
| D | 0 | 53015 | 3 |
| Mode SS | |||
|---|---|---|---|
| Quadrant | BADHDUFLAG | Total packets | Discarded packets |
| A | 0 | 218 | 0 |
| B | 0 | 218 | 0 |
| C | 0 | 218 | 0 |
| D | 0 | 218 | 0 |
| Quadrant | Total seconds | Saturated seconds | Saturation percentage |
|---|---|---|---|
| A | 10717 | 290 | 2.705981% |
| B | 10717 | 1227 | 11.449100% |
| C | 10717 | 676 | 6.307735% |
| D | 10717 | 1819 | 16.973033% |
Noise dominated data is calculated using 1-second bins in cleaned event files. If a bin has >2000 counts, and if more than 50% of those come from <1% of pixels, then it is considered to be noise-dominated and hence unusable.
| Quadrant | # 1 sec bins | Bins with >0 counts | Bins with >2000 counts | High rate bins dominated by noise | Noise dominated (total time) | Noise dominated (detector-on time) | Marked lightcurve |
|---|---|---|---|---|---|---|---|
| A | 13524 | 10720 | 179 | 179 | 1.32% | 1.67% | 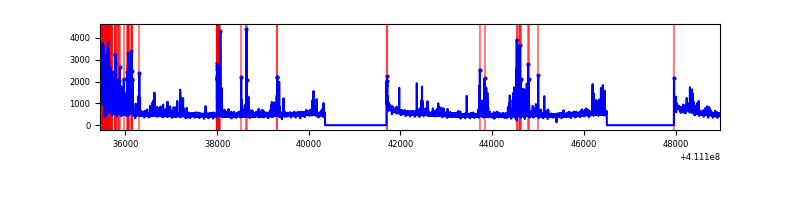 |
| B | 13524 | 10720 | 1087 | 1087 | 8.04% | 10.14% | 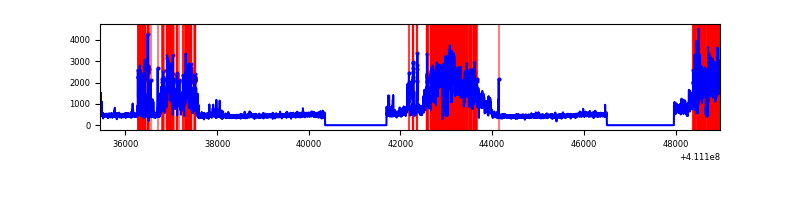 |
| C | 13524 | 10720 | 604 | 604 | 4.47% | 5.63% | 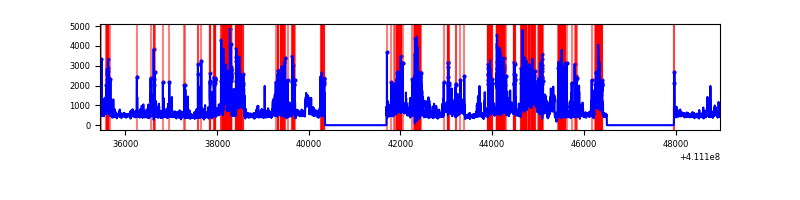 |
| D | 13524 | 10720 | 1994 | 1994 | 14.74% | 18.60% | 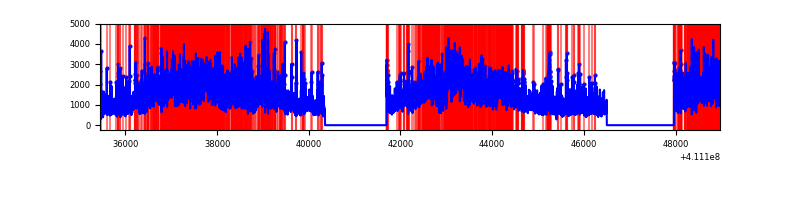 |
Top three noisy pixels from each quadrant. If the there are fewer than three noisy pixels in the level2.evt file, extra rows are filled as -1
| Pixel properties | Quadrant properties | ||||||
|---|---|---|---|---|---|---|---|
| Quadrant | DetID | PixID | Counts | Sigma | Mean | Median | Sigma |
| A | 13 | 248 | 999066 | 4192.92 | 1169 | 1145 | 238.0 |
| A | 10 | 83 | 776282 | 3256.86 | 1169 | 1145 | 238.0 |
| A | 7 | 192 | 30665 | 124.03 | 1169 | 1145 | 238.0 |
| B | 6 | 203 | 3411974 | 15501.48 | 1136 | 1100 | 220.0 |
| B | 4 | 170 | 517265 | 2345.83 | 1136 | 1100 | 220.0 |
| B | 5 | 172 | 436927 | 1980.71 | 1136 | 1100 | 220.0 |
| C | 15 | 208 | 3609930 | 13631.23 | 1133 | 1140 | 264.7 |
| C | 15 | 214 | 444258 | 1673.76 | 1133 | 1140 | 264.7 |
| C | 9 | 187 | 331106 | 1246.36 | 1133 | 1140 | 264.7 |
| D | 12 | 235 | 9325157 | 34731.48 | 1099 | 1069 | 268.5 |
| D | 12 | 227 | 1135773 | 4226.68 | 1099 | 1069 | 268.5 |
| D | 13 | 249 | 327373 | 1215.46 | 1099 | 1069 | 268.5 |
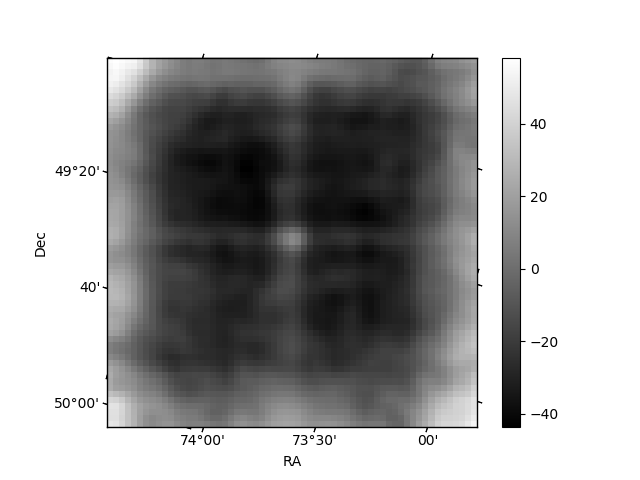
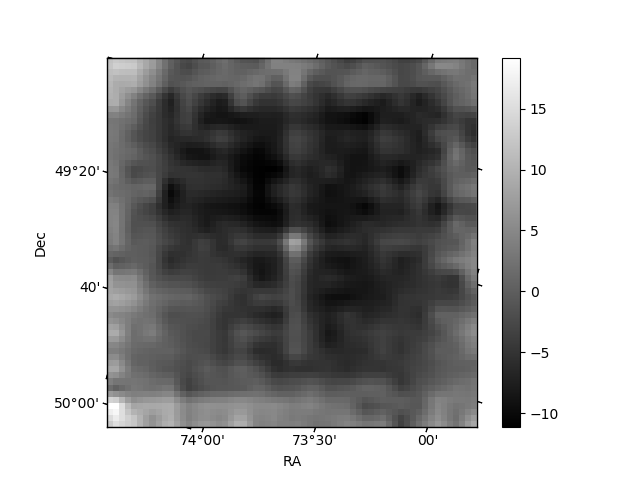
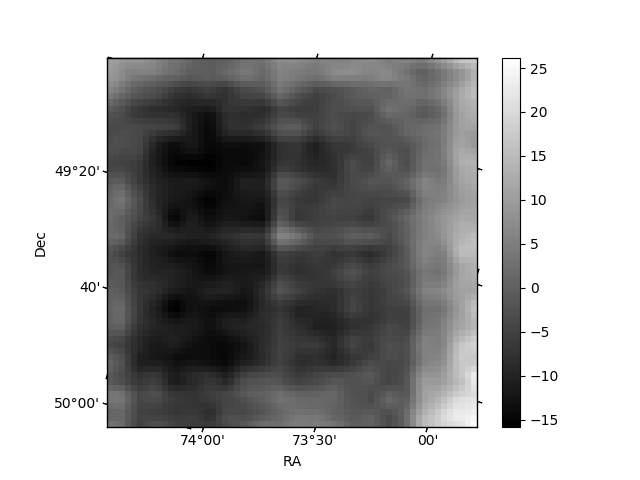
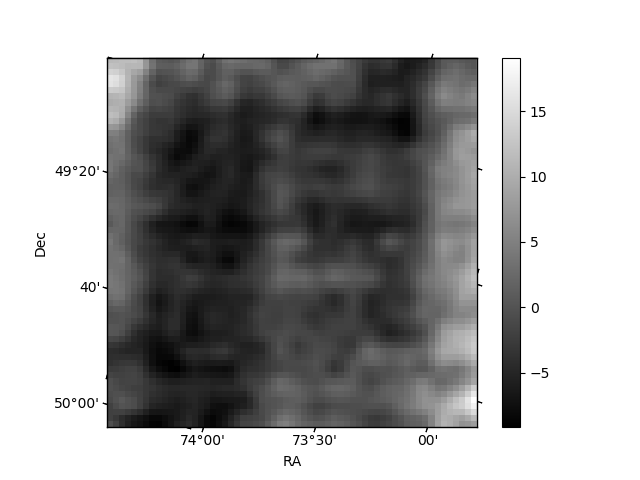
Histogram calculated using DETX and DETY for each event in the final _common_clean file
| Quadrant A | 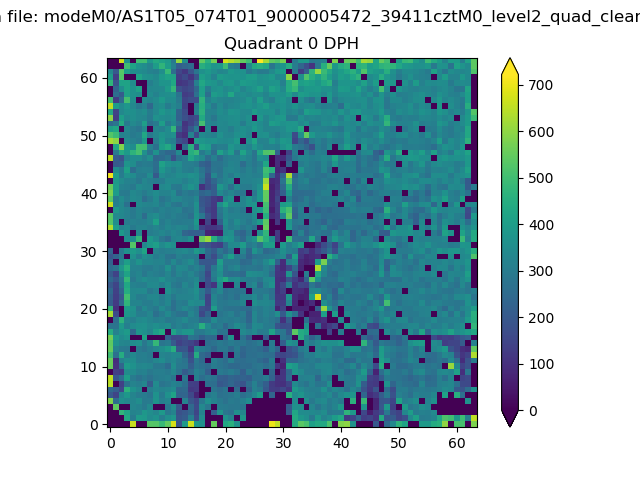 |
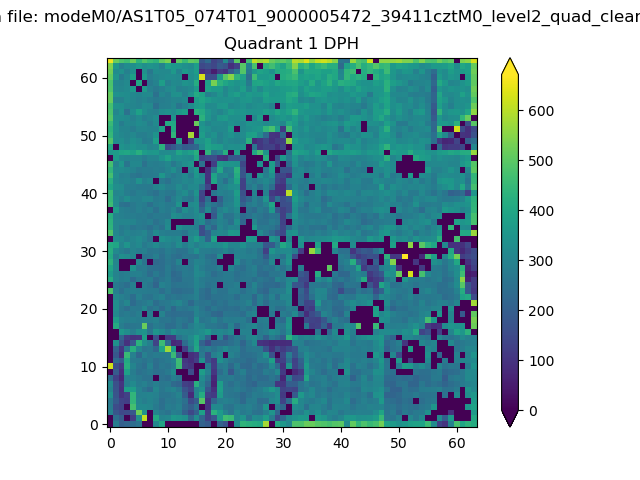 |
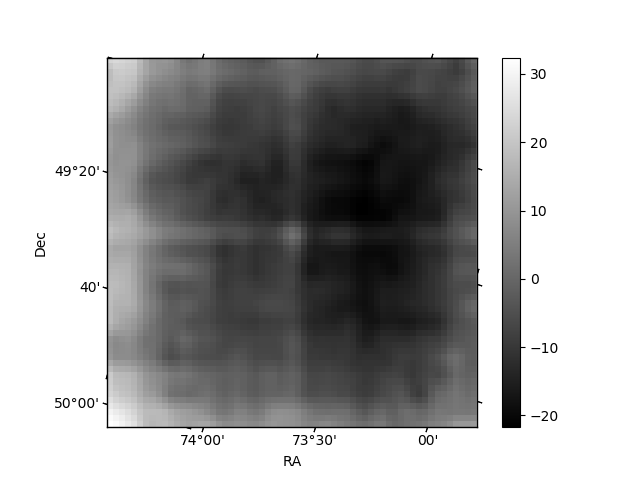
Quadrant B |
|---|---|---|---|
| Quadrant D | 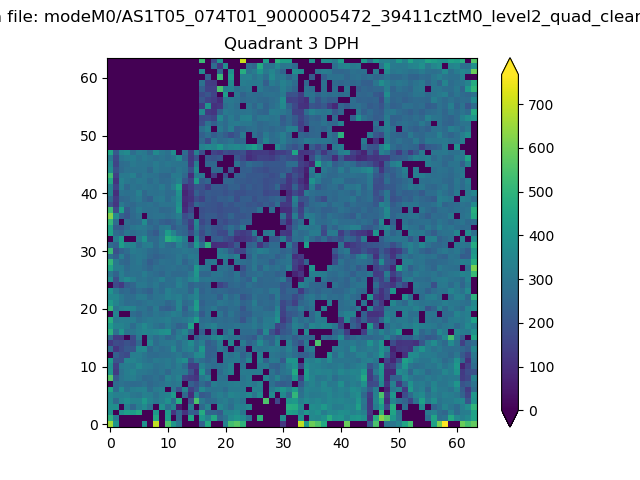 |
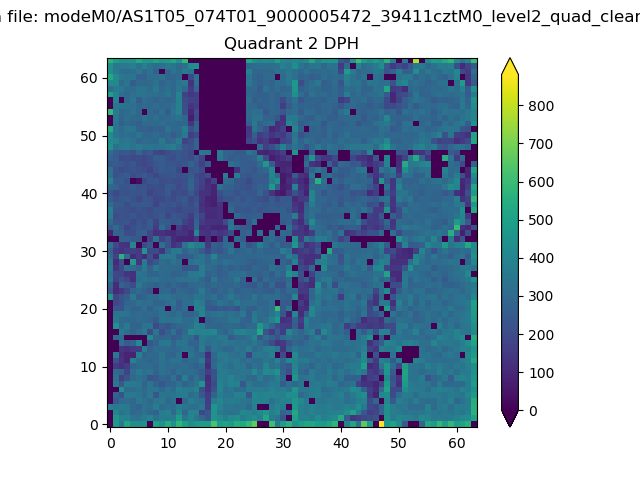 |
Quadrant C |
| Plot type | Count rate plots | Images |
|---|---|---|
| Comparison with Poisson distribution Blue bars denote a histogram of data divided into 1 sec bins. Red curve is a Poisson curve with rate = median count rate of data. |
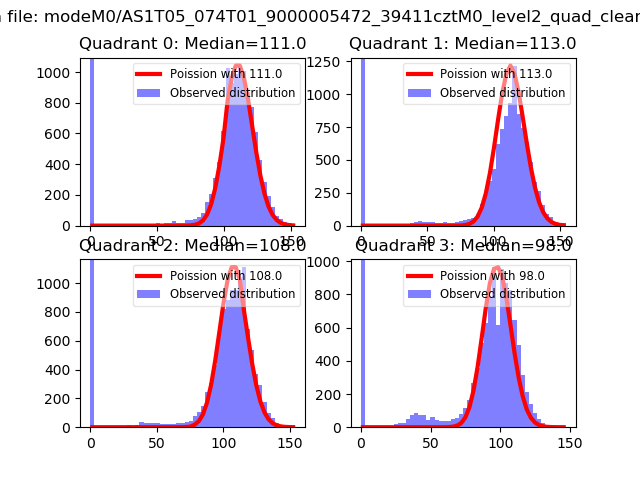 |
 |
| Quadrant-wise count rates Data is divided into 100 sec bins |
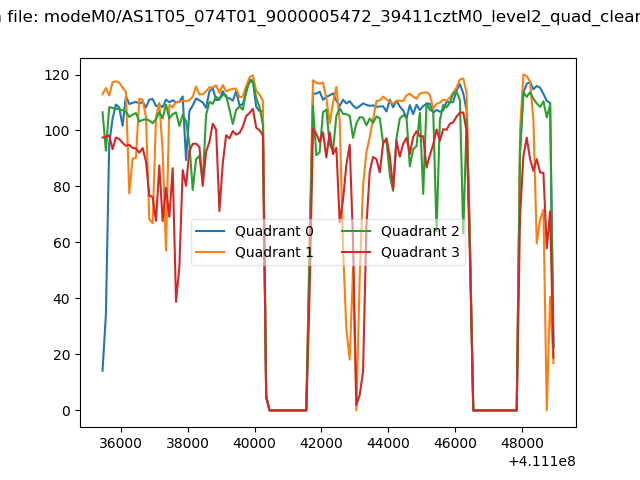 |
|
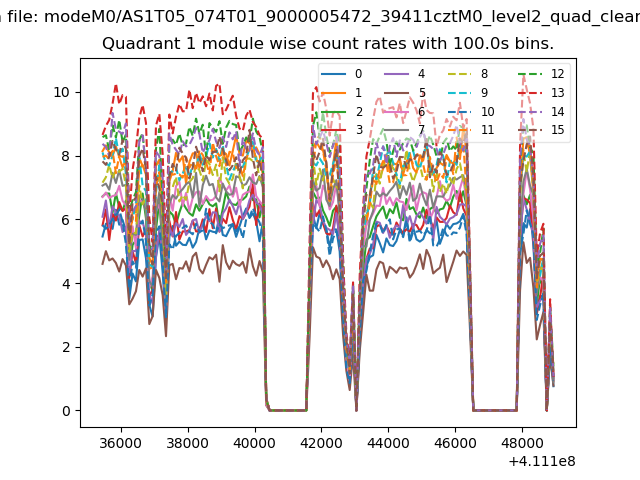
| Module-wise count rates for Quadrant A Data is divided into 100 sec bins |
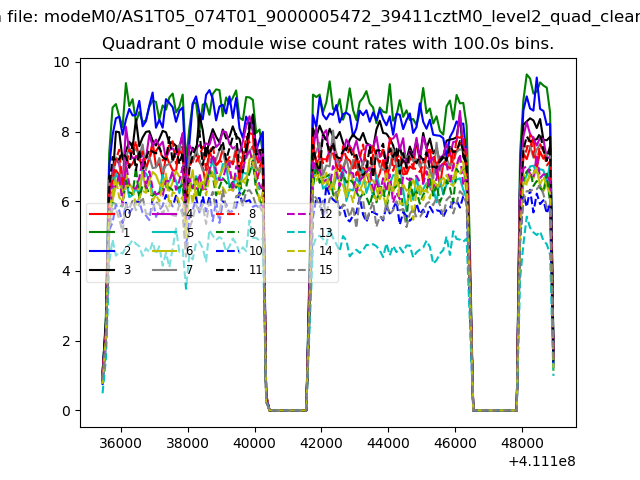 |
 |
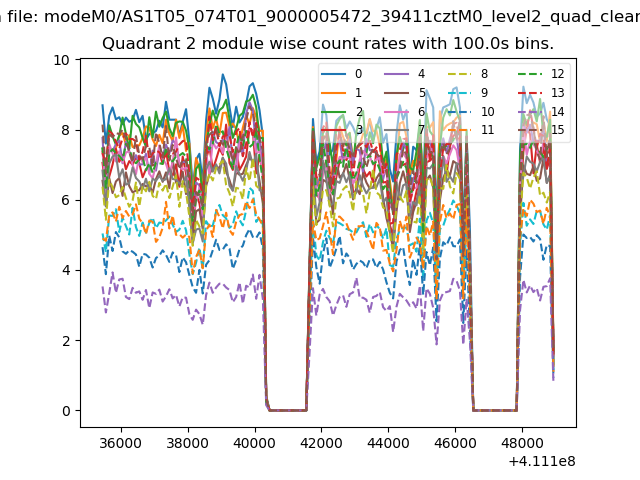
| Module-wise count rates for Quadrant B Data is divided into 100 sec bins |
 |
 |
| Module-wise count rates for Quadrant C Data is divided into 100 sec bins |
 |
 |
| Module-wise count rates for Quadrant D Data is divided into 100 sec bins |
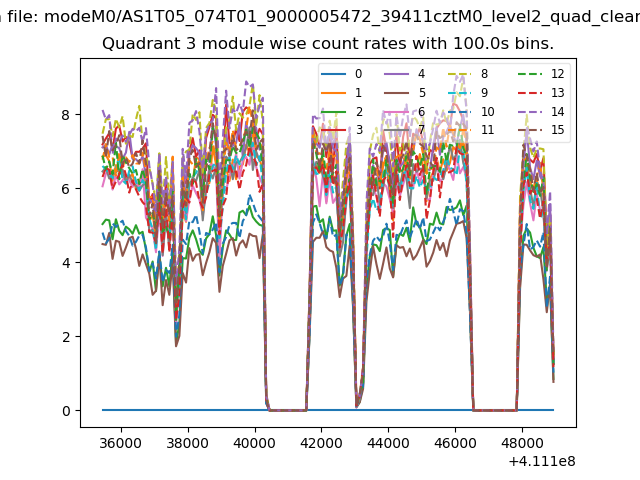 |
 |
| Parameter | Plot |
|---|---|
| CZT HV Monitor |  |
| D_VDD | 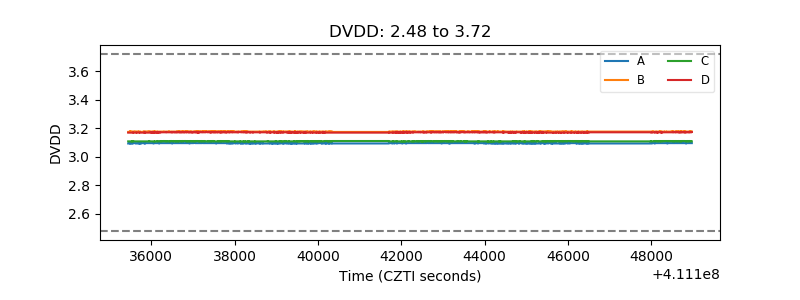 |
| Temperature 1 | 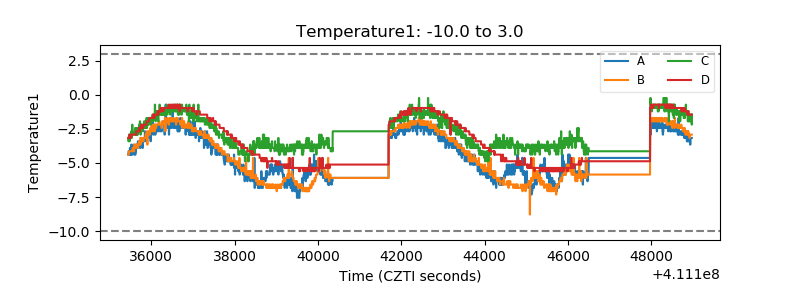 |
| Veto HV Monitor | 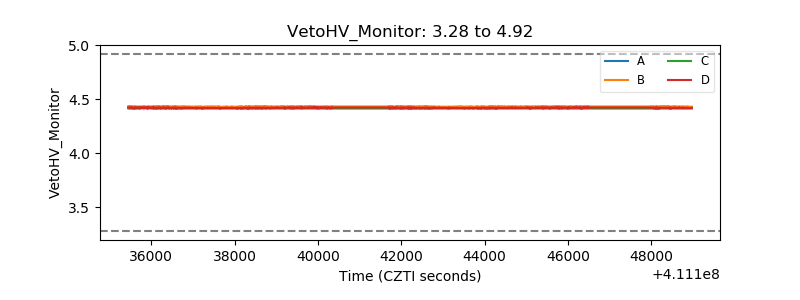 |
| Veto LLD | 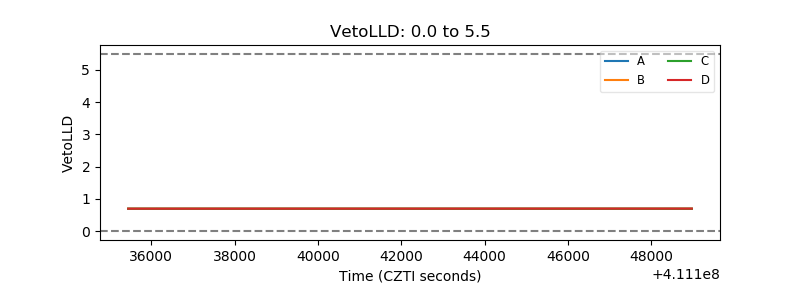 |
| Alpha Counter | 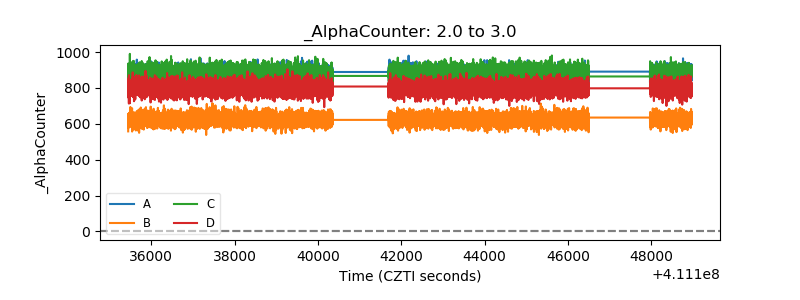 |
| _CPM_Rate | 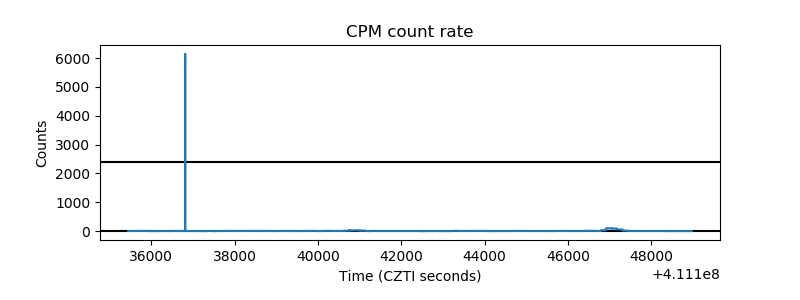 |
| CZT Counter | 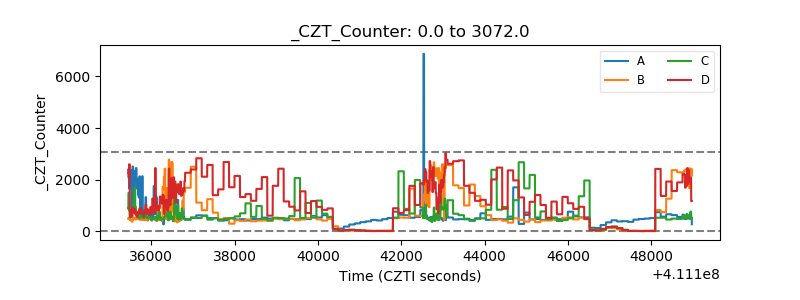 |
| +2.5 Volts monitor | 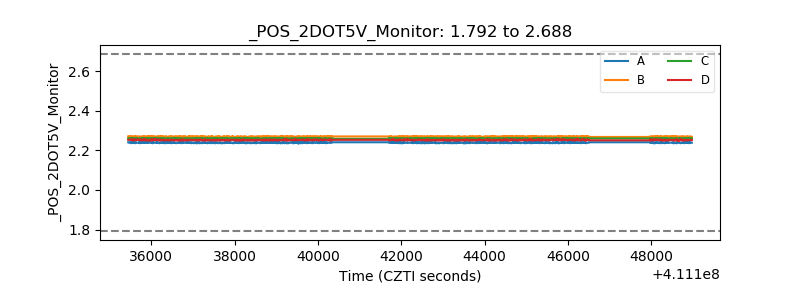 |
| +5 Volts monitor | 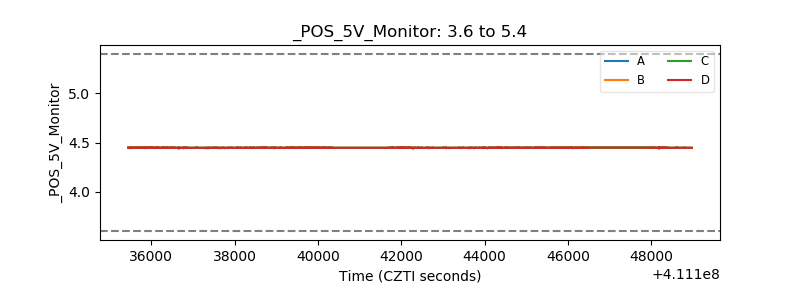 |
| _ROLL_ROT | 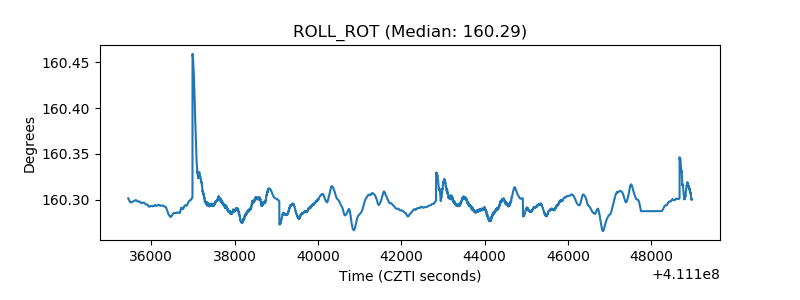 |
| _Roll_DEC | 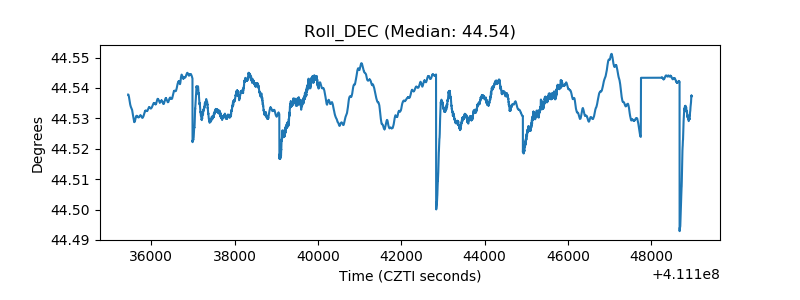 |
| _Roll_RA | 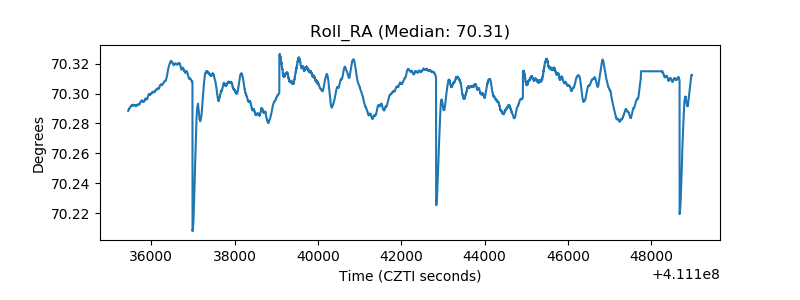 |
| Veto Counter | 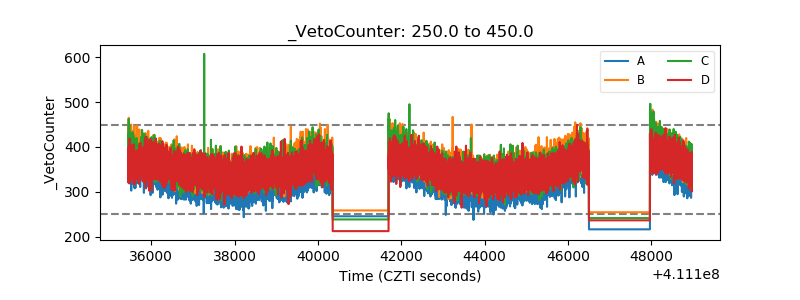 |