| Param | Original file | Final file |
|---|---|---|
| Filename | modeM0/AS1T05_074T01_9000005472_39412cztM0_level2.fits | modeM0/AS1T05_074T01_9000005472_39412cztM0_level2_quad_clean.evt |
| Size (bytes) | 587,606,400 | 85,668,480 |
| Size | 560.4 MB | 81.7 MB |
| Events in quadrant A | 3,023,590 | 630,731 |
| Events in quadrant B | 5,653,173 | 520,167 |
| Events in quadrant C | 4,205,827 | 586,196 |
| Events in quadrant D | 8,431,995 | 461,790 |
| Mode M9 | |||
|---|---|---|---|
| Quadrant | BADHDUFLAG | Total packets | Discarded packets |
| A | 0 | 17 | 0 |
| B | 0 | 17 | 0 |
| C | 0 | 17 | 0 |
| D | 0 | 18 | 0 |
| Mode M0 | |||
|---|---|---|---|
| Quadrant | BADHDUFLAG | Total packets | Discarded packets |
| A | 0 | 12635 | 3 |
| B | 0 | 20692 | 2 |
| C | 0 | 16030 | 2 |
| D | 0 | 29004 | 2 |
| Mode SS | |||
|---|---|---|---|
| Quadrant | BADHDUFLAG | Total packets | Discarded packets |
| A | 0 | 116 | 0 |
| B | 0 | 116 | 0 |
| C | 0 | 116 | 0 |
| D | 0 | 116 | 0 |
| Quadrant | Total seconds | Saturated seconds | Saturation percentage |
|---|---|---|---|
| A | 5639 | 18 | 0.319206% |
| B | 5639 | 1189 | 21.085299% |
| C | 5639 | 283 | 5.018620% |
| D | 5639 | 1364 | 24.188686% |
Noise dominated data is calculated using 1-second bins in cleaned event files. If a bin has >2000 counts, and if more than 50% of those come from <1% of pixels, then it is considered to be noise-dominated and hence unusable.
| Quadrant | # 1 sec bins | Bins with >0 counts | Bins with >2000 counts | High rate bins dominated by noise | Noise dominated (total time) | Noise dominated (detector-on time) | Marked lightcurve |
|---|---|---|---|---|---|---|---|
| A | 7192 | 5640 | 6 | 6 | 0.08% | 0.11% | 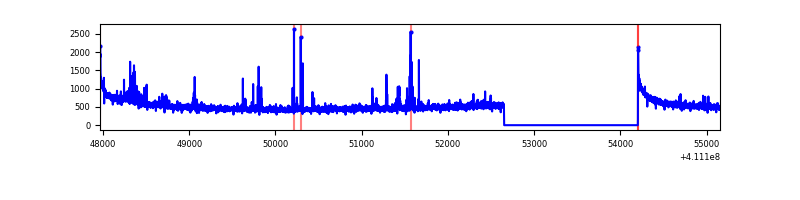 |
| B | 7192 | 5640 | 978 | 978 | 13.60% | 17.34% | 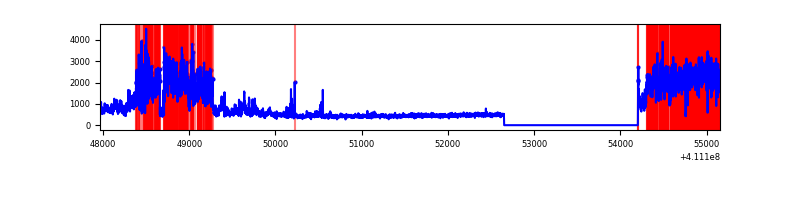 |
| C | 7192 | 5640 | 255 | 255 | 3.55% | 4.52% | 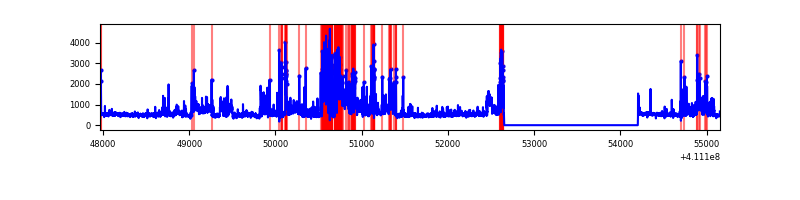 |
| D | 7192 | 5640 | 1338 | 1338 | 18.60% | 23.72% | 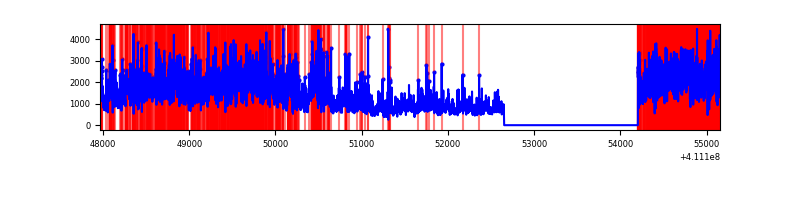 |
Top three noisy pixels from each quadrant. If the there are fewer than three noisy pixels in the level2.evt file, extra rows are filled as -1
| Pixel properties | Quadrant properties | ||||||
|---|---|---|---|---|---|---|---|
| Quadrant | DetID | PixID | Counts | Sigma | Mean | Median | Sigma |
| A | 10 | 83 | 469443 | 3718.26 | 617 | 605 | 126.1 |
| A | 13 | 248 | 100123 | 789.26 | 617 | 605 | 126.1 |
| A | 7 | 192 | 31251 | 243.05 | 617 | 605 | 126.1 |
| B | 6 | 203 | 2760126 | 24937.09 | 577 | 561 | 110.7 |
| B | 5 | 172 | 578992 | 5227.05 | 577 | 561 | 110.7 |
| B | 15 | 85 | 24336 | 214.85 | 577 | 561 | 110.7 |
| C | 15 | 208 | 1528700 | 10895.1 | 593 | 596 | 140.3 |
| C | 15 | 214 | 234566 | 1668.16 | 593 | 596 | 140.3 |
| C | 14 | 254 | 61385 | 433.41 | 593 | 596 | 140.3 |
| D | 12 | 235 | 5432435 | 39026.13 | 564 | 546 | 139.2 |
| D | 12 | 227 | 310191 | 2224.69 | 564 | 546 | 139.2 |
| D | 13 | 249 | 226196 | 1621.21 | 564 | 546 | 139.2 |
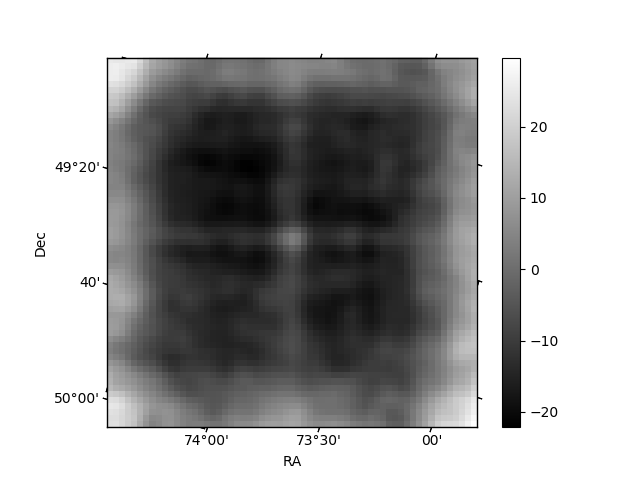
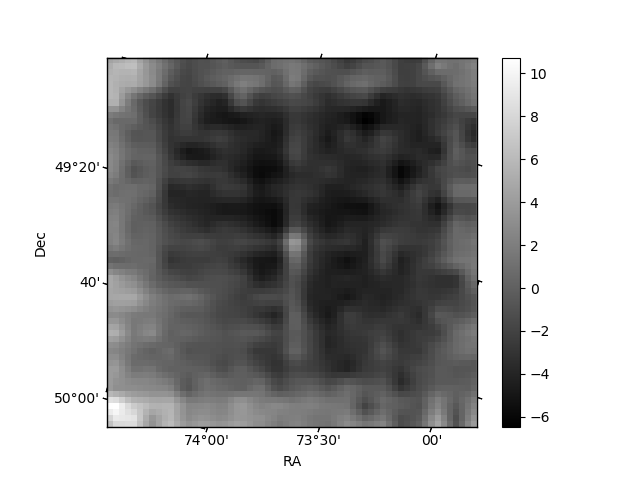
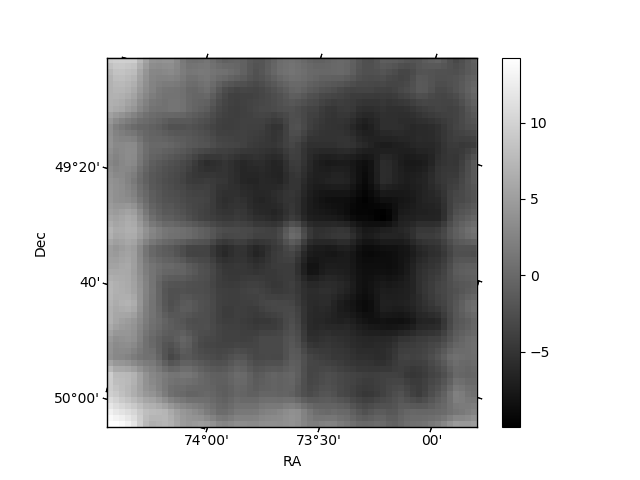
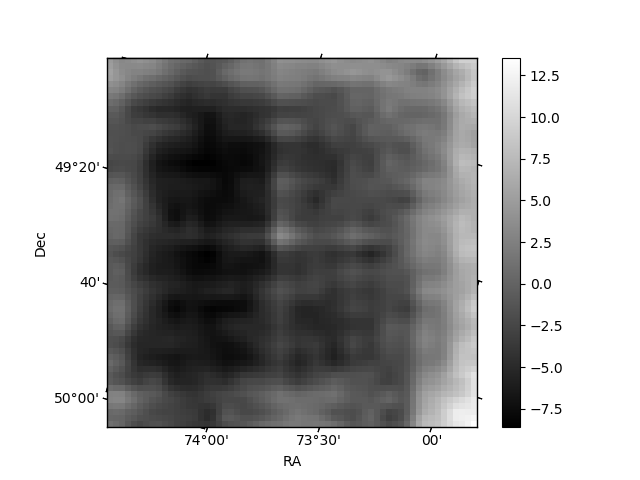
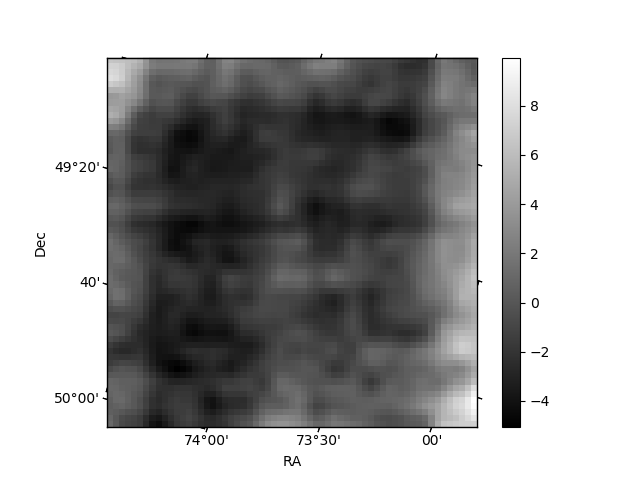
Histogram calculated using DETX and DETY for each event in the final _common_clean file
| Quadrant A | 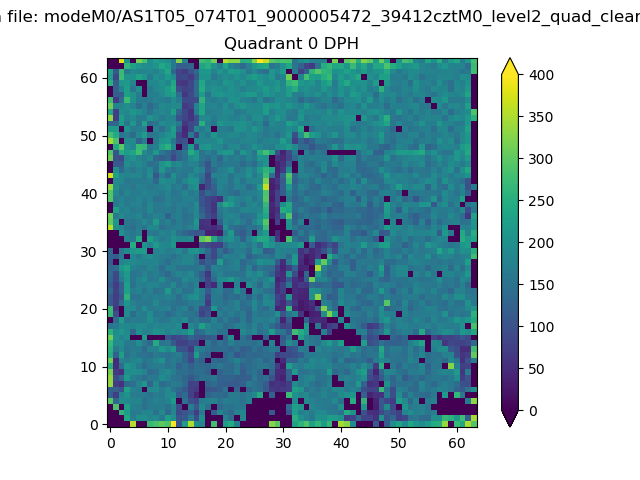 |
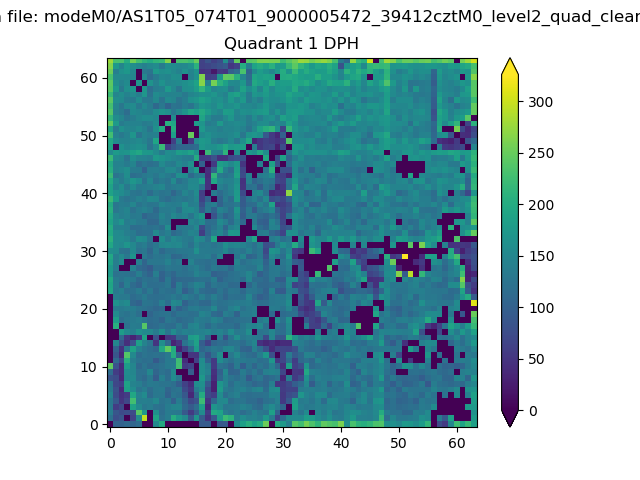 |
Quadrant B |
|---|---|---|---|
| Quadrant D | 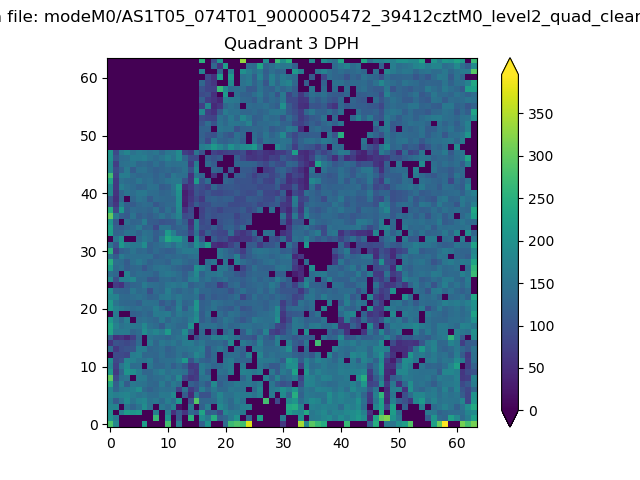 |
 |
Quadrant C |
| Plot type | Count rate plots | Images |
|---|---|---|
| Comparison with Poisson distribution Blue bars denote a histogram of data divided into 1 sec bins. Red curve is a Poisson curve with rate = median count rate of data. |
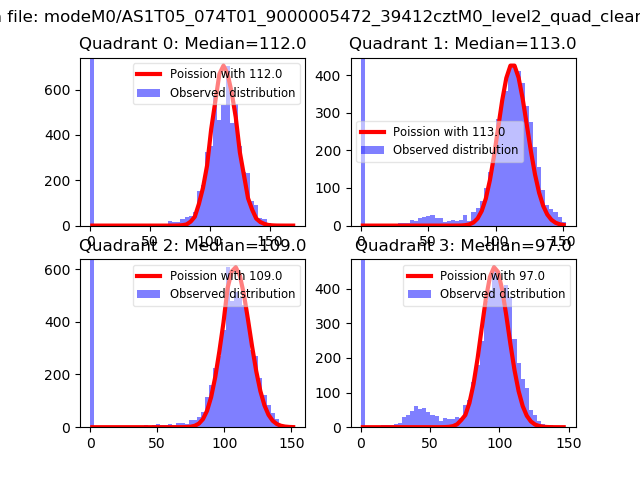 |
 |
| Quadrant-wise count rates Data is divided into 100 sec bins |
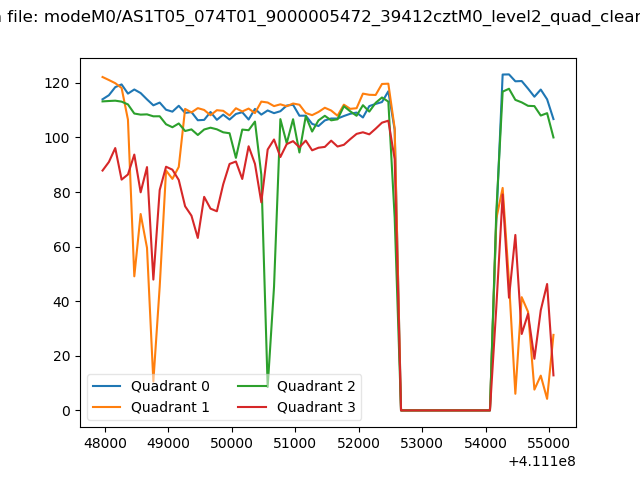 |
|
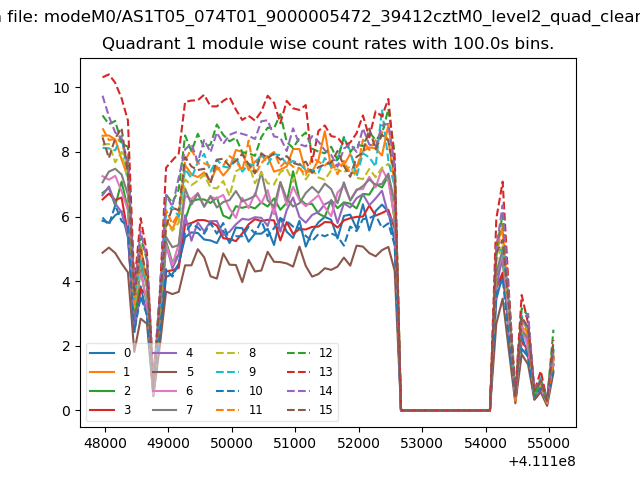
| Module-wise count rates for Quadrant A Data is divided into 100 sec bins |
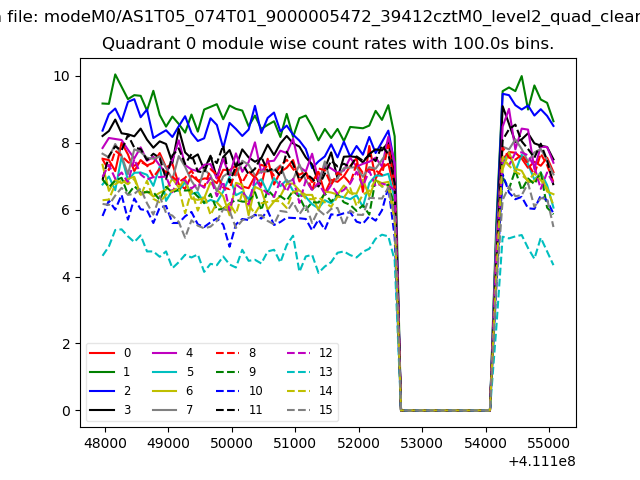 |
 |
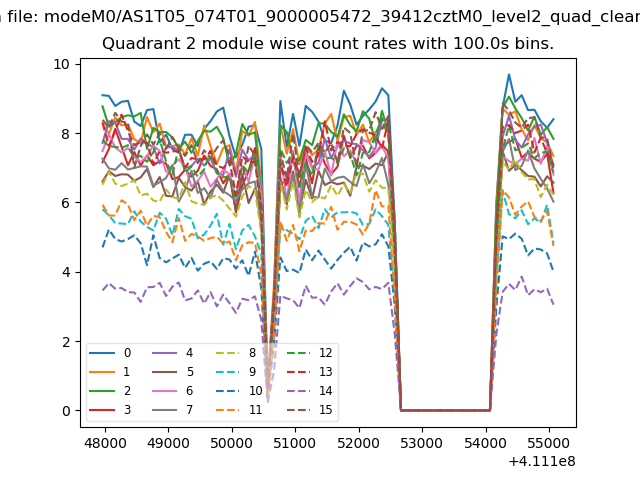
| Module-wise count rates for Quadrant B Data is divided into 100 sec bins |
 |
 |
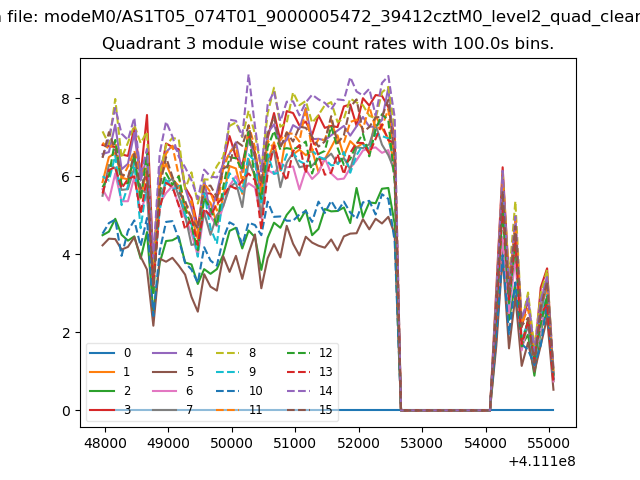
| Module-wise count rates for Quadrant C Data is divided into 100 sec bins |
 |
 |
| Module-wise count rates for Quadrant D Data is divided into 100 sec bins |
 |
 |
| Parameter | Plot |
|---|---|
| CZT HV Monitor | 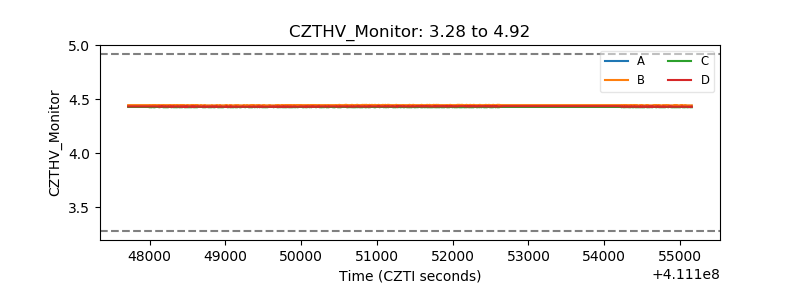 |
| D_VDD | 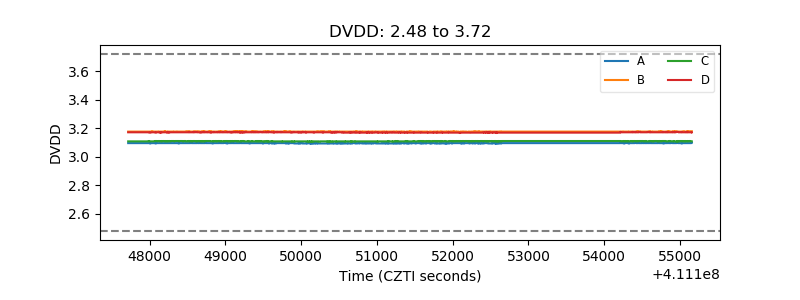 |
| Temperature 1 |  |
| Veto HV Monitor | 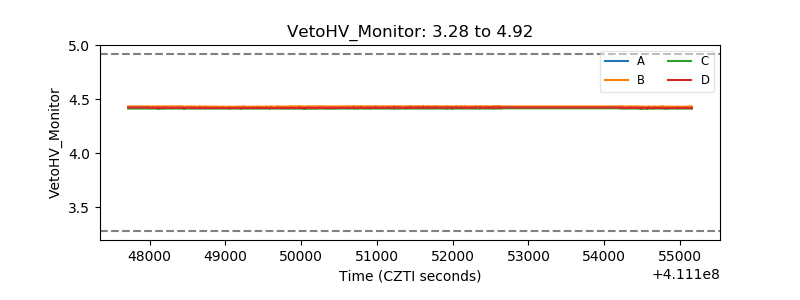 |
| Veto LLD | 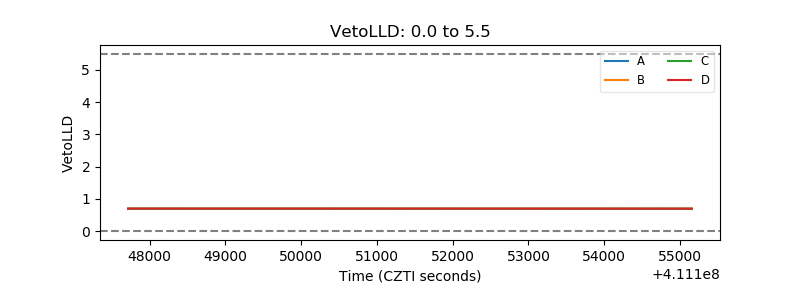 |
| Alpha Counter | 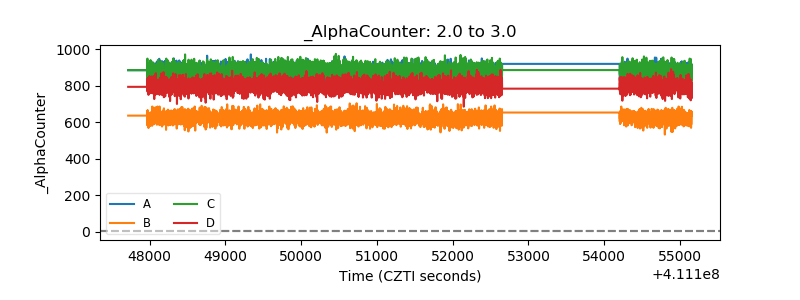 |
| _CPM_Rate |  |
| CZT Counter | 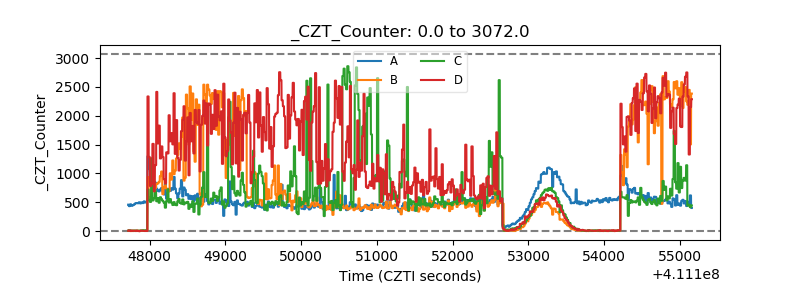 |
| +2.5 Volts monitor | 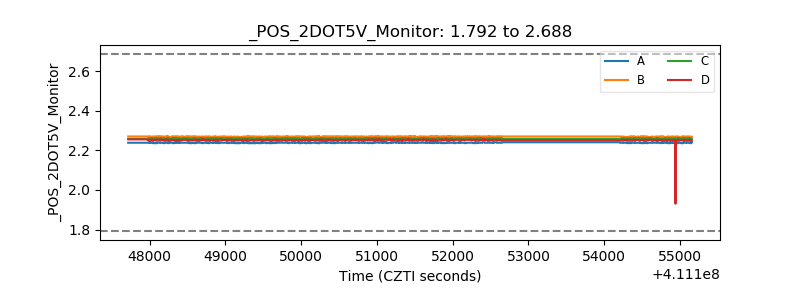 |
| +5 Volts monitor | 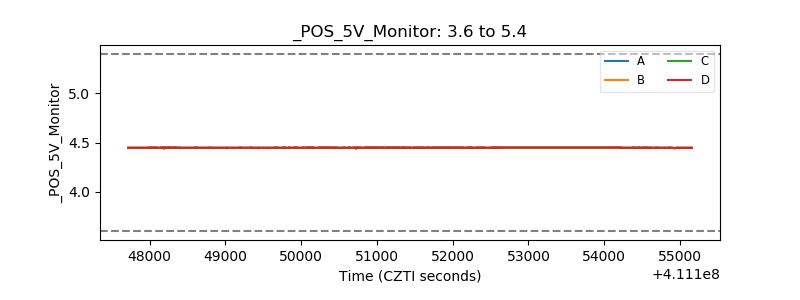 |
| _ROLL_ROT | 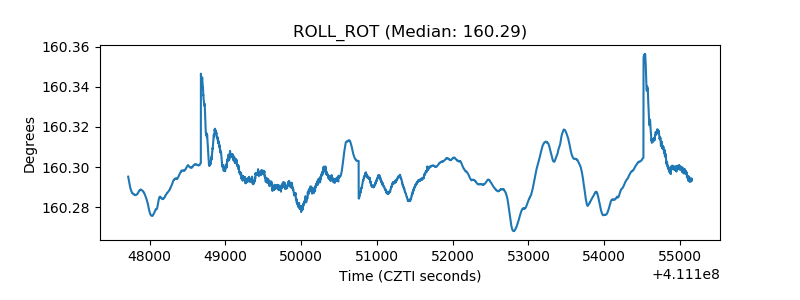 |
| _Roll_DEC | 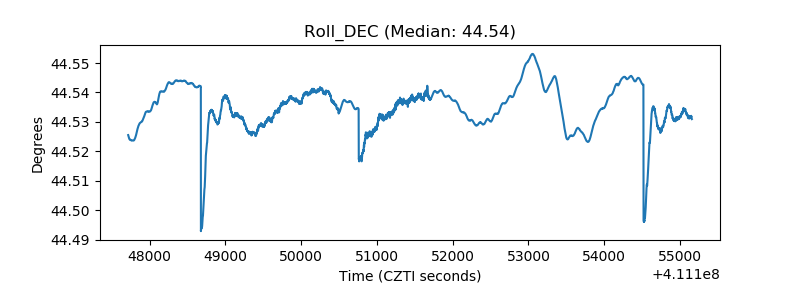 |
| _Roll_RA | 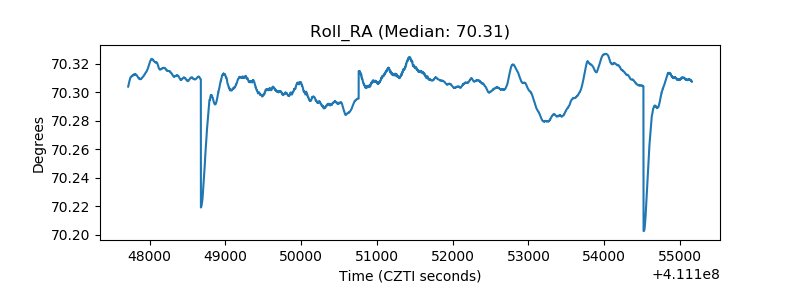 |
| Veto Counter | 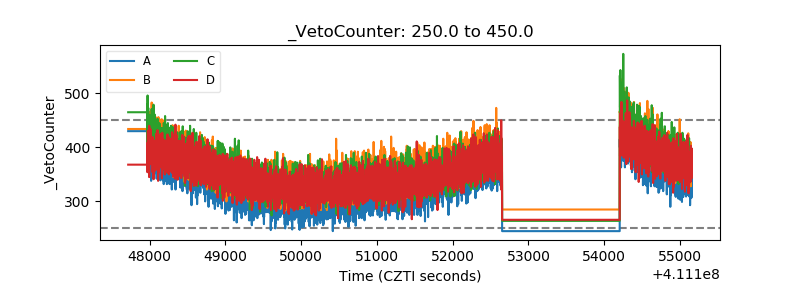 |