| Param | Original file | Final file |
|---|---|---|
| Filename | modeM0/AS1T05_074T01_9000005472_39413cztM0_level2.fits | modeM0/AS1T05_074T01_9000005472_39413cztM0_level2_quad_clean.evt |
| Size (bytes) | 578,525,760 | 81,915,840 |
| Size | 551.7 MB | 78.1 MB |
| Events in quadrant A | 2,966,367 | 613,778 |
| Events in quadrant B | 6,172,878 | 469,936 |
| Events in quadrant C | 3,581,400 | 588,161 |
| Events in quadrant D | 8,270,964 | 425,552 |
| Mode M9 | |||
|---|---|---|---|
| Quadrant | BADHDUFLAG | Total packets | Discarded packets |
| A | 0 | 24 | 0 |
| B | 0 | 24 | 0 |
| C | 0 | 24 | 0 |
| D | 0 | 25 | 0 |
| Mode M0 | |||
|---|---|---|---|
| Quadrant | BADHDUFLAG | Total packets | Discarded packets |
| A | 0 | 12331 | 3 |
| B | 0 | 22060 | 2 |
| C | 0 | 14115 | 2 |
| D | 0 | 28369 | 2 |
| Mode SS | |||
|---|---|---|---|
| Quadrant | BADHDUFLAG | Total packets | Discarded packets |
| A | 0 | 112 | 0 |
| B | 0 | 112 | 0 |
| C | 0 | 112 | 0 |
| D | 0 | 112 | 0 |
| Quadrant | Total seconds | Saturated seconds | Saturation percentage |
|---|---|---|---|
| A | 5464 | 38 | 0.695461% |
| B | 5464 | 1409 | 25.786969% |
| C | 5464 | 160 | 2.928258% |
| D | 5464 | 1577 | 28.861640% |
Noise dominated data is calculated using 1-second bins in cleaned event files. If a bin has >2000 counts, and if more than 50% of those come from <1% of pixels, then it is considered to be noise-dominated and hence unusable.
| Quadrant | # 1 sec bins | Bins with >0 counts | Bins with >2000 counts | High rate bins dominated by noise | Noise dominated (total time) | Noise dominated (detector-on time) | Marked lightcurve |
|---|---|---|---|---|---|---|---|
| A | 7136 | 5465 | 21 | 21 | 0.29% | 0.38% | 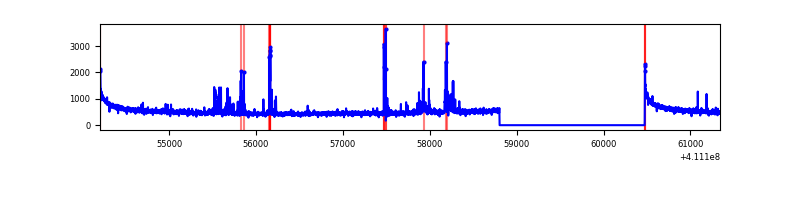 |
| B | 7136 | 5465 | 1247 | 1247 | 17.47% | 22.82% | 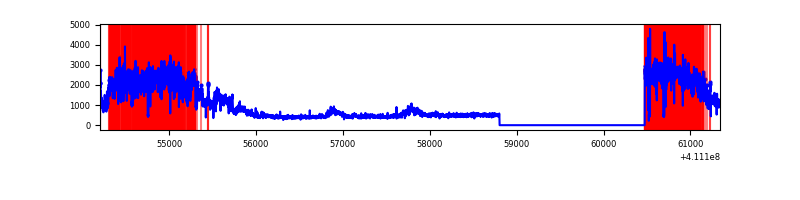 |
| C | 7136 | 5465 | 136 | 136 | 1.91% | 2.49% | 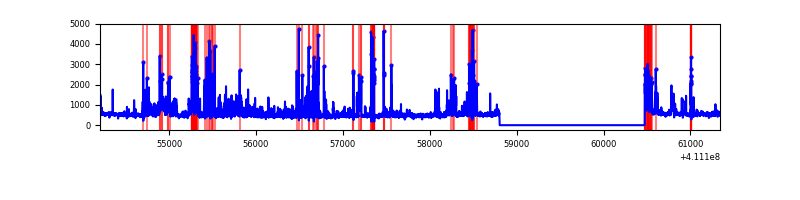 |
| D | 7136 | 5465 | 1527 | 1527 | 21.40% | 27.94% | 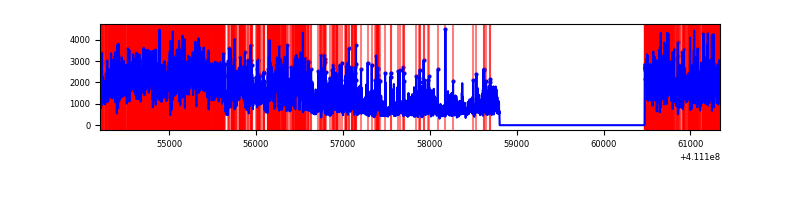 |
Top three noisy pixels from each quadrant. If the there are fewer than three noisy pixels in the level2.evt file, extra rows are filled as -1
| Pixel properties | Quadrant properties | ||||||
|---|---|---|---|---|---|---|---|
| Quadrant | DetID | PixID | Counts | Sigma | Mean | Median | Sigma |
| A | 10 | 83 | 458825 | 3758.12 | 597 | 584 | 121.9 |
| A | 13 | 248 | 185817 | 1519.13 | 597 | 584 | 121.9 |
| A | 13 | 254 | 8173 | 62.24 | 597 | 584 | 121.9 |
| B | 6 | 203 | 3939087 | 38109.58 | 537 | 521 | 103.3 |
| B | 5 | 172 | 92981 | 894.64 | 537 | 521 | 103.3 |
| B | 15 | 85 | 18223 | 171.28 | 537 | 521 | 103.3 |
| C | 15 | 208 | 714810 | 5259.57 | 581 | 582 | 135.8 |
| C | 14 | 254 | 321182 | 2360.9 | 581 | 582 | 135.8 |
| C | 15 | 214 | 229143 | 1683.12 | 581 | 582 | 135.8 |
| D | 12 | 235 | 5174949 | 39473.27 | 534 | 518 | 131.1 |
| D | 12 | 227 | 353116 | 2689.8 | 534 | 518 | 131.1 |
| D | 5 | 222 | 265766 | 2023.45 | 534 | 518 | 131.1 |
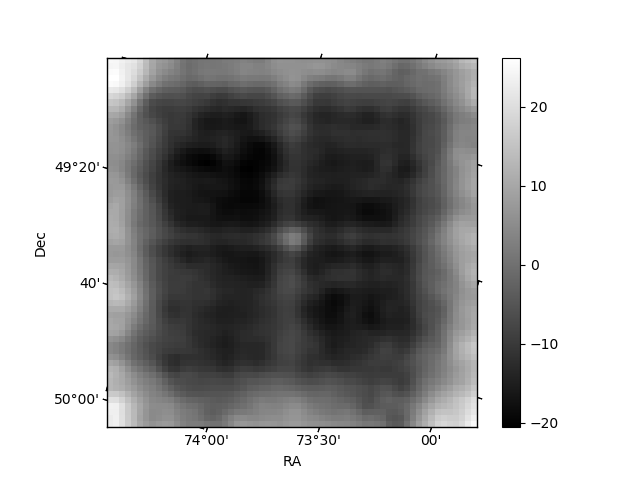
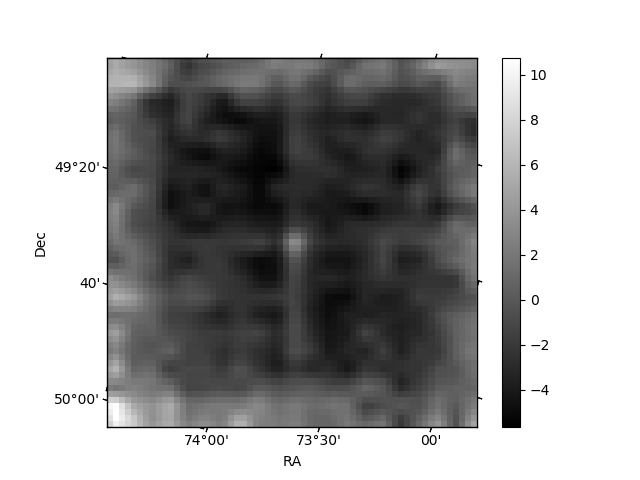
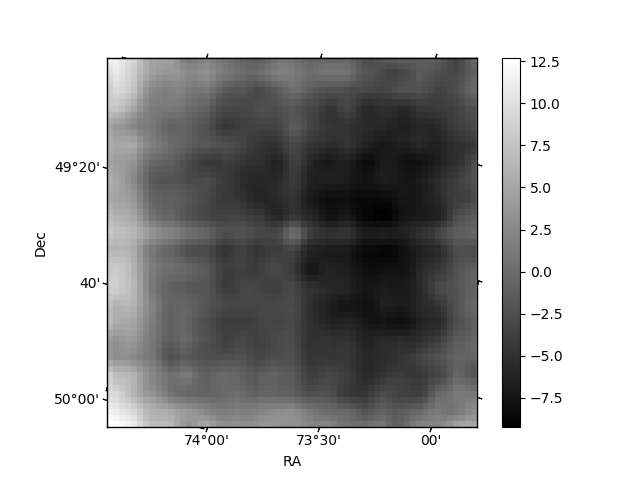
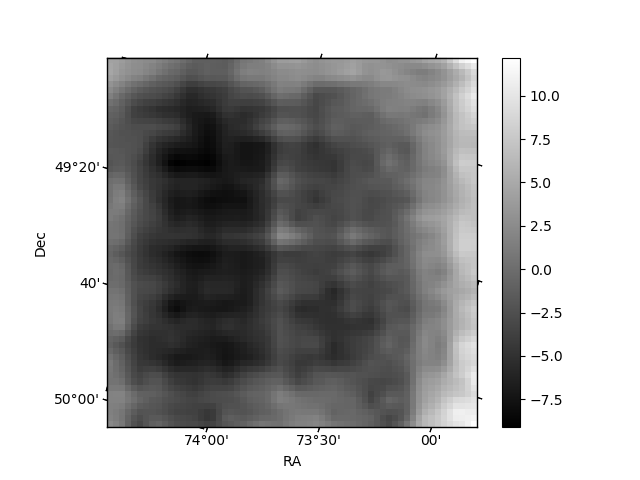
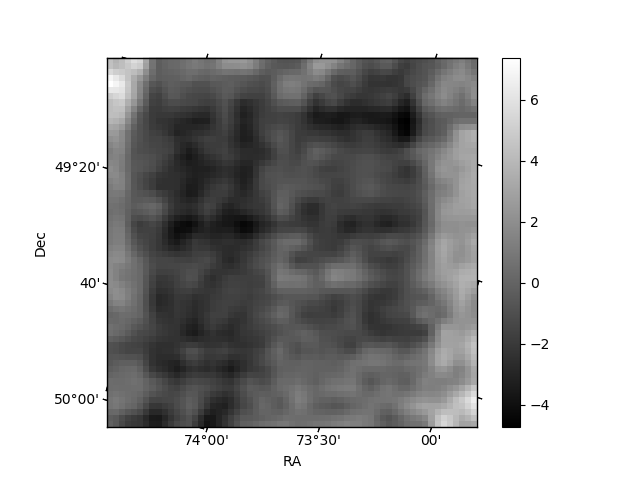
Histogram calculated using DETX and DETY for each event in the final _common_clean file
| Quadrant A | 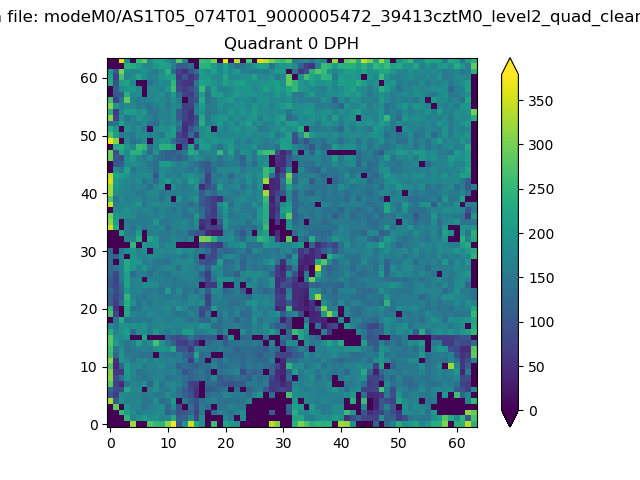 |
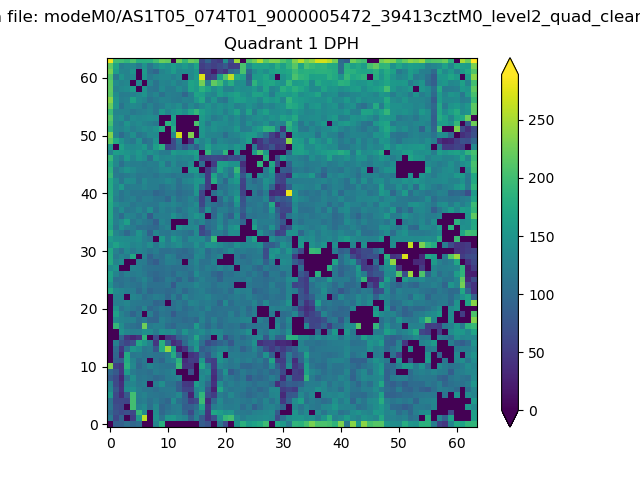 |
Quadrant B |
|---|---|---|---|
| Quadrant D | 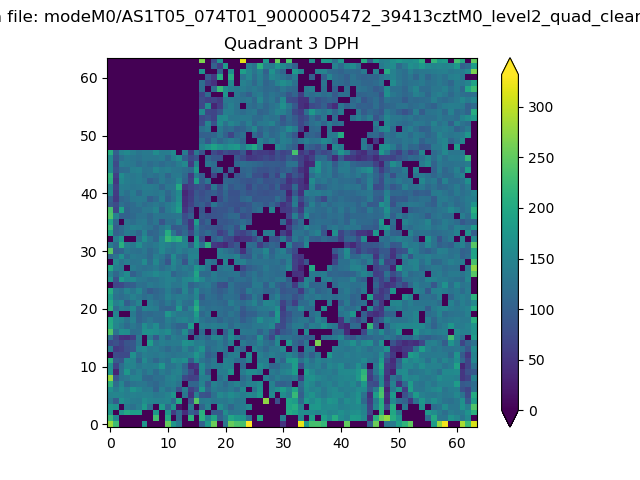 |
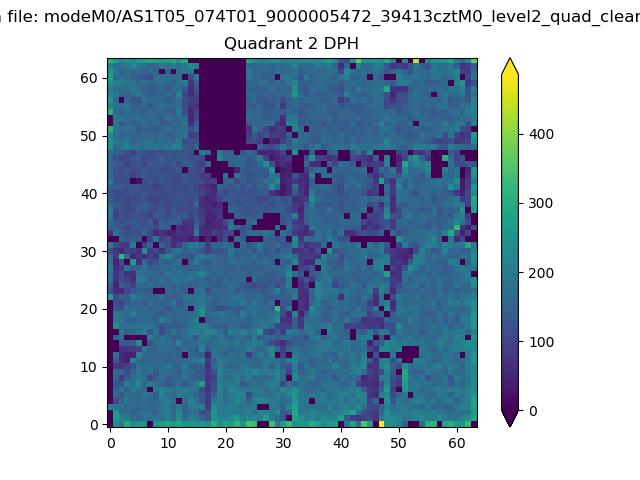 |
Quadrant C |
| Plot type | Count rate plots | Images |
|---|---|---|
| Comparison with Poisson distribution Blue bars denote a histogram of data divided into 1 sec bins. Red curve is a Poisson curve with rate = median count rate of data. |
 |
 |
| Quadrant-wise count rates Data is divided into 100 sec bins |
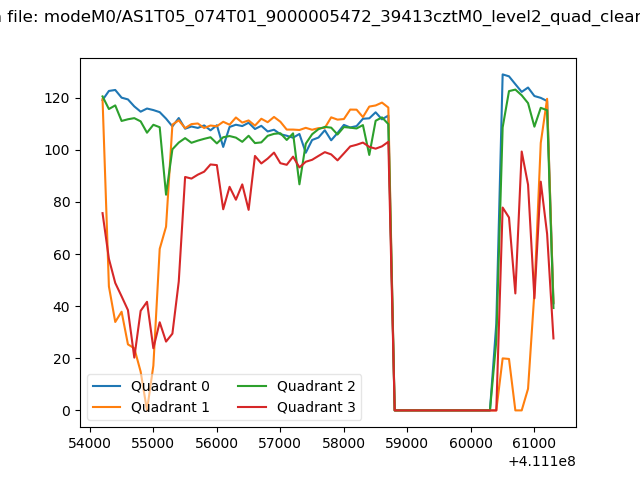 |
|
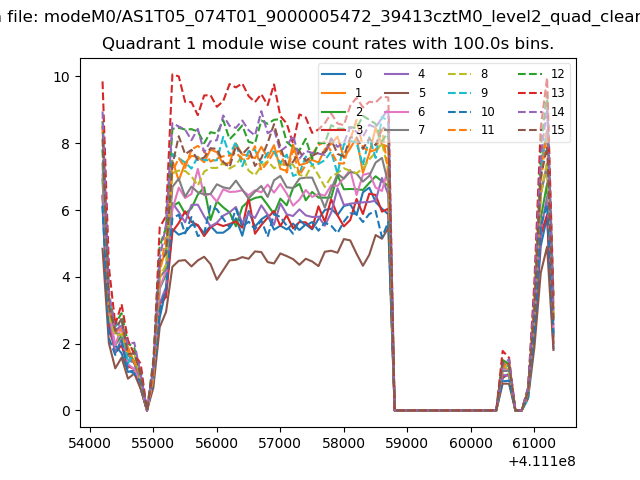
| Module-wise count rates for Quadrant A Data is divided into 100 sec bins |
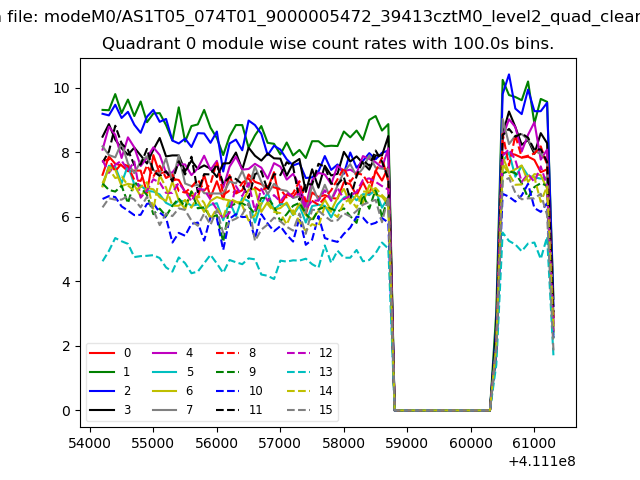 |
 |
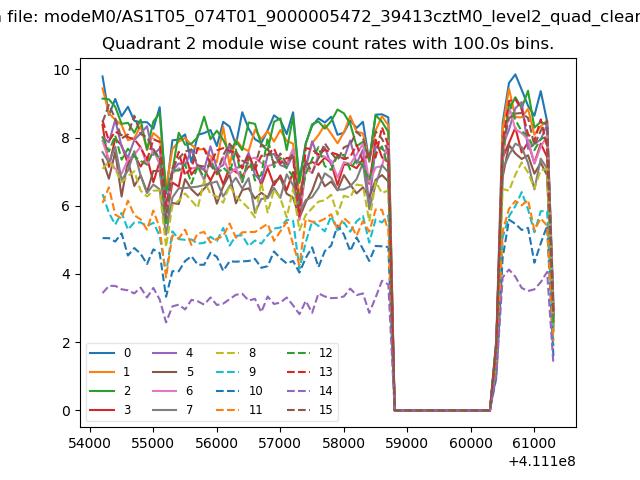
| Module-wise count rates for Quadrant B Data is divided into 100 sec bins |
 |
 |
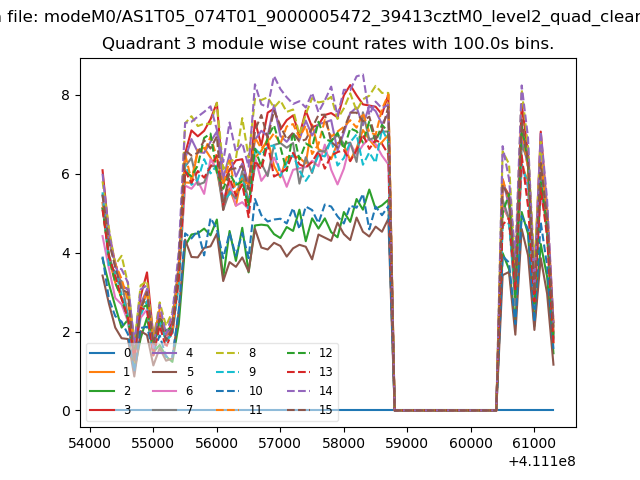
| Module-wise count rates for Quadrant C Data is divided into 100 sec bins |
 |
 |
| Module-wise count rates for Quadrant D Data is divided into 100 sec bins |
 |
 |
| Parameter | Plot |
|---|---|
| CZT HV Monitor | 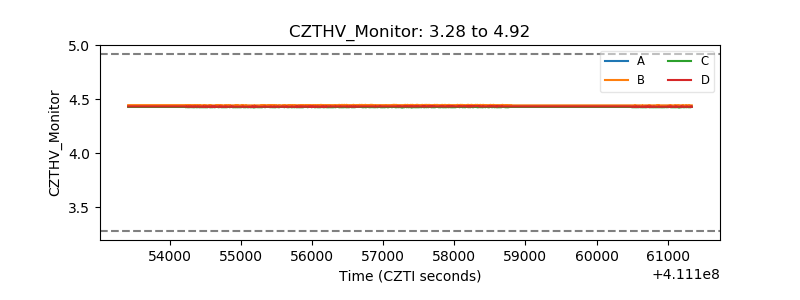 |
| D_VDD | 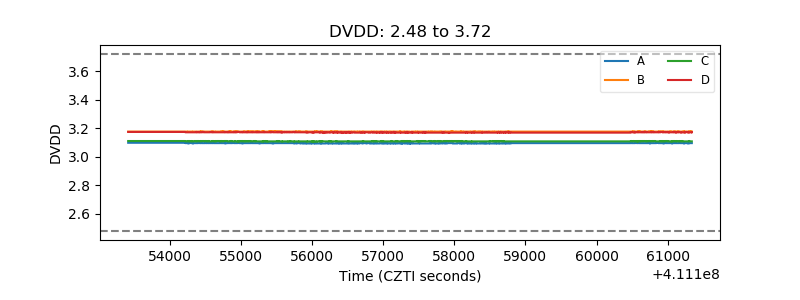 |
| Temperature 1 | 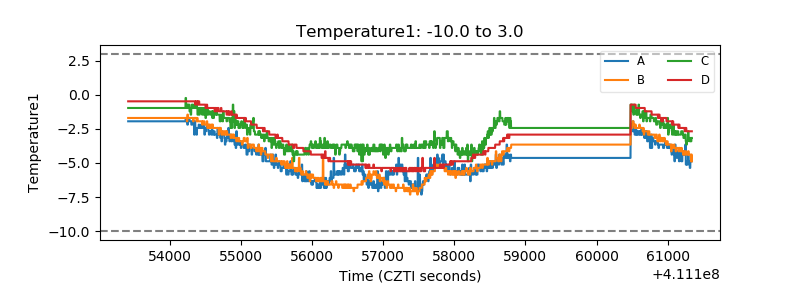 |
| Veto HV Monitor | 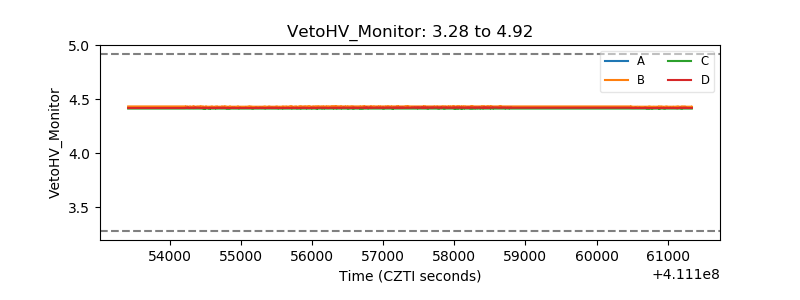 |
| Veto LLD | 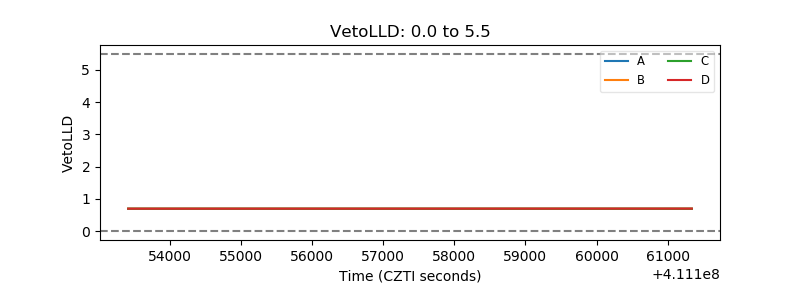 |
| Alpha Counter |  |
| _CPM_Rate |  |
| CZT Counter | 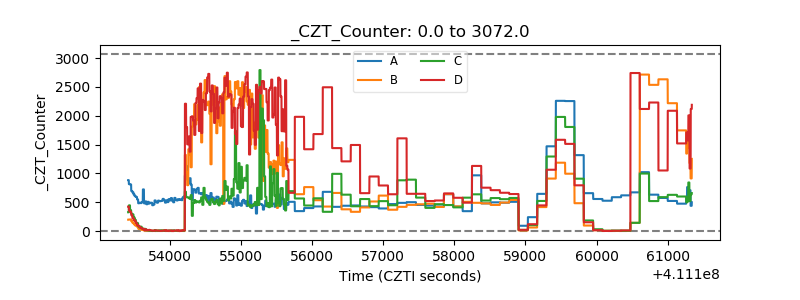 |
| +2.5 Volts monitor | 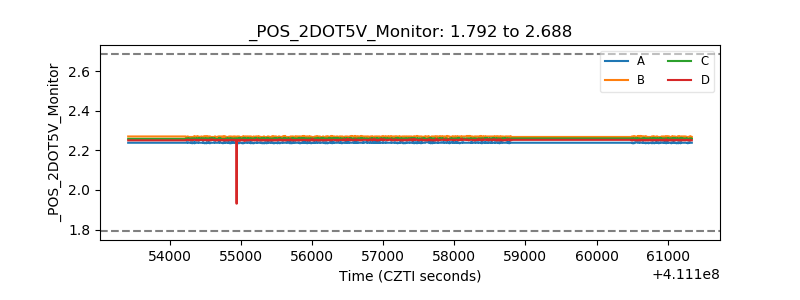 |
| +5 Volts monitor | 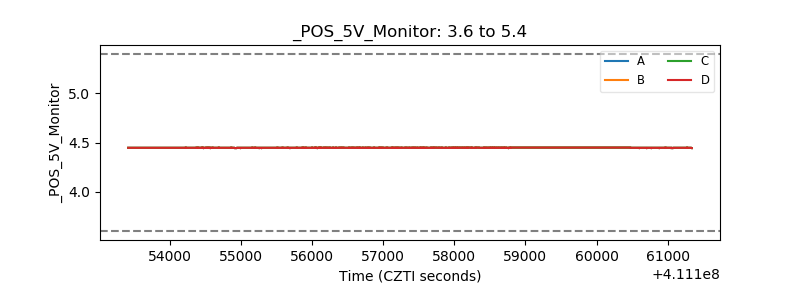 |
| _ROLL_ROT | 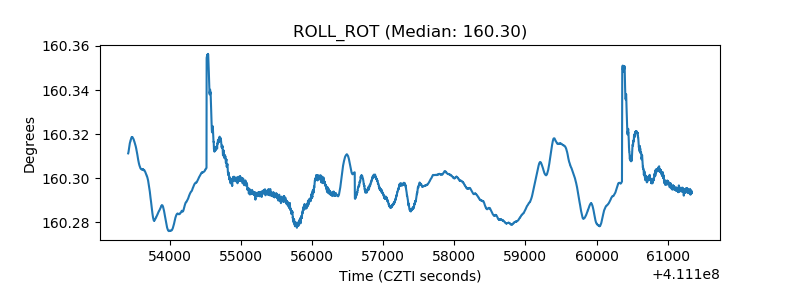 |
| _Roll_DEC | 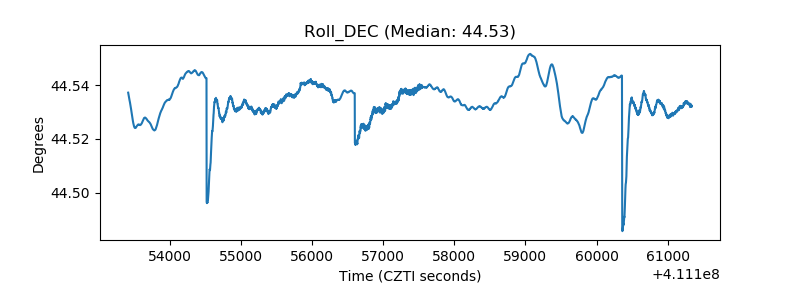 |
| _Roll_RA | 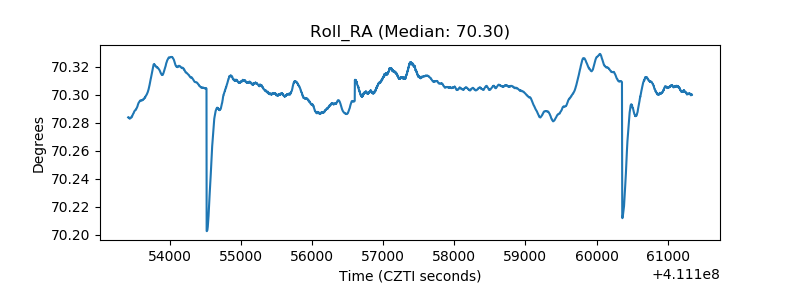 |
| Veto Counter | 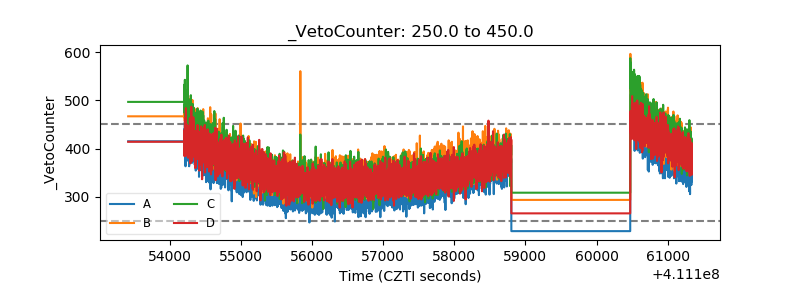 |