| Param | Original file | Final file |
|---|---|---|
| Filename | modeM0/AS1T05_074T01_9000005472_39415cztM0_level2.fits | modeM0/AS1T05_074T01_9000005472_39415cztM0_level2_quad_clean.evt |
| Size (bytes) | 536,976,000 | 83,381,760 |
| Size | 512.1 MB | 79.5 MB |
| Events in quadrant A | 3,222,699 | 599,114 |
| Events in quadrant B | 4,197,720 | 548,424 |
| Events in quadrant C | 4,582,177 | 567,542 |
| Events in quadrant D | 7,469,072 | 442,599 |
| Mode M9 | |||
|---|---|---|---|
| Quadrant | BADHDUFLAG | Total packets | Discarded packets |
| A | 0 | 30 | 0 |
| B | 0 | 30 | 0 |
| C | 0 | 30 | 0 |
| D | 0 | 31 | 0 |
| Mode M0 | |||
|---|---|---|---|
| Quadrant | BADHDUFLAG | Total packets | Discarded packets |
| A | 0 | 12908 | 3 |
| B | 0 | 16056 | 2 |
| C | 0 | 17007 | 2 |
| D | 0 | 25902 | 2 |
| Mode SS | |||
|---|---|---|---|
| Quadrant | BADHDUFLAG | Total packets | Discarded packets |
| A | 0 | 108 | 0 |
| B | 0 | 108 | 0 |
| C | 0 | 108 | 0 |
| D | 0 | 108 | 0 |
| Quadrant | Total seconds | Saturated seconds | Saturation percentage |
|---|---|---|---|
| A | 5234 | 88 | 1.681314% |
| B | 5234 | 643 | 12.285059% |
| C | 5234 | 352 | 6.725258% |
| D | 5234 | 1168 | 22.315629% |
Noise dominated data is calculated using 1-second bins in cleaned event files. If a bin has >2000 counts, and if more than 50% of those come from <1% of pixels, then it is considered to be noise-dominated and hence unusable.
| Quadrant | # 1 sec bins | Bins with >0 counts | Bins with >2000 counts | High rate bins dominated by noise | Noise dominated (total time) | Noise dominated (detector-on time) | Marked lightcurve |
|---|---|---|---|---|---|---|---|
| A | 7056 | 5235 | 70 | 70 | 0.99% | 1.34% | 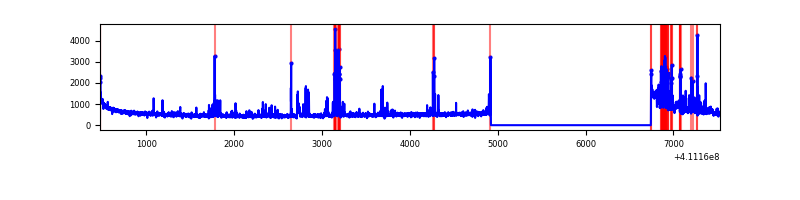 |
| B | 7056 | 5235 | 592 | 592 | 8.39% | 11.31% | 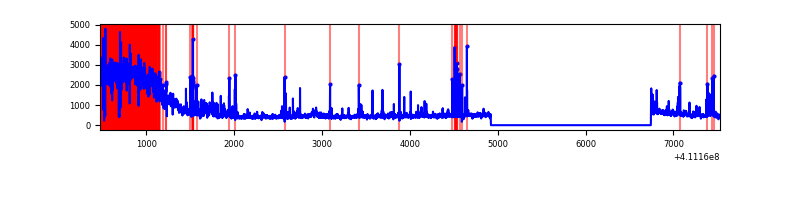 |
| C | 7056 | 5235 | 337 | 337 | 4.78% | 6.44% | 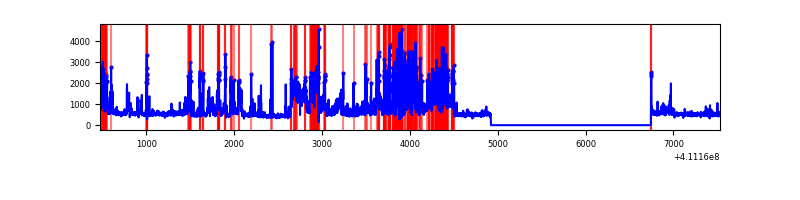 |
| D | 7056 | 5235 | 1124 | 1124 | 15.93% | 21.47% | 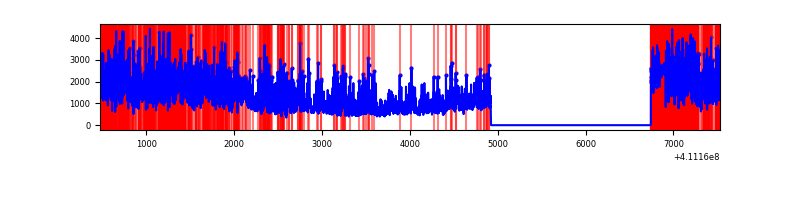 |
Top three noisy pixels from each quadrant. If the there are fewer than three noisy pixels in the level2.evt file, extra rows are filled as -1
| Pixel properties | Quadrant properties | ||||||
|---|---|---|---|---|---|---|---|
| Quadrant | DetID | PixID | Counts | Sigma | Mean | Median | Sigma |
| A | 10 | 83 | 439224 | 3781.71 | 575 | 563 | 116.0 |
| A | 15 | 222 | 331981 | 2857.16 | 575 | 563 | 116.0 |
| A | 13 | 248 | 183716 | 1578.97 | 575 | 563 | 116.0 |
| B | 6 | 203 | 1751907 | 16623.26 | 541 | 526 | 105.4 |
| B | 5 | 172 | 256529 | 2429.86 | 541 | 526 | 105.4 |
| B | 5 | 255 | 49910 | 468.73 | 541 | 526 | 105.4 |
| C | 15 | 208 | 2085391 | 16023.66 | 557 | 562 | 130.1 |
| C | 15 | 214 | 216119 | 1656.74 | 557 | 562 | 130.1 |
| C | 14 | 254 | 49720 | 377.82 | 557 | 562 | 130.1 |
| D | 12 | 235 | 3310719 | 26732.7 | 511 | 496 | 123.8 |
| D | 12 | 0 | 1039155 | 8388.0 | 511 | 496 | 123.8 |
| D | 12 | 227 | 525304 | 4238.25 | 511 | 496 | 123.8 |
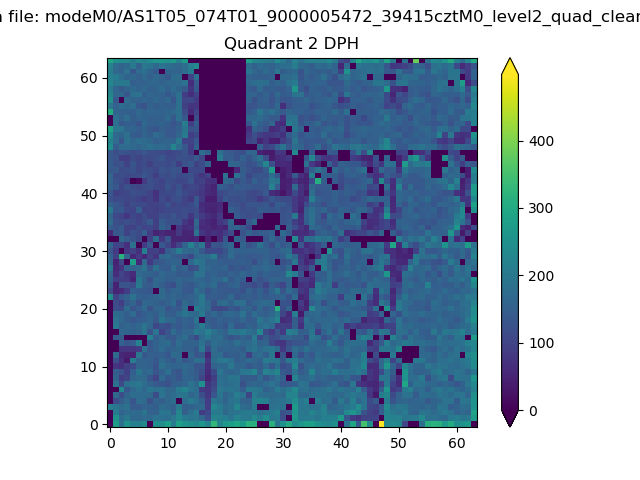
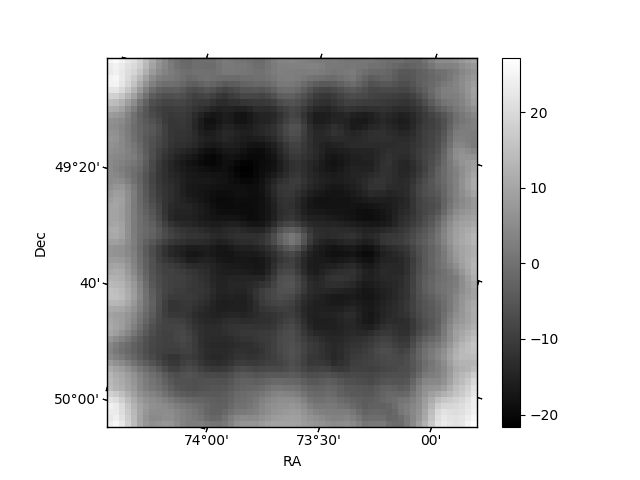
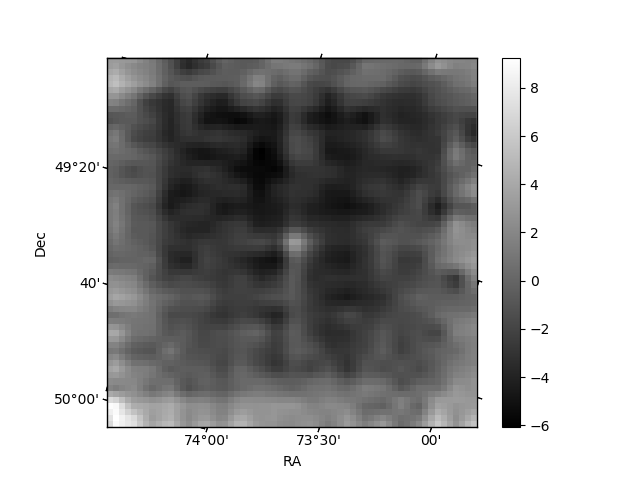
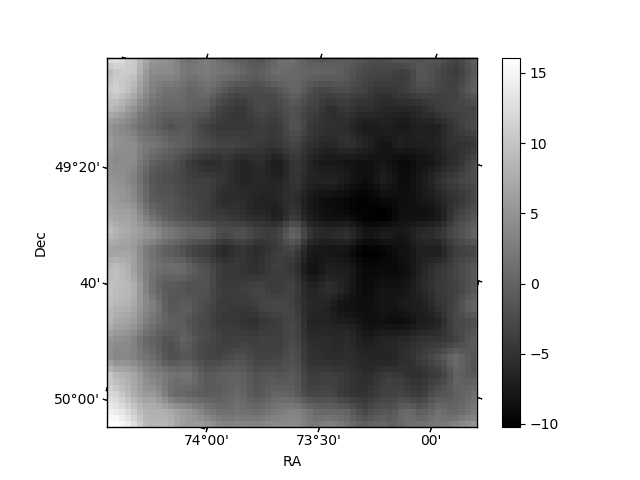
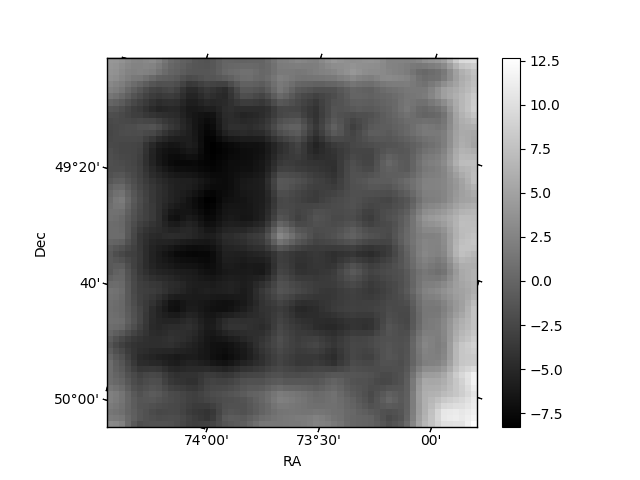
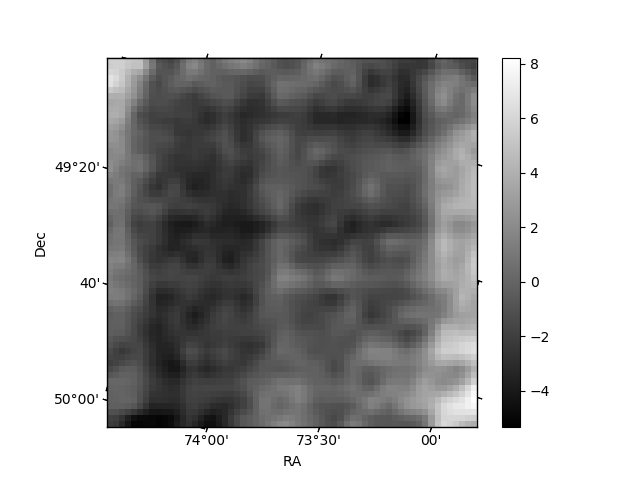
Histogram calculated using DETX and DETY for each event in the final _common_clean file
| Quadrant A | 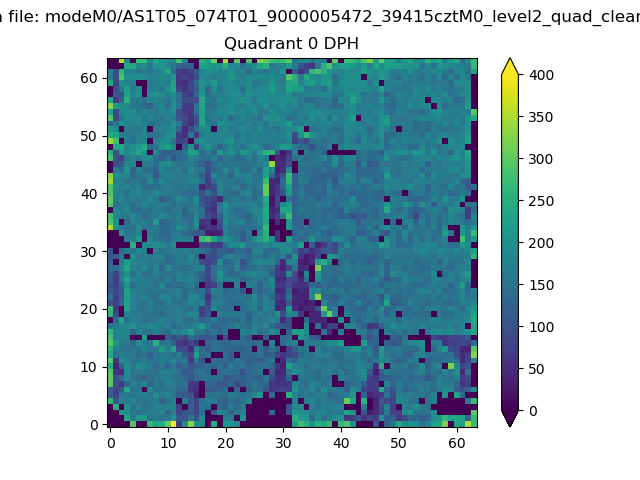 |
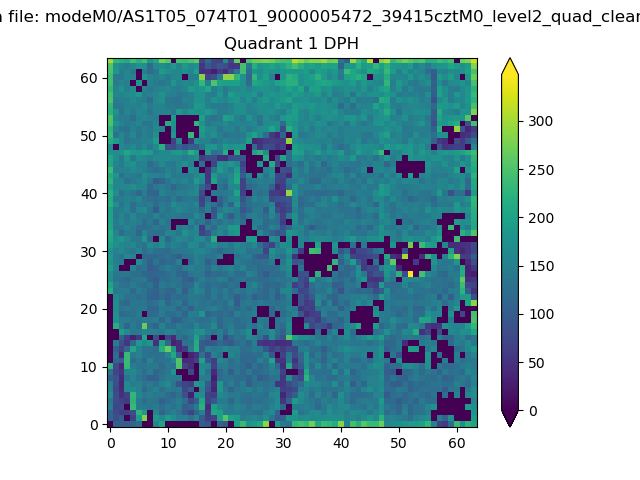 |
Quadrant B |
|---|---|---|---|
| Quadrant D | 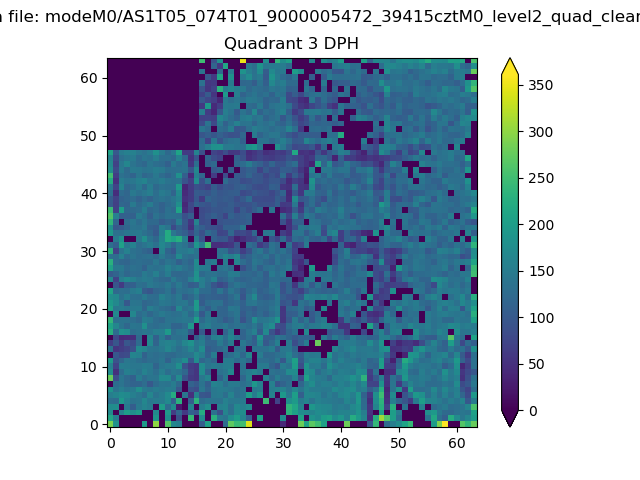 |
 |
Quadrant C |
| Plot type | Count rate plots | Images |
|---|---|---|
| Comparison with Poisson distribution Blue bars denote a histogram of data divided into 1 sec bins. Red curve is a Poisson curve with rate = median count rate of data. |
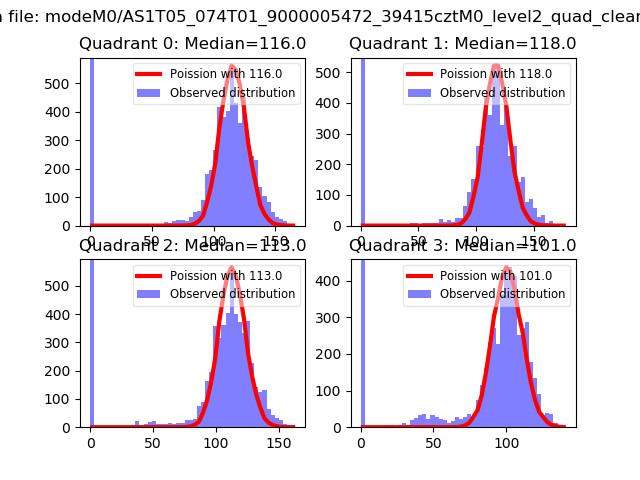 |
 |
| Quadrant-wise count rates Data is divided into 100 sec bins |
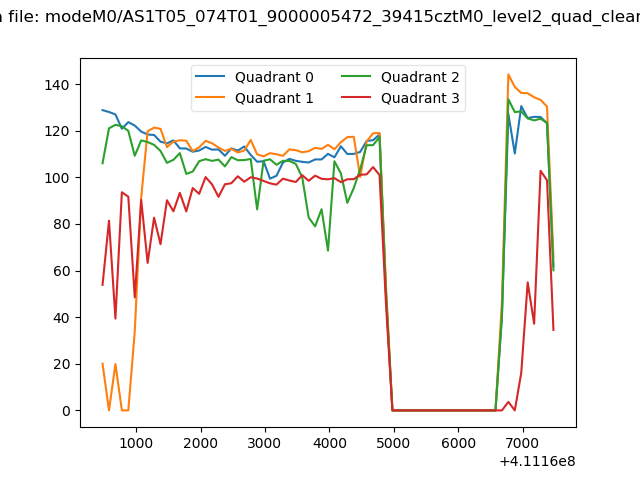 |
|
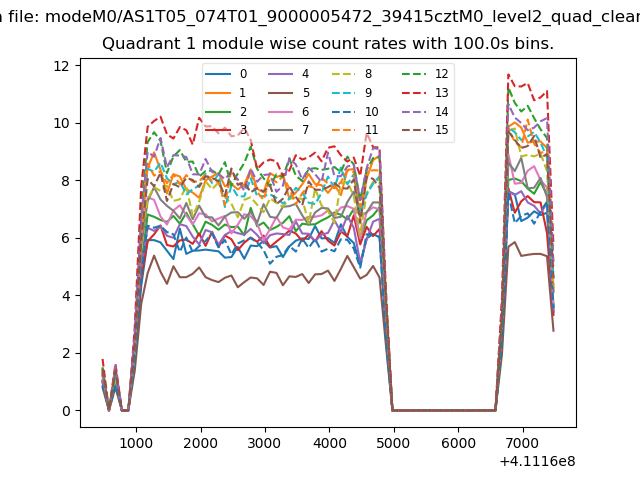
| Module-wise count rates for Quadrant A Data is divided into 100 sec bins |
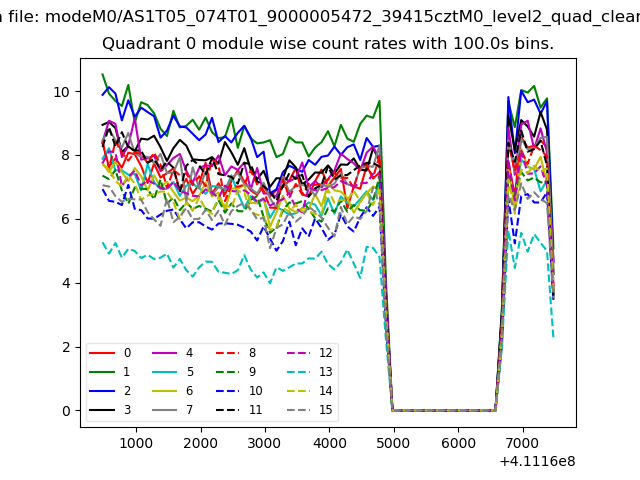 |
 |
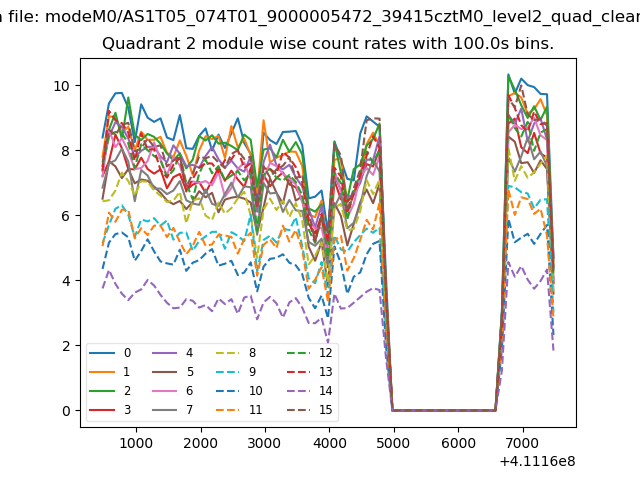
| Module-wise count rates for Quadrant B Data is divided into 100 sec bins |
 |
 |
| Module-wise count rates for Quadrant C Data is divided into 100 sec bins |
 |
 |
| Module-wise count rates for Quadrant D Data is divided into 100 sec bins |
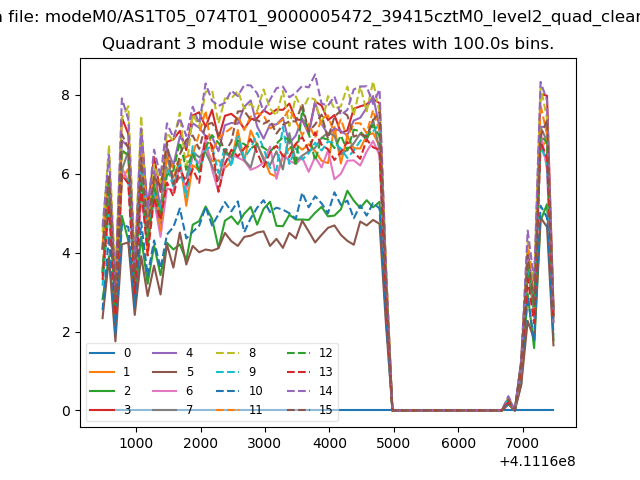 |
 |
| Parameter | Plot |
|---|---|
| CZT HV Monitor | 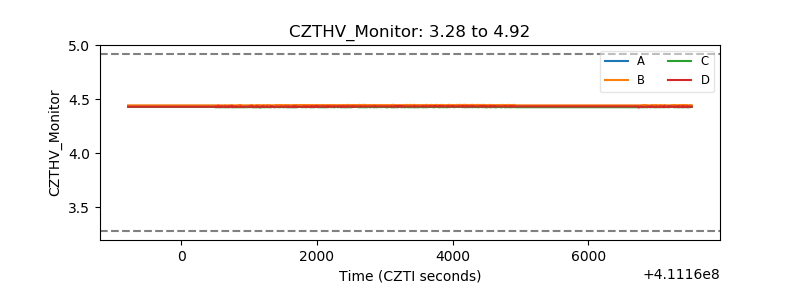 |
| D_VDD | 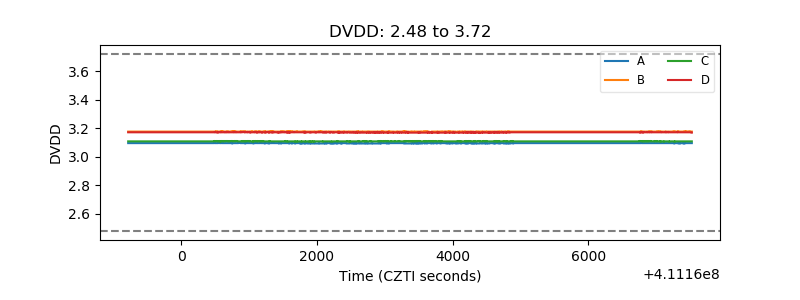 |
| Temperature 1 | 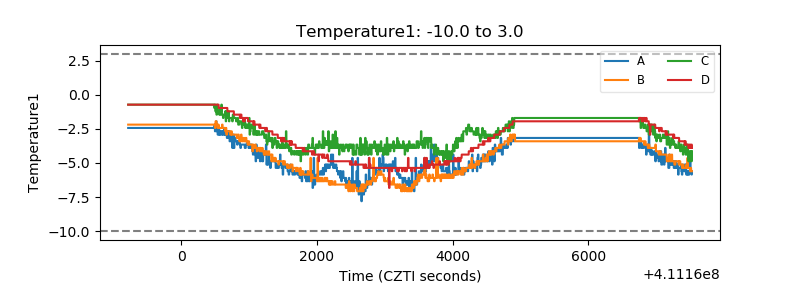 |
| Veto HV Monitor | 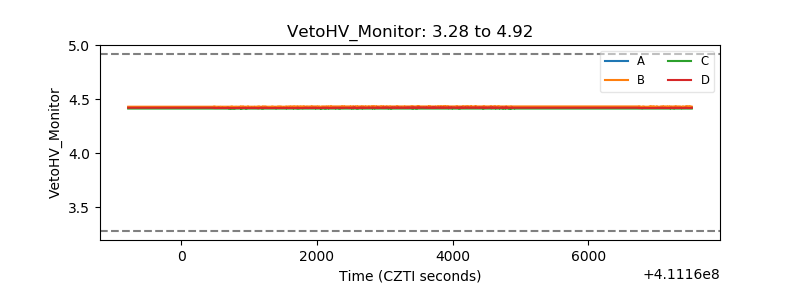 |
| Veto LLD |  |
| Alpha Counter | 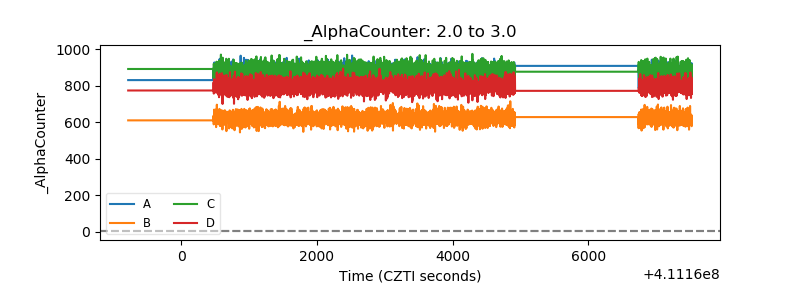 |
| _CPM_Rate | 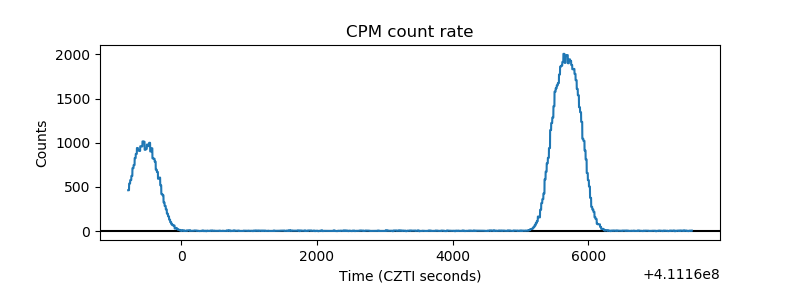 |
| CZT Counter | 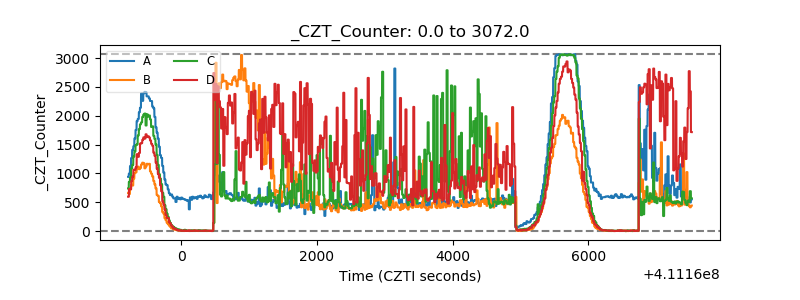 |
| +2.5 Volts monitor | 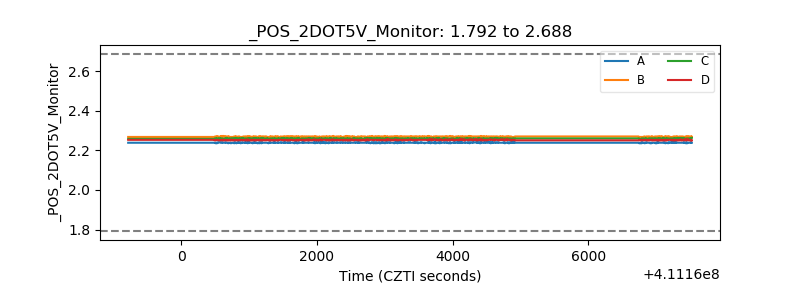 |
| +5 Volts monitor | 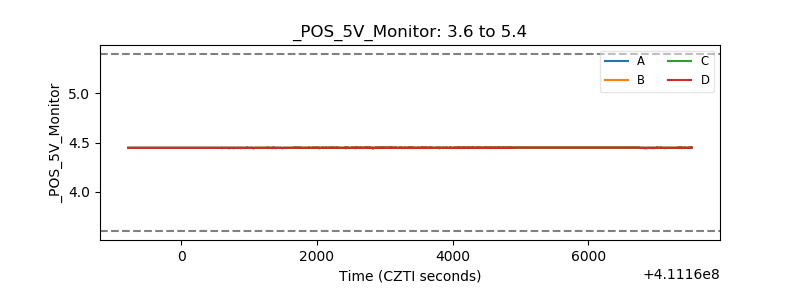 |
| _ROLL_ROT | 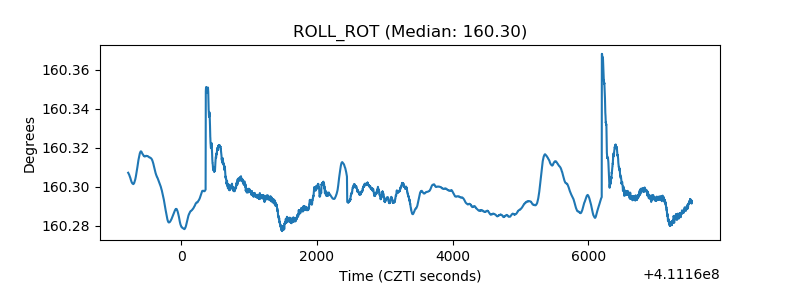 |
| _Roll_DEC | 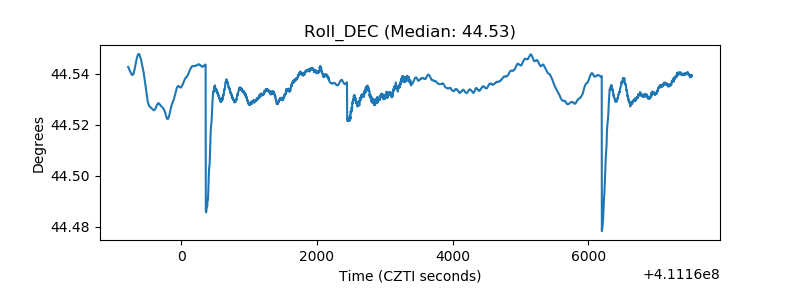 |
| _Roll_RA | 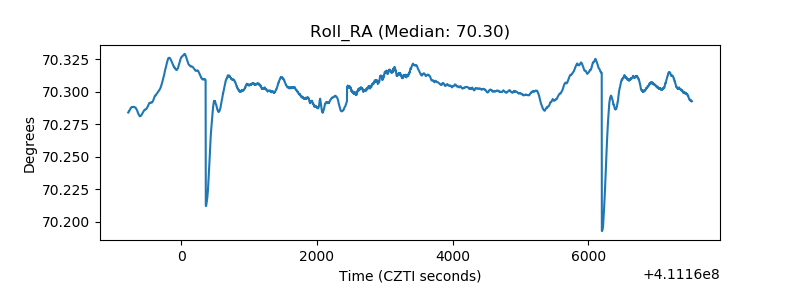 |
| Veto Counter | 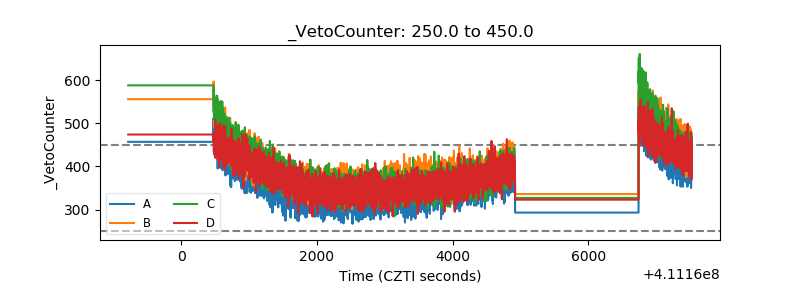 |