| Param | Original file | Final file |
|---|---|---|
| Filename | modeM0/AS1T05_074T01_9000005472_39416cztM0_level2.fits | modeM0/AS1T05_074T01_9000005472_39416cztM0_level2_quad_clean.evt |
| Size (bytes) | 466,243,200 | 84,470,400 |
| Size | 444.6 MB | 80.6 MB |
| Events in quadrant A | 3,538,042 | 598,837 |
| Events in quadrant B | 2,482,802 | 635,102 |
| Events in quadrant C | 3,606,474 | 585,876 |
| Events in quadrant D | 7,236,430 | 381,909 |
| Mode M9 | |||
|---|---|---|---|
| Quadrant | BADHDUFLAG | Total packets | Discarded packets |
| A | 0 | 26 | 0 |
| B | 0 | 26 | 0 |
| C | 0 | 26 | 0 |
| D | 0 | 27 | 0 |
| Mode M0 | |||
|---|---|---|---|
| Quadrant | BADHDUFLAG | Total packets | Discarded packets |
| A | 0 | 13782 | 2 |
| B | 0 | 10857 | 1 |
| C | 0 | 13974 | 1 |
| D | 0 | 25086 | 1 |
| Mode SS | |||
|---|---|---|---|
| Quadrant | BADHDUFLAG | Total packets | Discarded packets |
| A | 0 | 102 | 0 |
| B | 0 | 102 | 0 |
| C | 0 | 102 | 0 |
| D | 0 | 102 | 0 |
| Quadrant | Total seconds | Saturated seconds | Saturation percentage |
|---|---|---|---|
| A | 5084 | 147 | 2.891424% |
| B | 5084 | 15 | 0.295043% |
| C | 5084 | 176 | 3.461841% |
| D | 5084 | 1557 | 30.625492% |
Noise dominated data is calculated using 1-second bins in cleaned event files. If a bin has >2000 counts, and if more than 50% of those come from <1% of pixels, then it is considered to be noise-dominated and hence unusable.
| Quadrant | # 1 sec bins | Bins with >0 counts | Bins with >2000 counts | High rate bins dominated by noise | Noise dominated (total time) | Noise dominated (detector-on time) | Marked lightcurve |
|---|---|---|---|---|---|---|---|
| A | 7026 | 5085 | 133 | 133 | 1.89% | 2.62% | 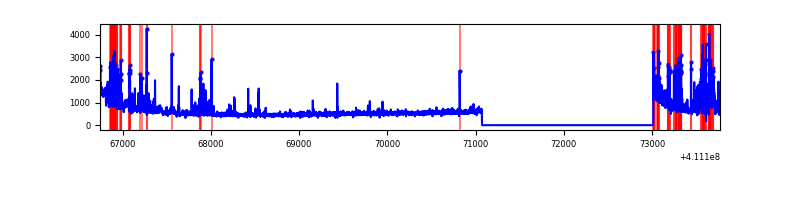 |
| B | 7026 | 5085 | 6 | 6 | 0.09% | 0.12% | 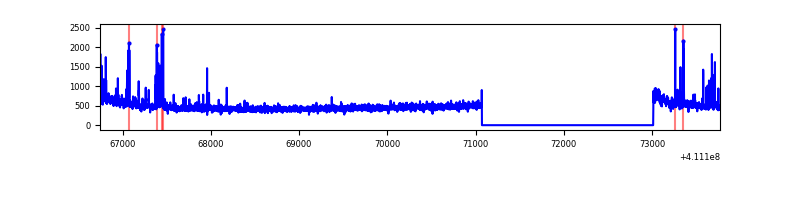 |
| C | 7026 | 5085 | 164 | 164 | 2.33% | 3.23% | 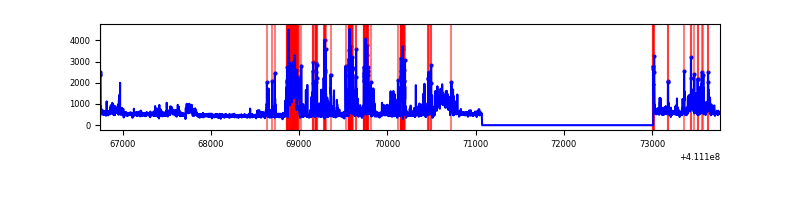 |
| D | 7026 | 5084 | 1386 | 1386 | 19.73% | 27.26% | 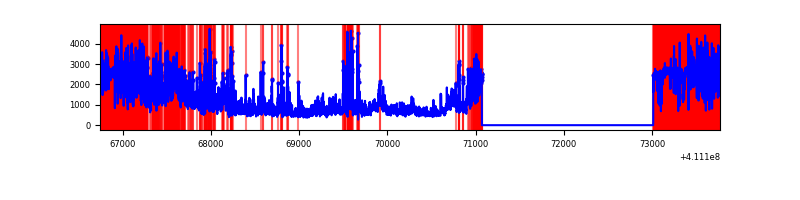 |
Top three noisy pixels from each quadrant. If the there are fewer than three noisy pixels in the level2.evt file, extra rows are filled as -1
| Pixel properties | Quadrant properties | ||||||
|---|---|---|---|---|---|---|---|
| Quadrant | DetID | PixID | Counts | Sigma | Mean | Median | Sigma |
| A | 15 | 222 | 732695 | 6402.31 | 566 | 556 | 114.4 |
| A | 10 | 83 | 419459 | 3663.17 | 566 | 556 | 114.4 |
| A | 13 | 248 | 180622 | 1574.62 | 566 | 556 | 114.4 |
| B | 5 | 172 | 97471 | 875.04 | 576 | 560 | 110.7 |
| B | 6 | 203 | 77544 | 695.12 | 576 | 560 | 110.7 |
| B | 5 | 255 | 27079 | 239.45 | 576 | 560 | 110.7 |
| C | 15 | 208 | 961807 | 7330.43 | 559 | 564 | 131.1 |
| C | 15 | 214 | 212395 | 1615.42 | 559 | 564 | 131.1 |
| C | 9 | 187 | 159565 | 1212.54 | 559 | 564 | 131.1 |
| D | 12 | 235 | 2910405 | 26861.82 | 449 | 436 | 108.3 |
| D | 12 | 0 | 1975968 | 18236.06 | 449 | 436 | 108.3 |
| D | 13 | 249 | 416692 | 3842.44 | 449 | 436 | 108.3 |
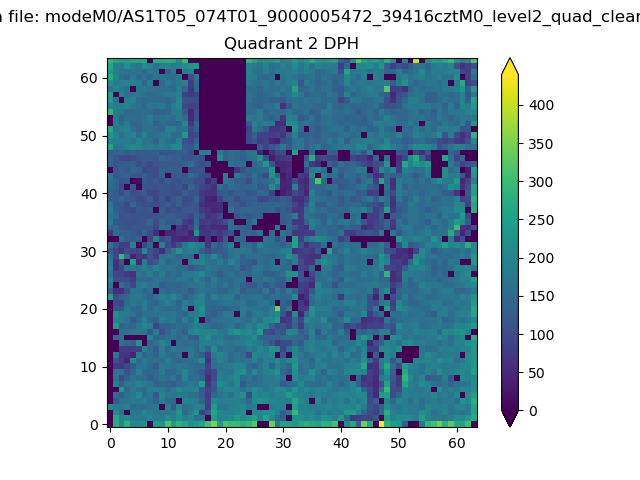
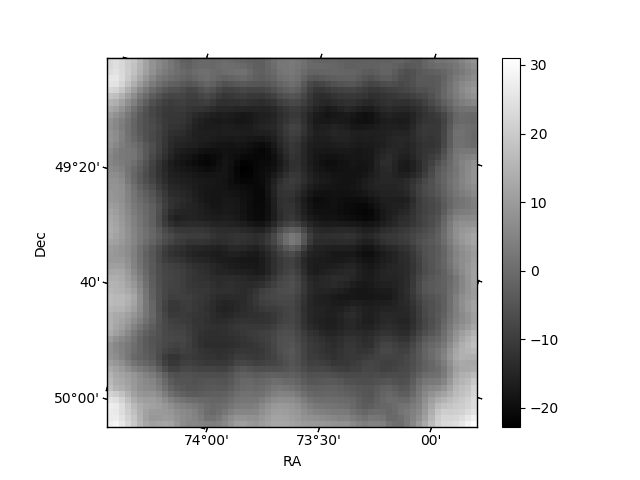
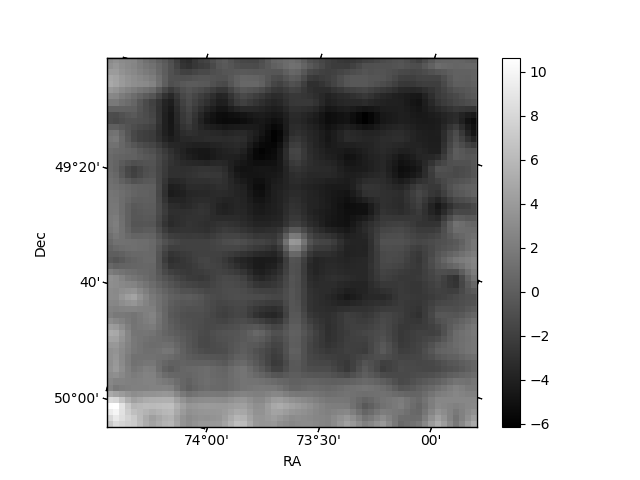
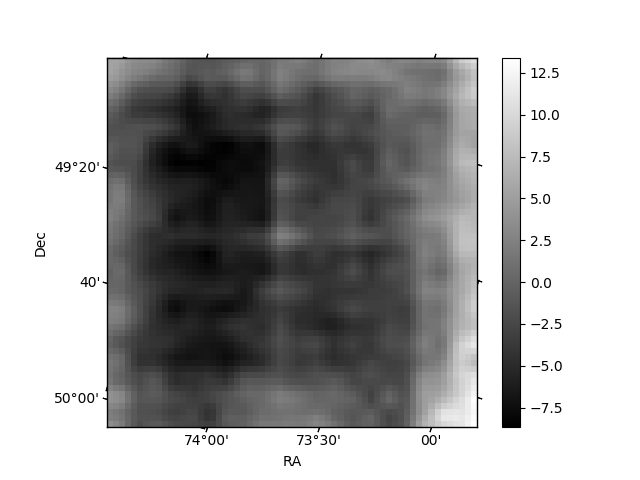
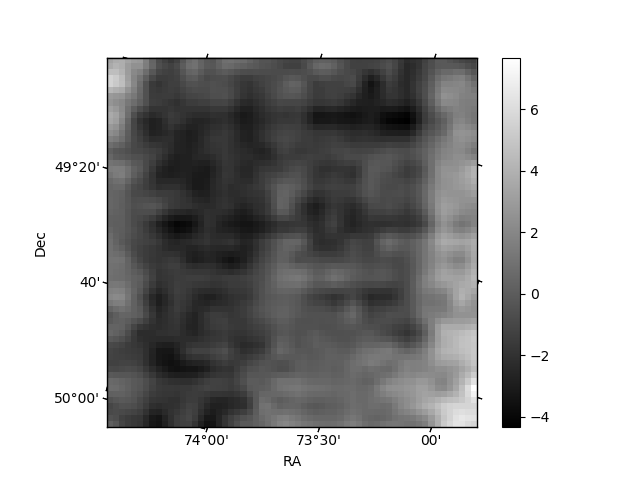
Histogram calculated using DETX and DETY for each event in the final _common_clean file
| Quadrant A | 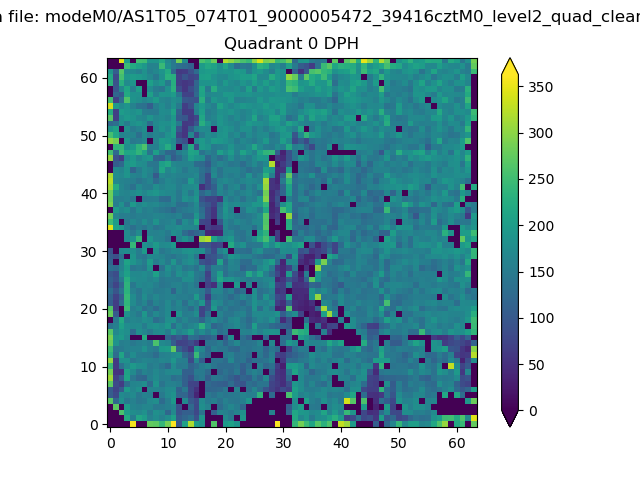 |
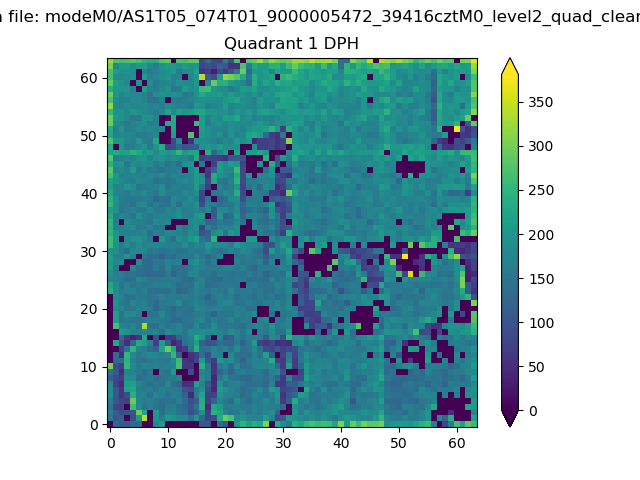 |
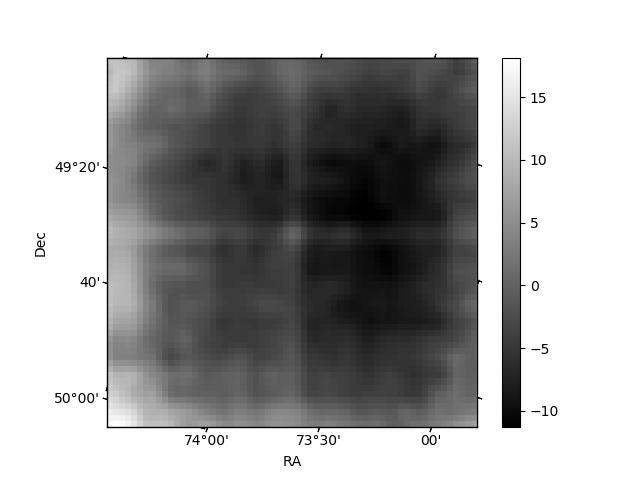
Quadrant B |
|---|---|---|---|
| Quadrant D | 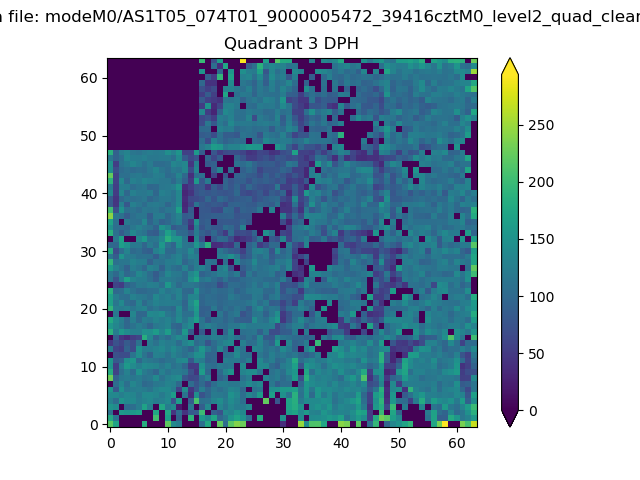 |
 |
Quadrant C |
| Plot type | Count rate plots | Images |
|---|---|---|
| Comparison with Poisson distribution Blue bars denote a histogram of data divided into 1 sec bins. Red curve is a Poisson curve with rate = median count rate of data. |
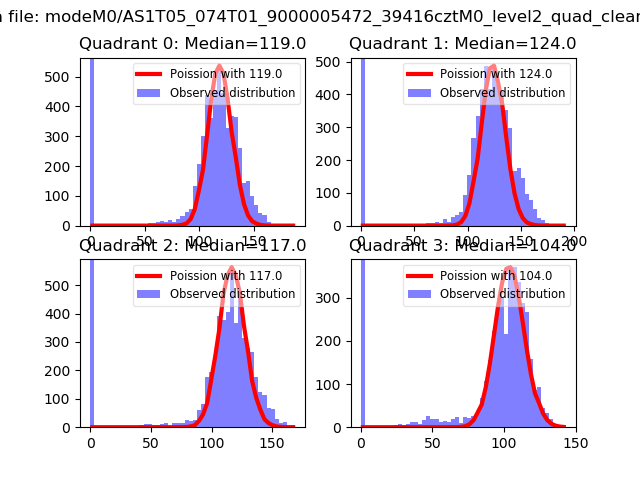 |
 |
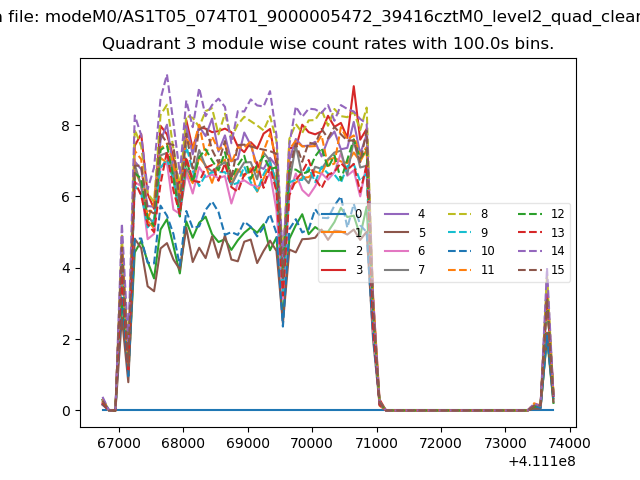
| Quadrant-wise count rates Data is divided into 100 sec bins |
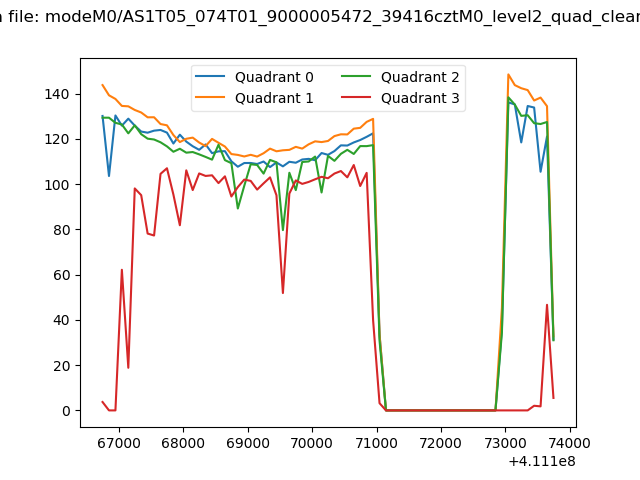 |
|
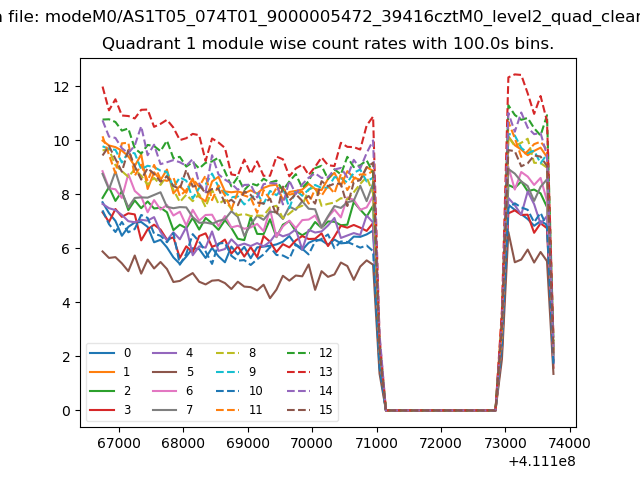
| Module-wise count rates for Quadrant A Data is divided into 100 sec bins |
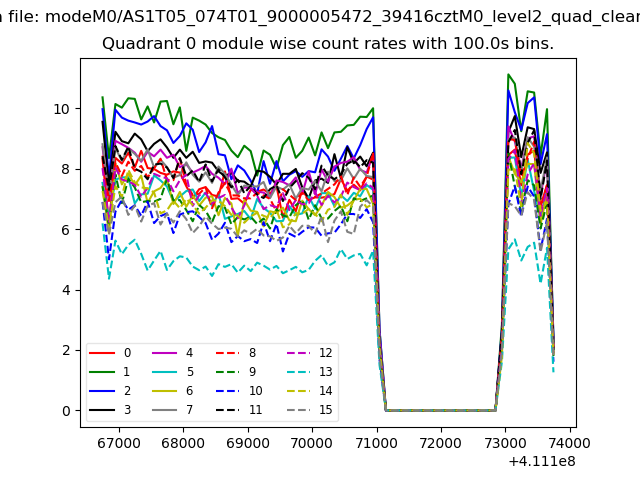 |
 |
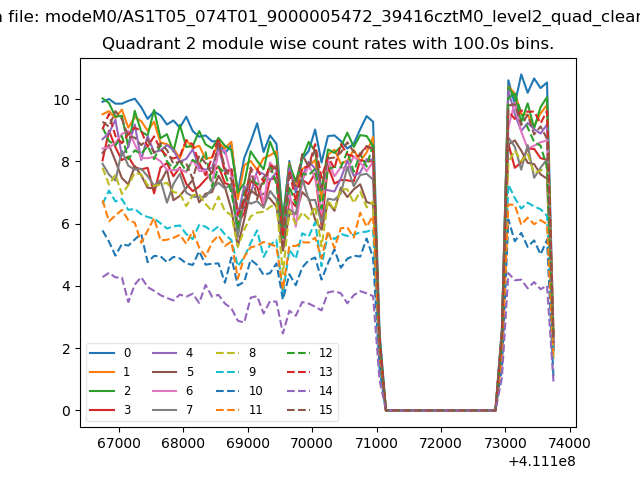
| Module-wise count rates for Quadrant B Data is divided into 100 sec bins |
 |
 |
| Module-wise count rates for Quadrant C Data is divided into 100 sec bins |
 |
 |
| Module-wise count rates for Quadrant D Data is divided into 100 sec bins |
 |
 |
| Parameter | Plot |
|---|---|
| CZT HV Monitor | 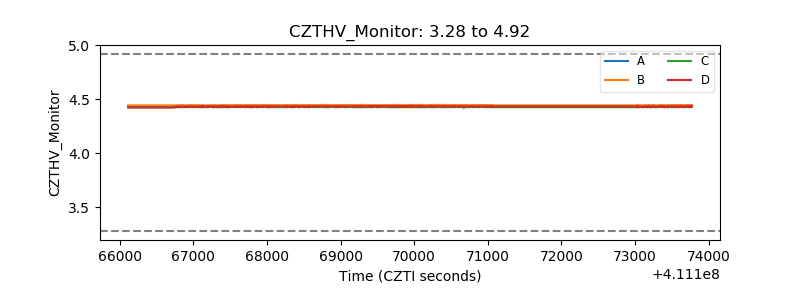 |
| D_VDD | 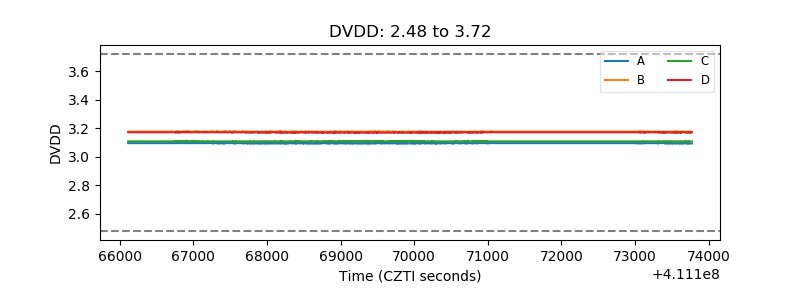 |
| Temperature 1 | 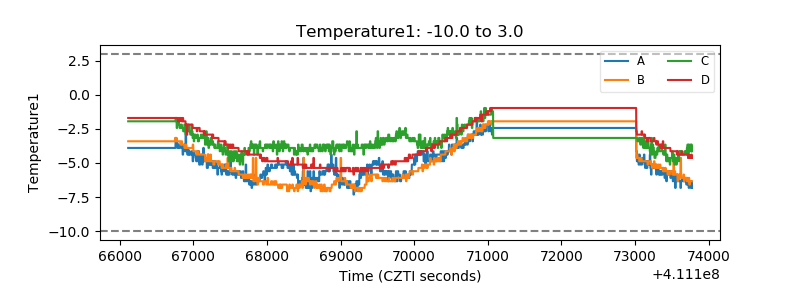 |
| Veto HV Monitor |  |
| Veto LLD |  |
| Alpha Counter |  |
| _CPM_Rate | 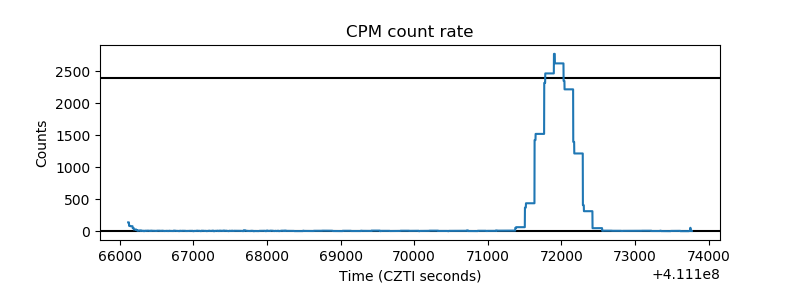 |
| CZT Counter | 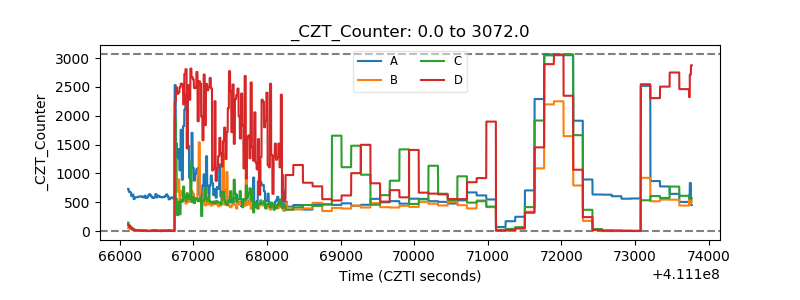 |
| +2.5 Volts monitor | 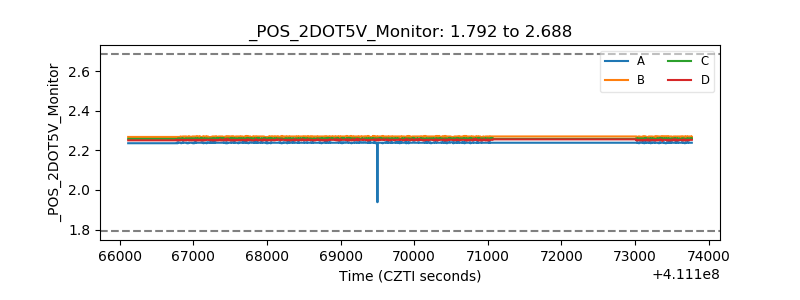 |
| +5 Volts monitor | 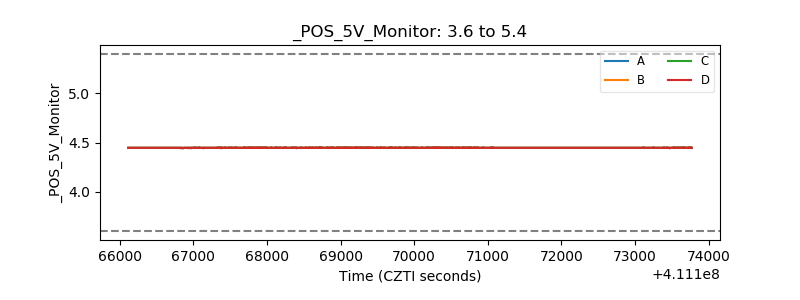 |
| _ROLL_ROT | 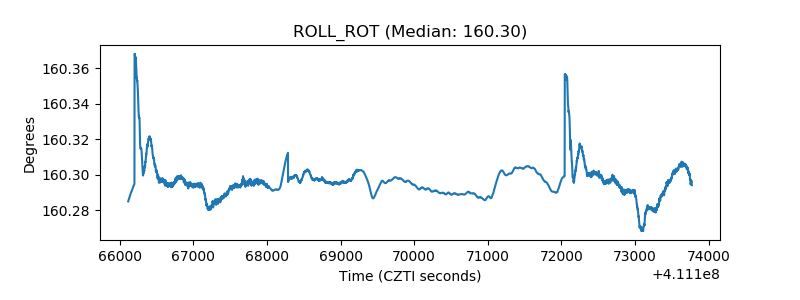 |
| _Roll_DEC | 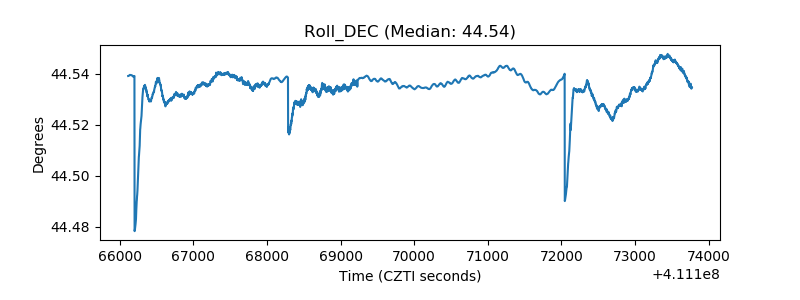 |
| _Roll_RA | 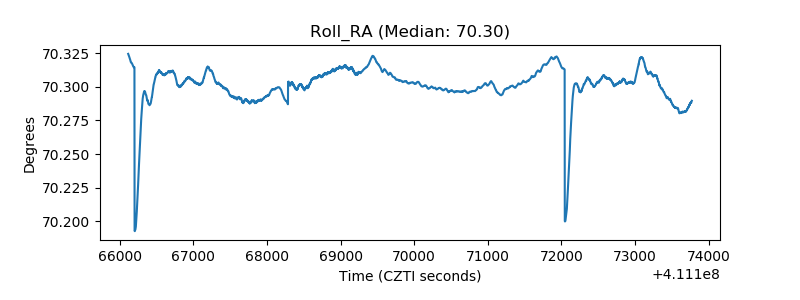 |
| Veto Counter | 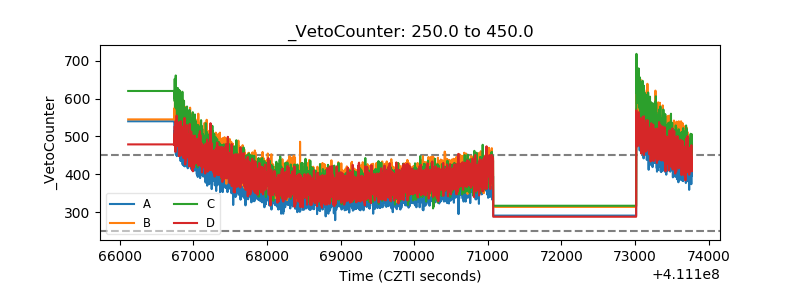 |