| Param | Original file | Final file |
|---|---|---|
| Filename | modeM0/AS1T05_074T01_9000005472_39417cztM0_level2.fits | modeM0/AS1T05_074T01_9000005472_39417cztM0_level2_quad_clean.evt |
| Size (bytes) | 606,096,000 | 74,436,480 |
| Size | 578.0 MB | 71.0 MB |
| Events in quadrant A | 5,008,499 | 534,687 |
| Events in quadrant B | 2,513,680 | 634,480 |
| Events in quadrant C | 3,801,908 | 579,249 |
| Events in quadrant D | 10,727,943 | 158,517 |
| Mode M9 | |||
|---|---|---|---|
| Quadrant | BADHDUFLAG | Total packets | Discarded packets |
| A | 0 | 29 | 0 |
| B | 0 | 29 | 0 |
| C | 0 | 29 | 0 |
| D | 0 | 30 | 0 |
| Mode M0 | |||
|---|---|---|---|
| Quadrant | BADHDUFLAG | Total packets | Discarded packets |
| A | 0 | 18315 | 2 |
| B | 0 | 10707 | 1 |
| C | 0 | 14498 | 1 |
| D | 0 | 35286 | 1 |
| Mode SS | |||
|---|---|---|---|
| Quadrant | BADHDUFLAG | Total packets | Discarded packets |
| A | 0 | 102 | 0 |
| B | 0 | 102 | 0 |
| C | 0 | 102 | 0 |
| D | 0 | 102 | 0 |
| Quadrant | Total seconds | Saturated seconds | Saturation percentage |
|---|---|---|---|
| A | 4942 | 725 | 14.670174% |
| B | 4942 | 17 | 0.343990% |
| C | 4942 | 280 | 5.665722% |
| D | 4942 | 3610 | 73.047349% |
Noise dominated data is calculated using 1-second bins in cleaned event files. If a bin has >2000 counts, and if more than 50% of those come from <1% of pixels, then it is considered to be noise-dominated and hence unusable.
| Quadrant | # 1 sec bins | Bins with >0 counts | Bins with >2000 counts | High rate bins dominated by noise | Noise dominated (total time) | Noise dominated (detector-on time) | Marked lightcurve |
|---|---|---|---|---|---|---|---|
| A | 7006 | 4942 | 582 | 582 | 8.31% | 11.78% | 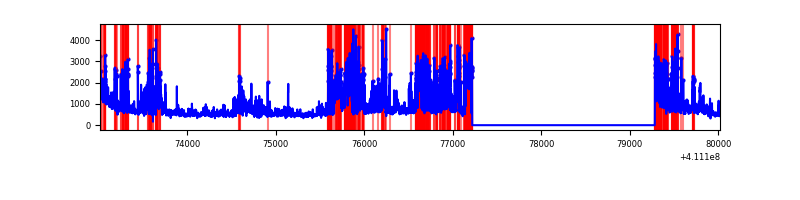 |
| B | 7006 | 4943 | 6 | 6 | 0.09% | 0.12% | 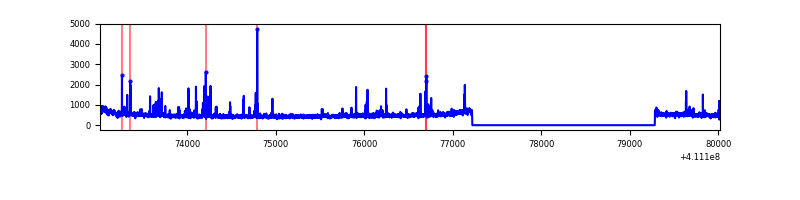 |
| C | 7006 | 4943 | 240 | 240 | 3.43% | 4.86% | 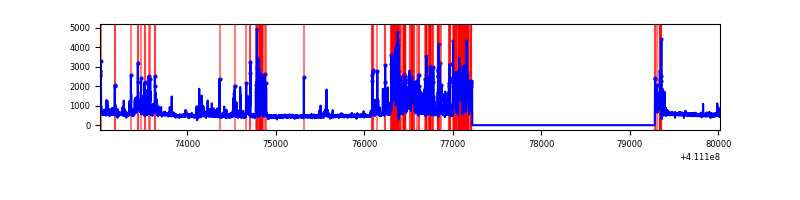 |
| D | 7005 | 4942 | 3105 | 3105 | 44.33% | 62.83% | 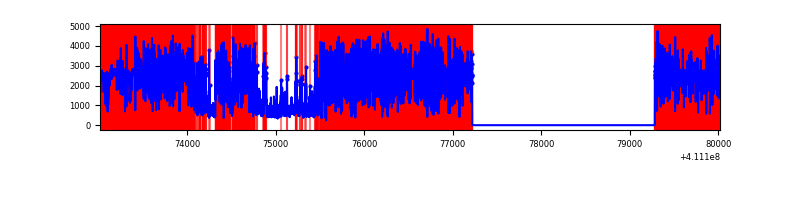 |
Top three noisy pixels from each quadrant. If the there are fewer than three noisy pixels in the level2.evt file, extra rows are filled as -1
| Pixel properties | Quadrant properties | ||||||
|---|---|---|---|---|---|---|---|
| Quadrant | DetID | PixID | Counts | Sigma | Mean | Median | Sigma |
| A | 15 | 222 | 1911126 | 17758.96 | 533 | 523 | 107.6 |
| A | 15 | 174 | 505715 | 4695.74 | 533 | 523 | 107.6 |
| A | 10 | 83 | 385255 | 3576.07 | 533 | 523 | 107.6 |
| B | 5 | 172 | 141484 | 1287.41 | 570 | 555 | 109.5 |
| B | 6 | 203 | 85688 | 777.71 | 570 | 555 | 109.5 |
| B | 5 | 255 | 33495 | 300.91 | 570 | 555 | 109.5 |
| C | 15 | 208 | 1193801 | 9385.54 | 548 | 555 | 127.1 |
| C | 15 | 214 | 205105 | 1608.9 | 548 | 555 | 127.1 |
| C | 9 | 187 | 189781 | 1488.37 | 548 | 555 | 127.1 |
| D | 12 | 235 | 7786020 | 101517.25 | 316 | 308 | 76.7 |
| D | 12 | 0 | 1530871 | 19956.88 | 316 | 308 | 76.7 |
| D | 13 | 249 | 118828 | 1545.37 | 316 | 308 | 76.7 |
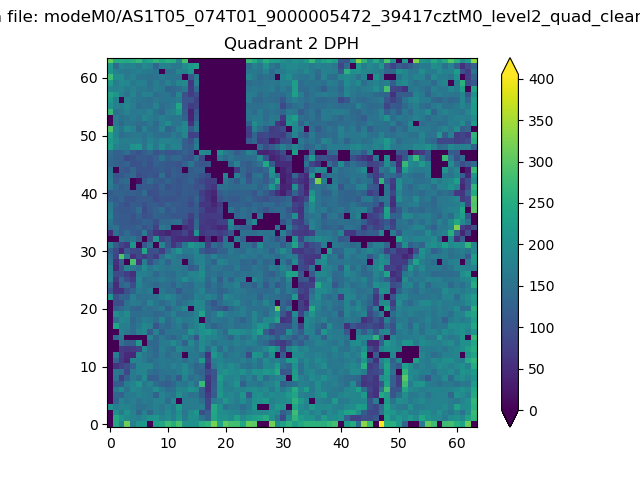
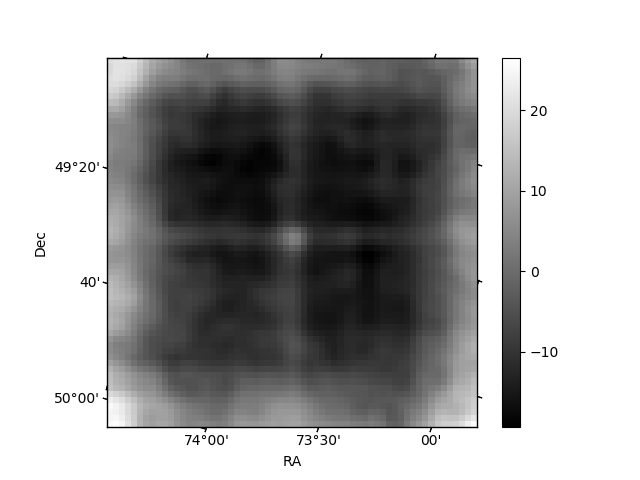
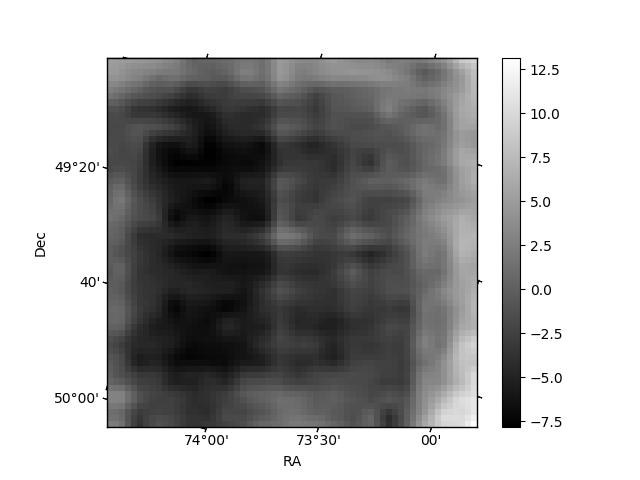
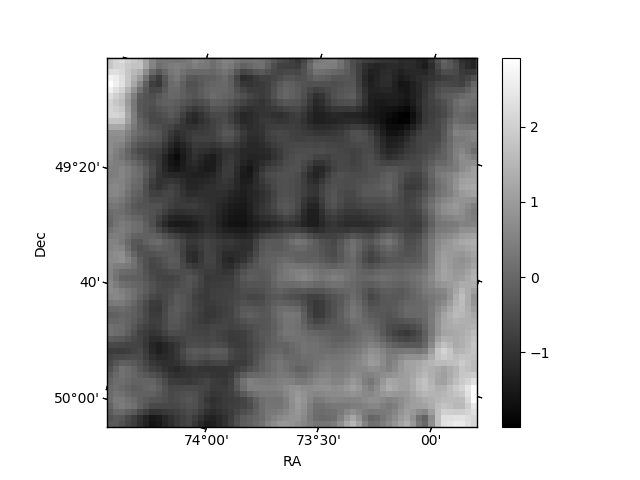
Histogram calculated using DETX and DETY for each event in the final _common_clean file
| Quadrant A | 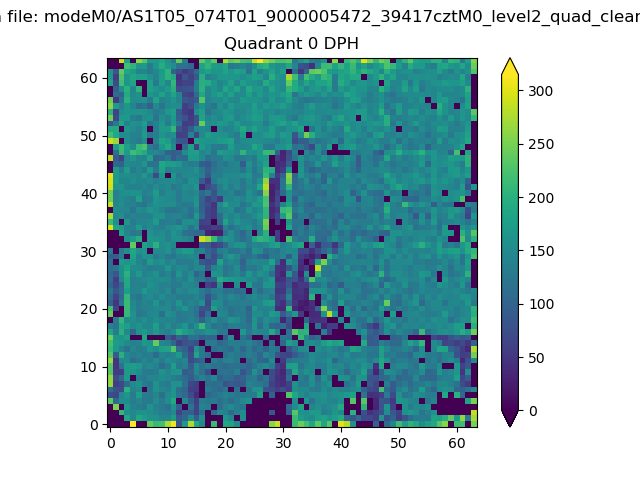 |
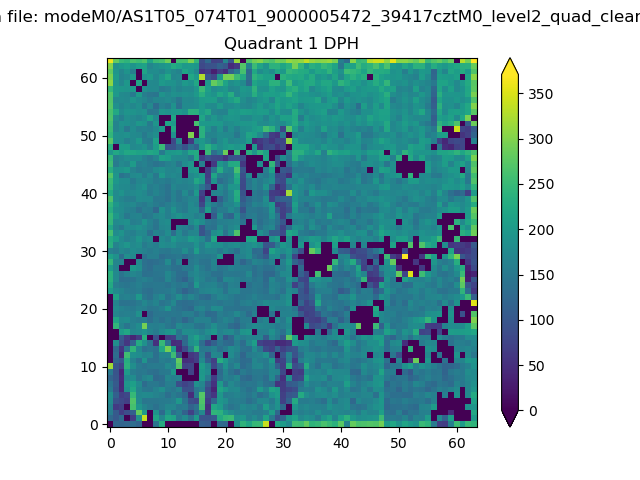 |
Quadrant B |
|---|---|---|---|
| Quadrant D | 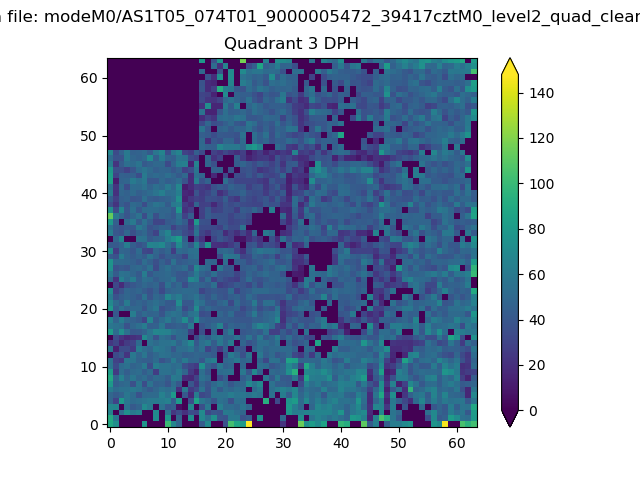 |
 |
Quadrant C |
| Plot type | Count rate plots | Images |
|---|---|---|
| Comparison with Poisson distribution Blue bars denote a histogram of data divided into 1 sec bins. Red curve is a Poisson curve with rate = median count rate of data. |
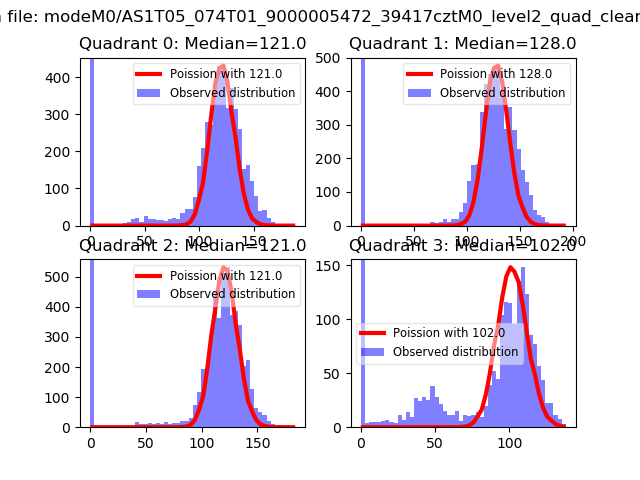 |
 |
| Quadrant-wise count rates Data is divided into 100 sec bins |
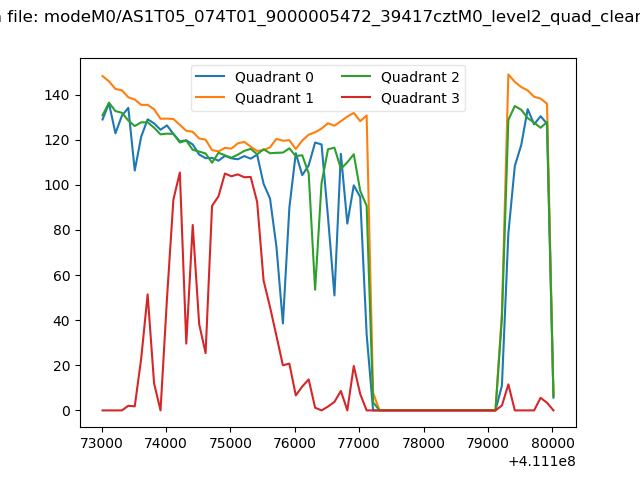 |
|
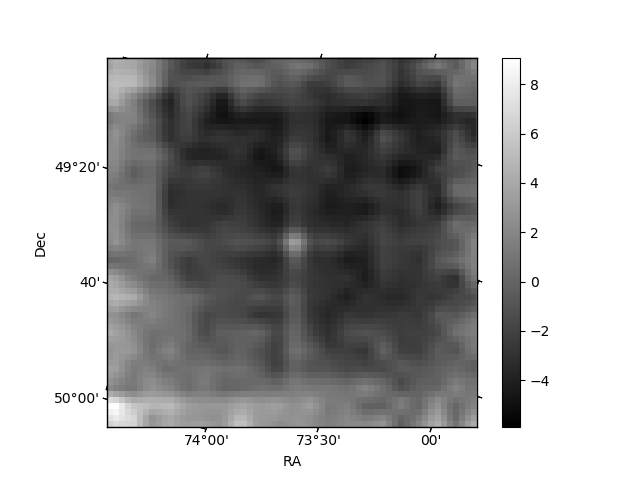
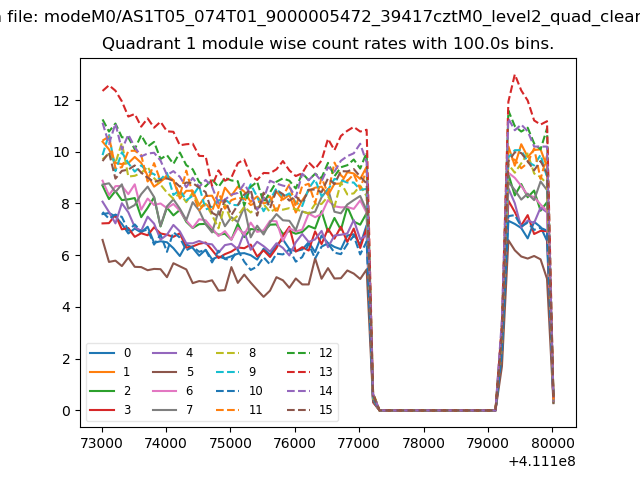
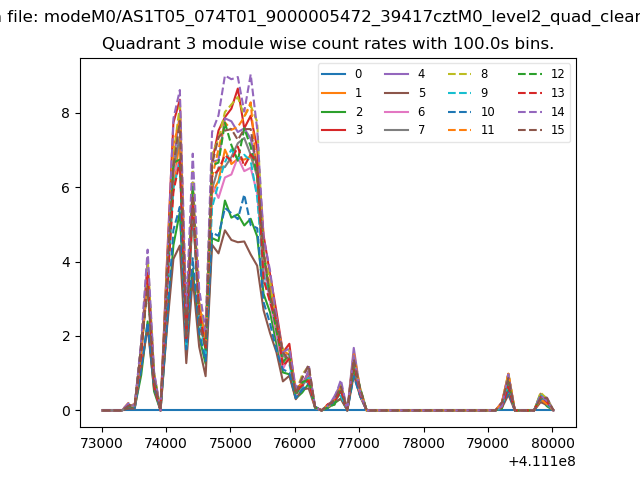
| Module-wise count rates for Quadrant A Data is divided into 100 sec bins |
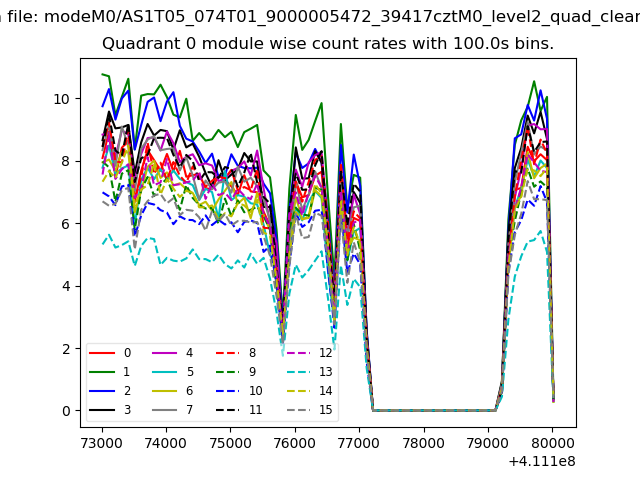 |
 |
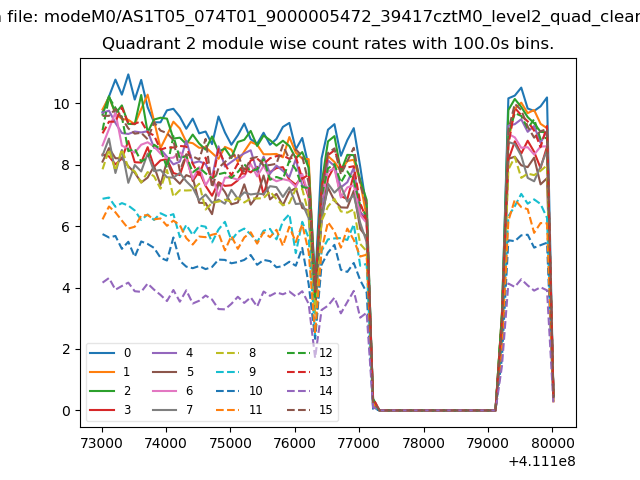
| Module-wise count rates for Quadrant B Data is divided into 100 sec bins |
 |
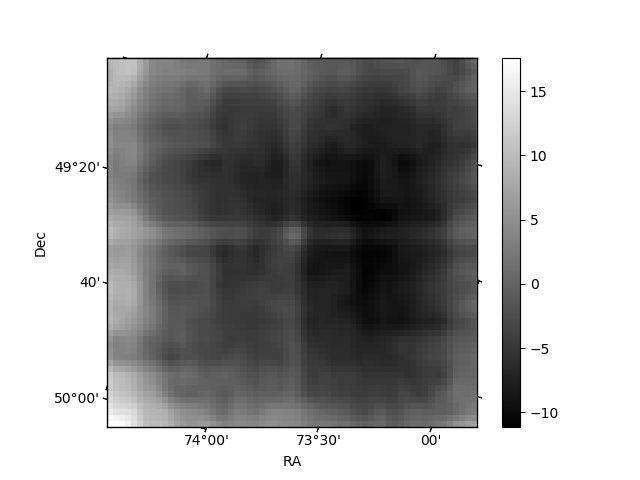 |
| Module-wise count rates for Quadrant C Data is divided into 100 sec bins |
 |
 |
| Module-wise count rates for Quadrant D Data is divided into 100 sec bins |
 |
 |
| Parameter | Plot |
|---|---|
| CZT HV Monitor | 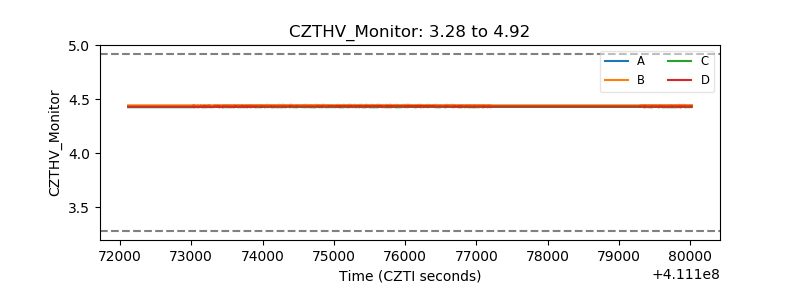 |
| D_VDD | 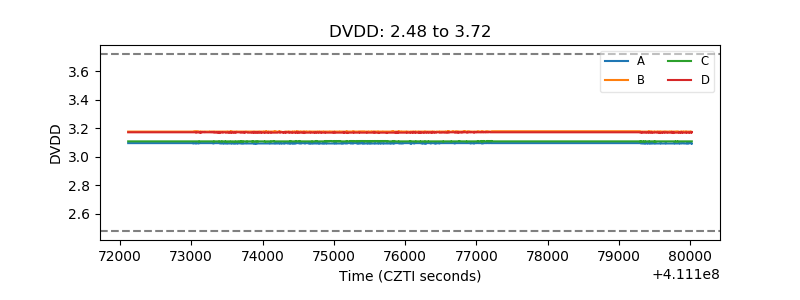 |
| Temperature 1 | 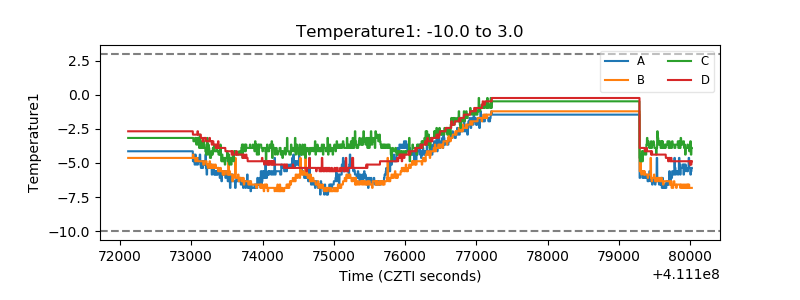 |
| Veto HV Monitor | 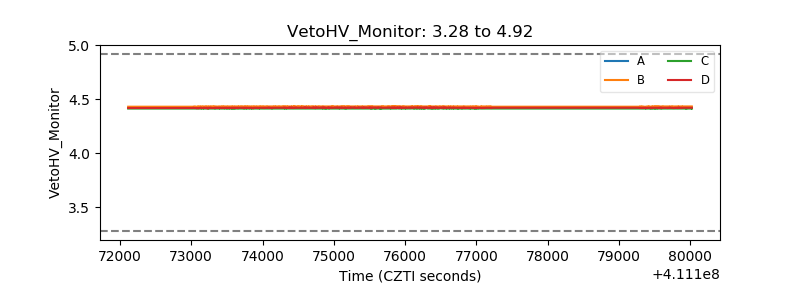 |
| Veto LLD | 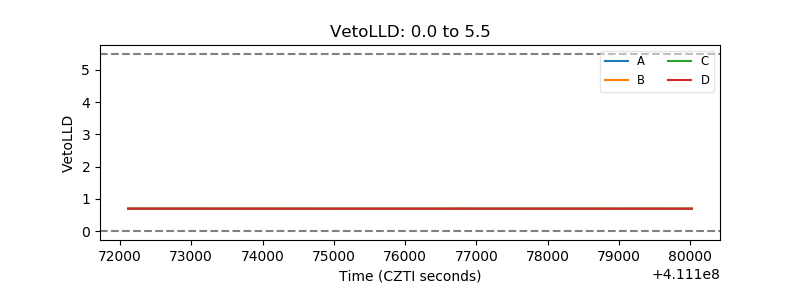 |
| Alpha Counter | 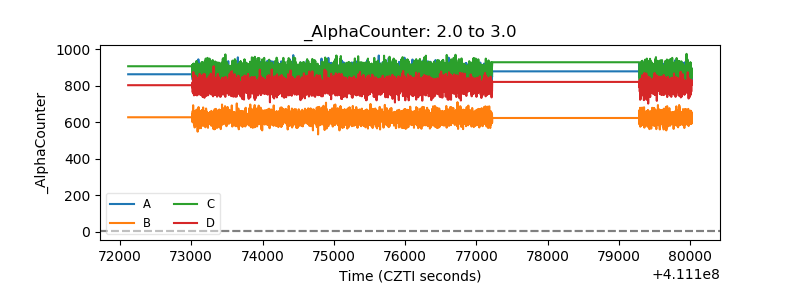 |
| _CPM_Rate | 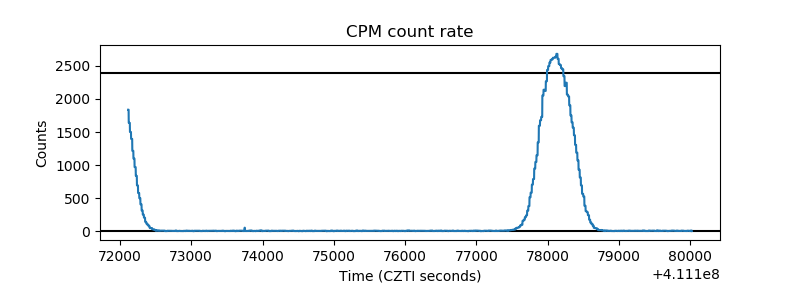 |
| CZT Counter | 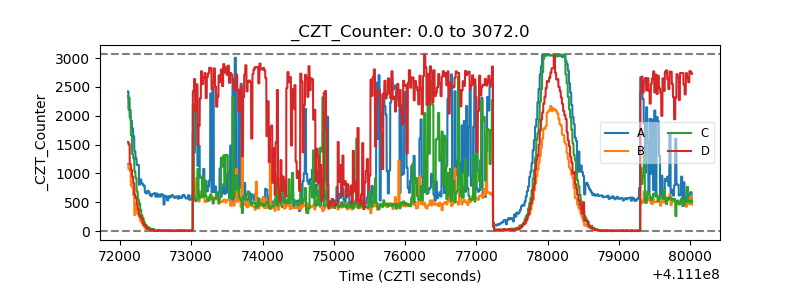 |
| +2.5 Volts monitor | 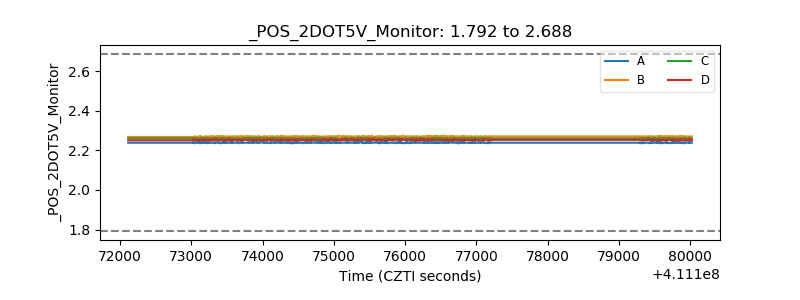 |
| +5 Volts monitor | 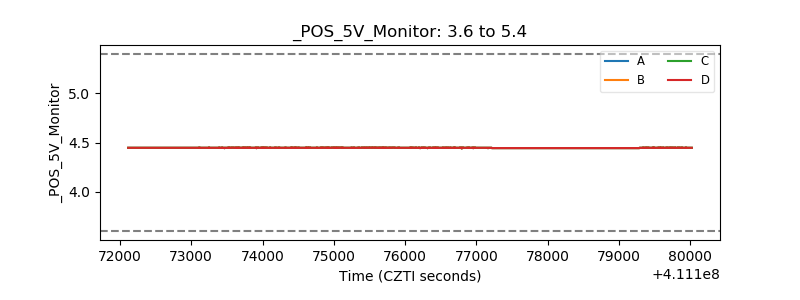 |
| _ROLL_ROT | 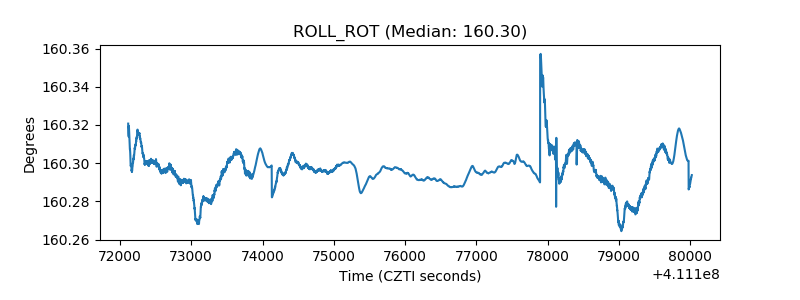 |
| _Roll_DEC | 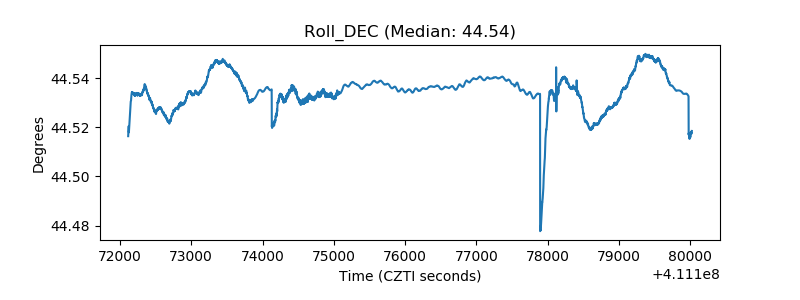 |
| _Roll_RA | 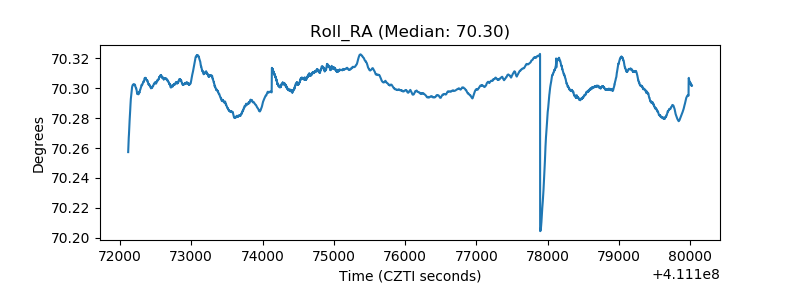 |
| Veto Counter | 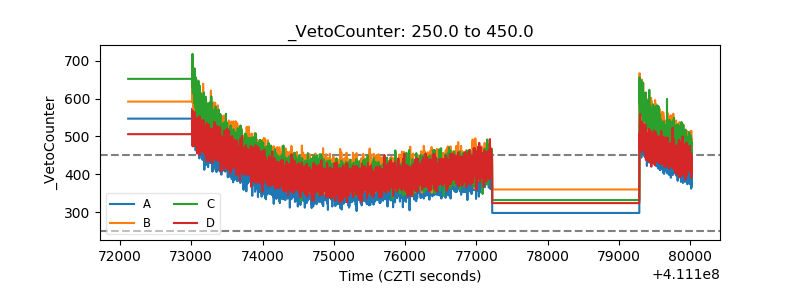 |