| Param | Original file | Final file |
|---|---|---|
| Filename | modeM0/AS1T05_074T01_9000005472_39418cztM0_level2.fits | modeM0/AS1T05_074T01_9000005472_39418cztM0_level2_quad_clean.evt |
| Size (bytes) | 123,347,520 | 13,947,840 |
| Size | 117.6 MB | 13.3 MB |
| Events in quadrant A | 1,012,727 | 106,890 |
| Events in quadrant B | 473,719 | 128,215 |
| Events in quadrant C | 686,389 | 113,125 |
| Events in quadrant D | 2,318,944 | 3,274 |
| Mode M9 | |||
|---|---|---|---|
| Quadrant | BADHDUFLAG | Total packets | Discarded packets |
| A | 0 | 8 | 0 |
| B | 0 | 8 | 0 |
| C | 0 | 8 | 0 |
| D | 0 | 9 | 0 |
| Mode M0 | |||
|---|---|---|---|
| Quadrant | BADHDUFLAG | Total packets | Discarded packets |
| A | 0 | 3643 | 1 |
| B | 0 | 1922 | 1 |
| C | 0 | 2563 | 1 |
| D | 0 | 7528 | 1 |
| Mode SS | |||
|---|---|---|---|
| Quadrant | BADHDUFLAG | Total packets | Discarded packets |
| A | 0 | 18 | 0 |
| B | 0 | 18 | 0 |
| C | 0 | 18 | 0 |
| D | 0 | 18 | 0 |
| Quadrant | Total seconds | Saturated seconds | Saturation percentage |
|---|---|---|---|
| A | 915 | 128 | 13.989071% |
| B | 915 | 3 | 0.327869% |
| C | 915 | 57 | 6.229508% |
| D | 915 | 894 | 97.704918% |
Noise dominated data is calculated using 1-second bins in cleaned event files. If a bin has >2000 counts, and if more than 50% of those come from <1% of pixels, then it is considered to be noise-dominated and hence unusable.
| Quadrant | # 1 sec bins | Bins with >0 counts | Bins with >2000 counts | High rate bins dominated by noise | Noise dominated (total time) | Noise dominated (detector-on time) | Marked lightcurve |
|---|---|---|---|---|---|---|---|
| A | 915 | 915 | 122 | 122 | 13.33% | 13.33% | 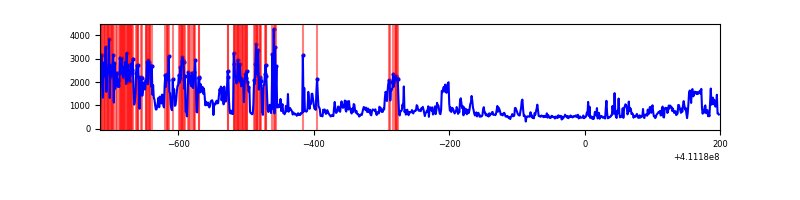 |
| B | 915 | 915 | 0 | 0 | 0.00% | 0.00% | 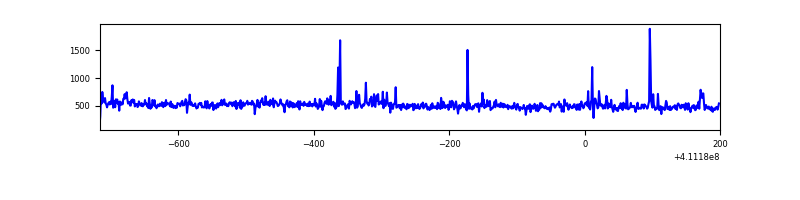 |
| C | 915 | 915 | 48 | 48 | 5.25% | 5.25% | 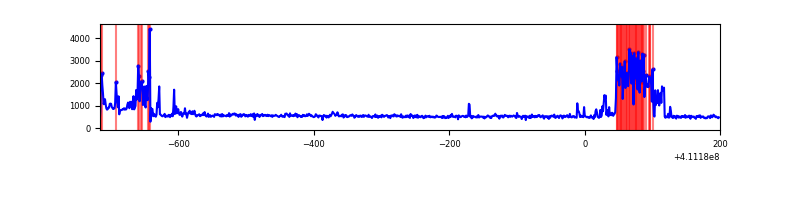 |
| D | 914 | 914 | 756 | 756 | 82.71% | 82.71% | 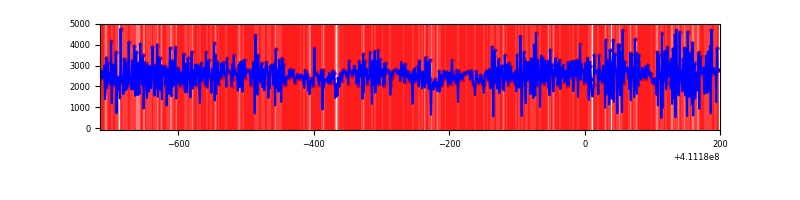 |
Top three noisy pixels from each quadrant. If the there are fewer than three noisy pixels in the level2.evt file, extra rows are filled as -1
| Pixel properties | Quadrant properties | ||||||
|---|---|---|---|---|---|---|---|
| Quadrant | DetID | PixID | Counts | Sigma | Mean | Median | Sigma |
| A | 15 | 222 | 462194 | 20562.33 | 102 | 99 | 22.5 |
| A | 10 | 83 | 117789 | 5236.98 | 102 | 99 | 22.5 |
| A | 13 | 248 | 33115 | 1469.15 | 102 | 99 | 22.5 |
| B | 6 | 203 | 13160 | 566.41 | 110 | 107 | 23.0 |
| B | 5 | 172 | 12440 | 535.16 | 110 | 107 | 23.0 |
| B | 5 | 255 | 11423 | 491.03 | 110 | 107 | 23.0 |
| C | 15 | 208 | 176984 | 6671.88 | 105 | 107 | 26.5 |
| C | 10 | 70 | 49901 | 1878.25 | 105 | 107 | 26.5 |
| C | 15 | 214 | 41159 | 1548.5 | 105 | 107 | 26.5 |
| D | 12 | 235 | 1468932 | 119715.5 | 43 | 41 | 12.3 |
| D | 12 | 0 | 597590 | 48700.6 | 43 | 41 | 12.3 |
| D | 12 | 227 | 30225 | 2460.01 | 43 | 41 | 12.3 |
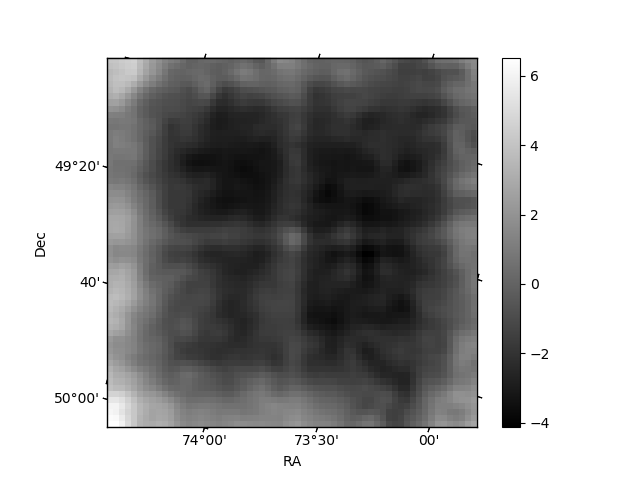
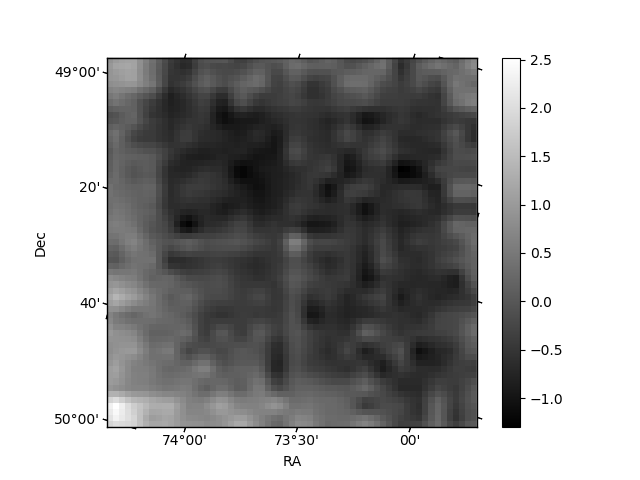
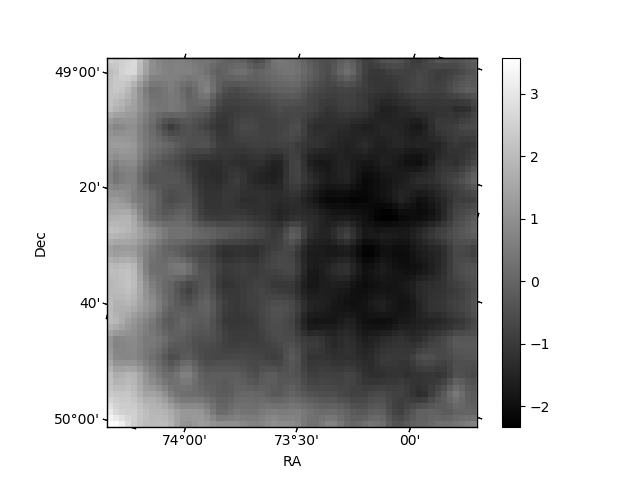
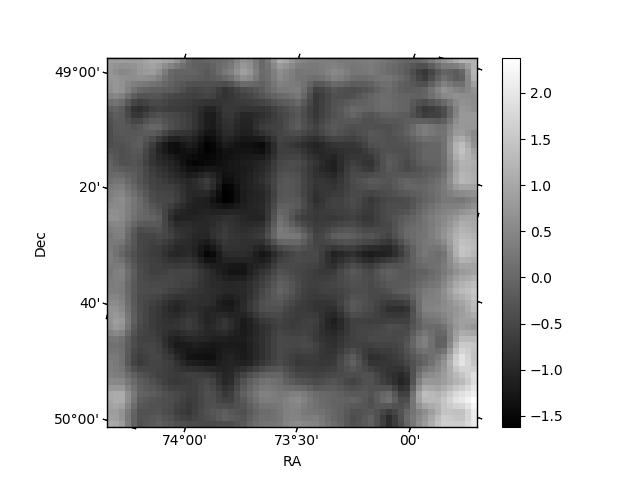
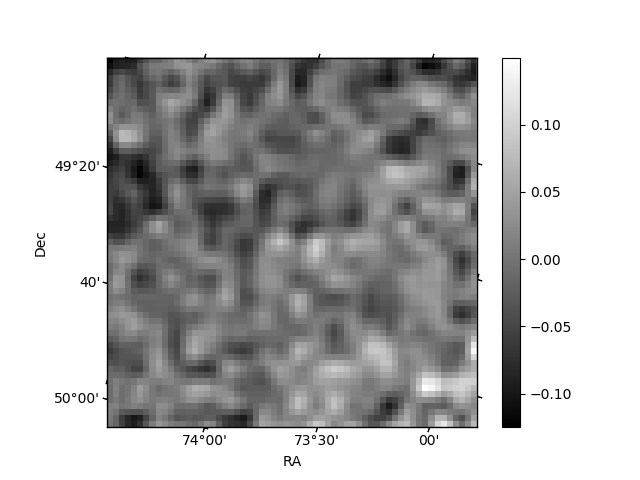
Histogram calculated using DETX and DETY for each event in the final _common_clean file
| Quadrant A | 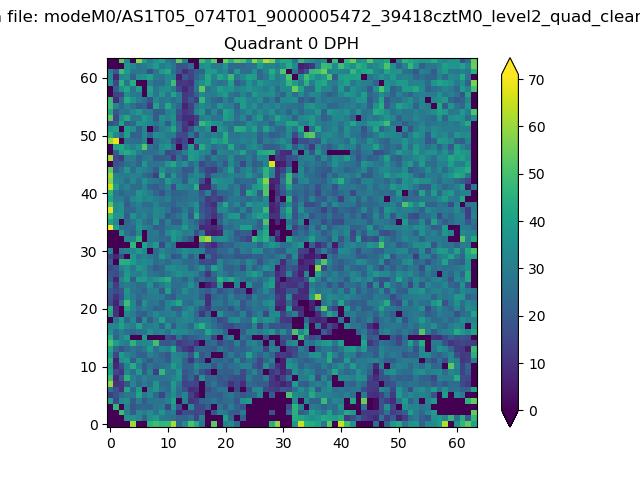 |
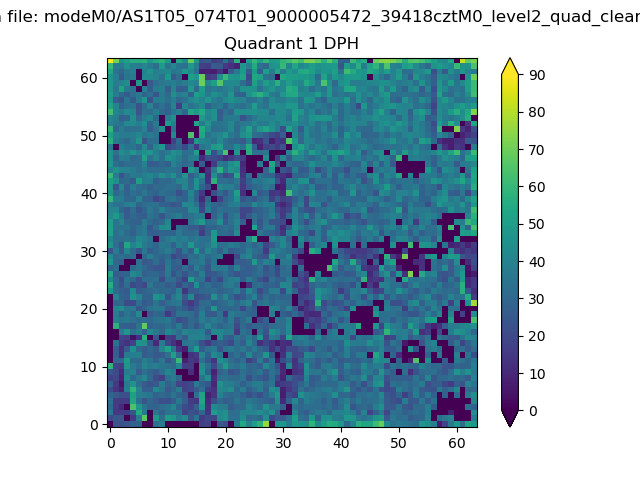 |
Quadrant B |
|---|---|---|---|
| Quadrant D | 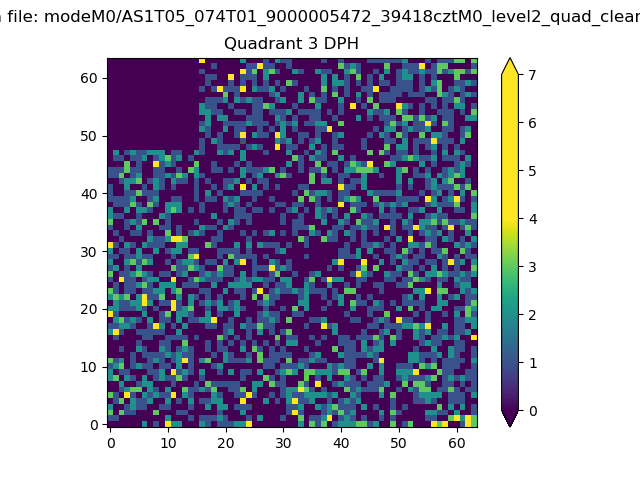 |
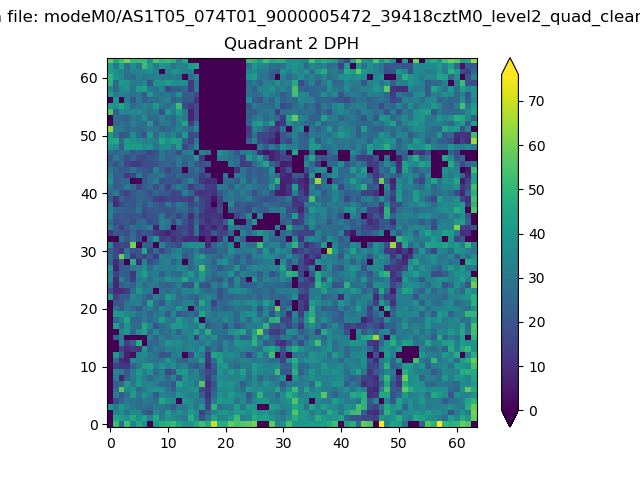 |
Quadrant C |
| Plot type | Count rate plots | Images |
|---|---|---|
| Comparison with Poisson distribution Blue bars denote a histogram of data divided into 1 sec bins. Red curve is a Poisson curve with rate = median count rate of data. |
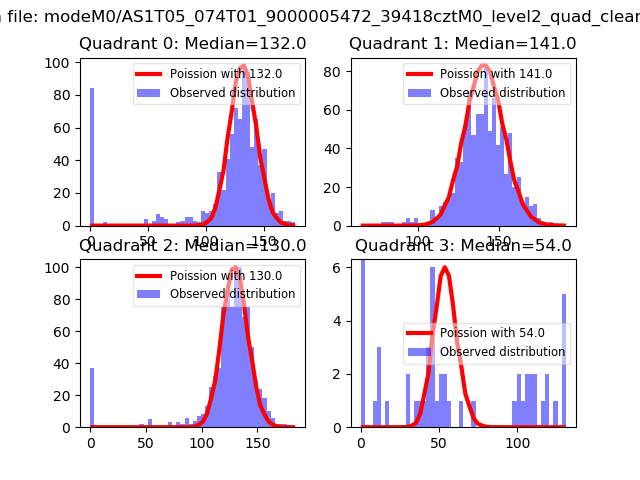 |
 |
| Quadrant-wise count rates Data is divided into 100 sec bins |
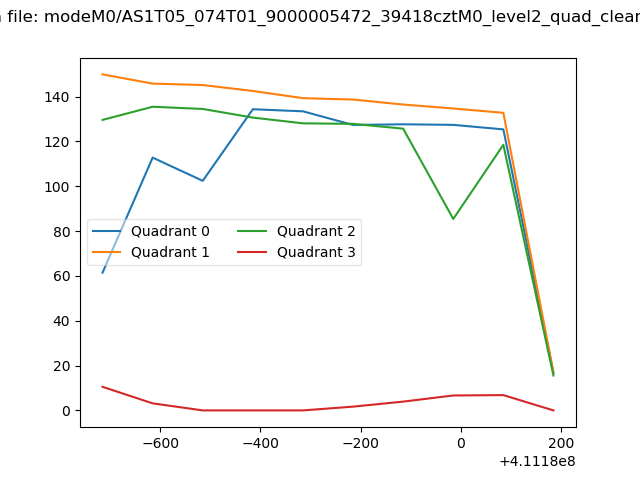 |
|
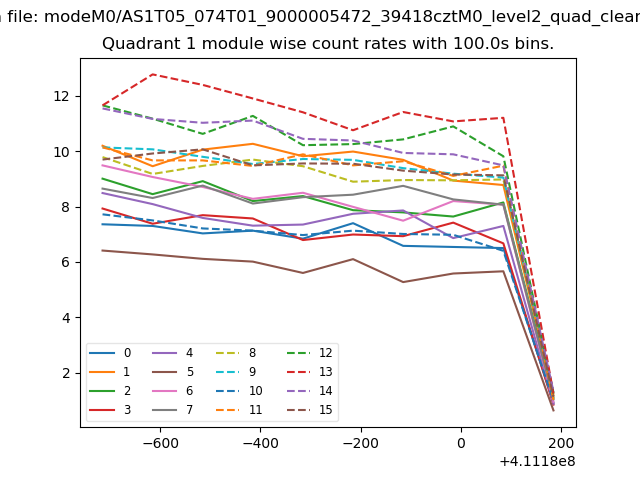
| Module-wise count rates for Quadrant A Data is divided into 100 sec bins |
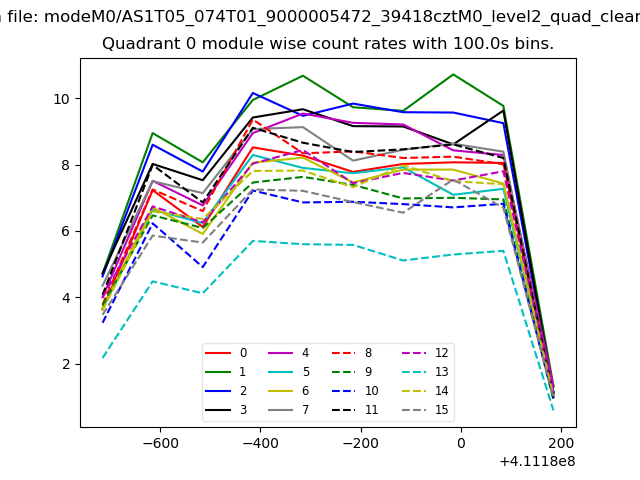 |
 |
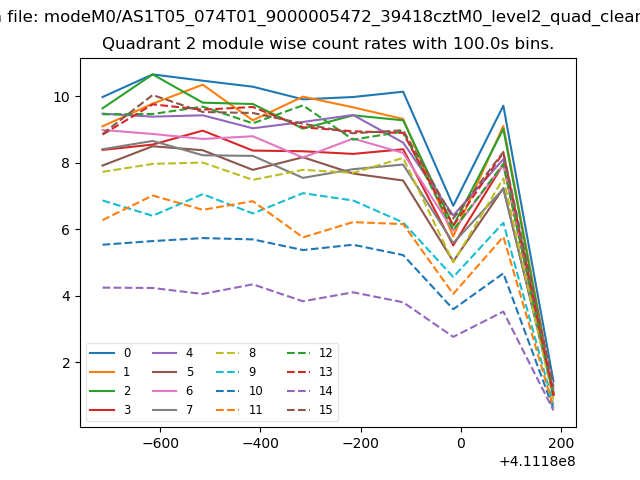
| Module-wise count rates for Quadrant B Data is divided into 100 sec bins |
 |
 |
| Module-wise count rates for Quadrant C Data is divided into 100 sec bins |
 |
 |
| Module-wise count rates for Quadrant D Data is divided into 100 sec bins |
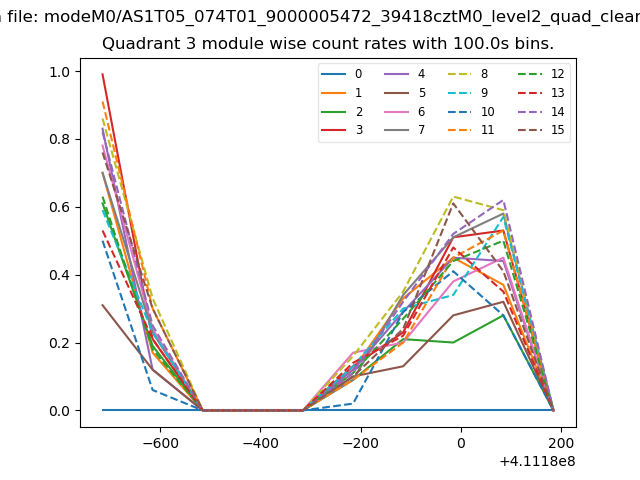 |
 |
| Parameter | Plot |
|---|---|
| CZT HV Monitor | 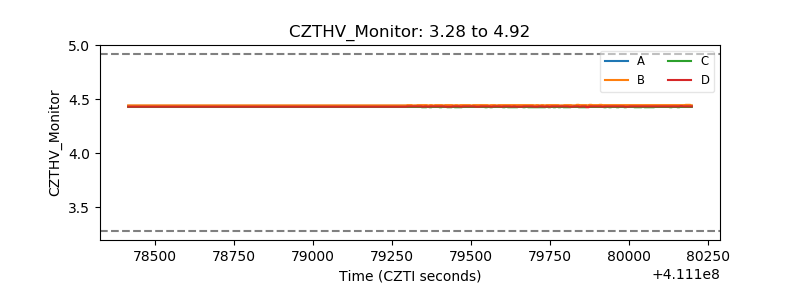 |
| D_VDD | 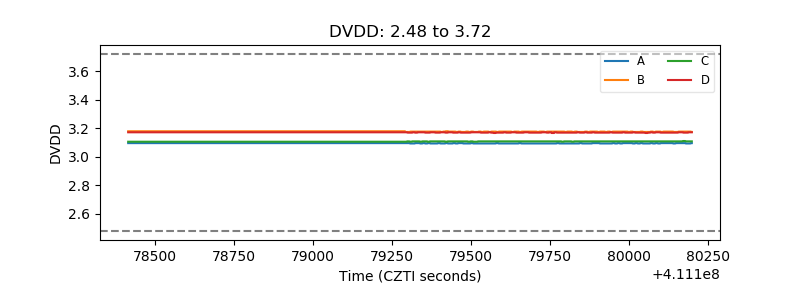 |
| Temperature 1 | 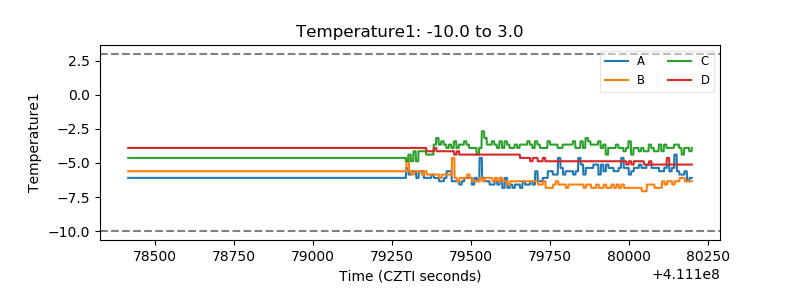 |
| Veto HV Monitor | 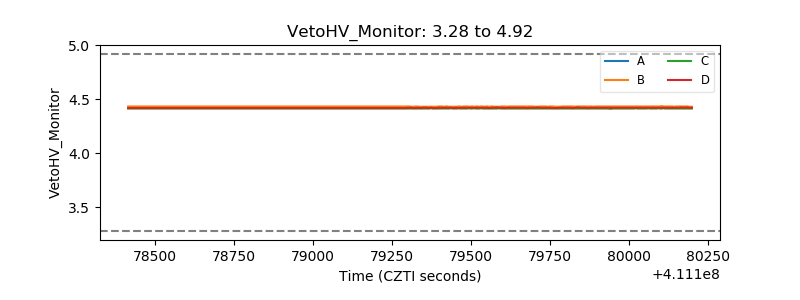 |
| Veto LLD | 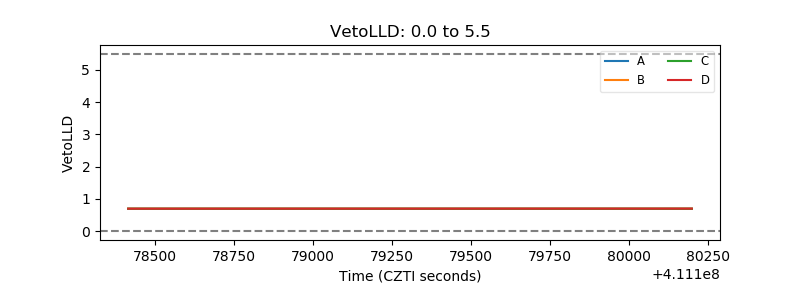 |
| Alpha Counter | 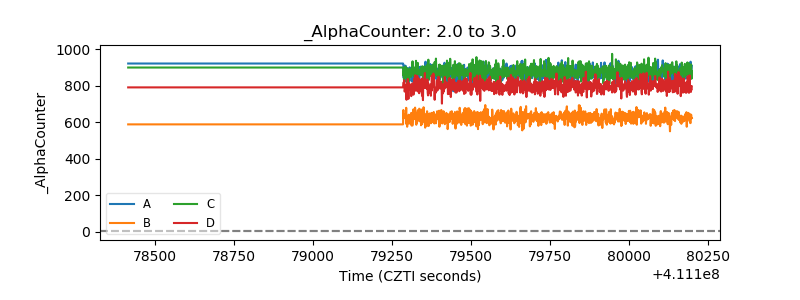 |
| _CPM_Rate | 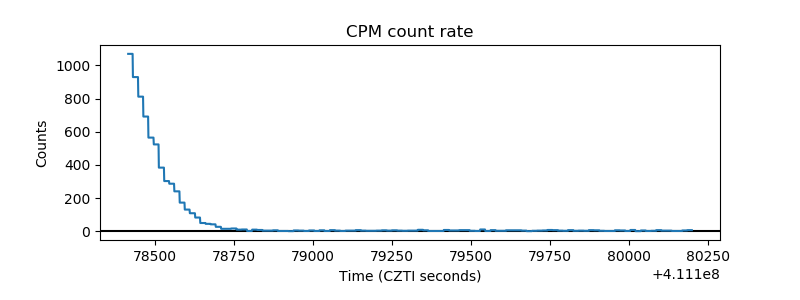 |
| CZT Counter | 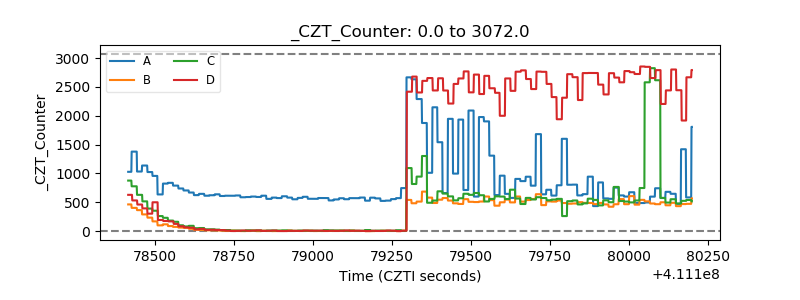 |
| +2.5 Volts monitor | 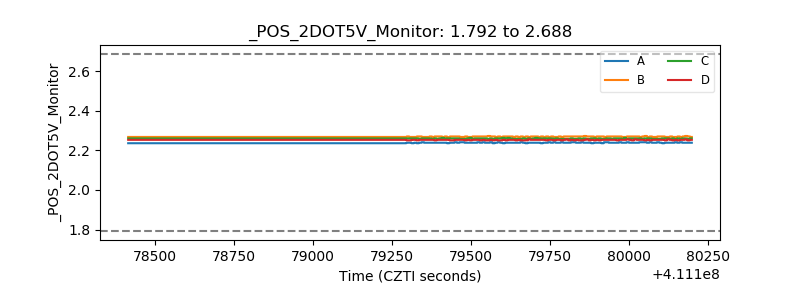 |
| +5 Volts monitor | 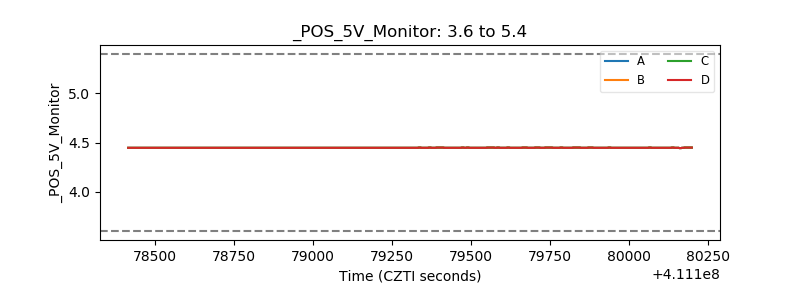 |
| _ROLL_ROT | 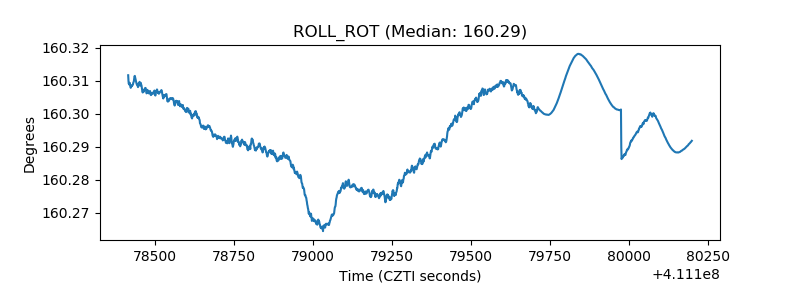 |
| _Roll_DEC | 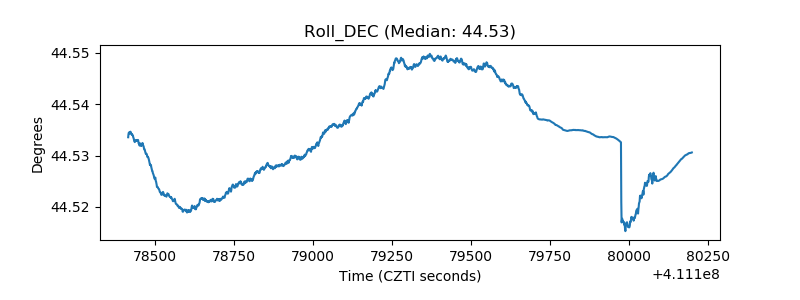 |
| _Roll_RA | 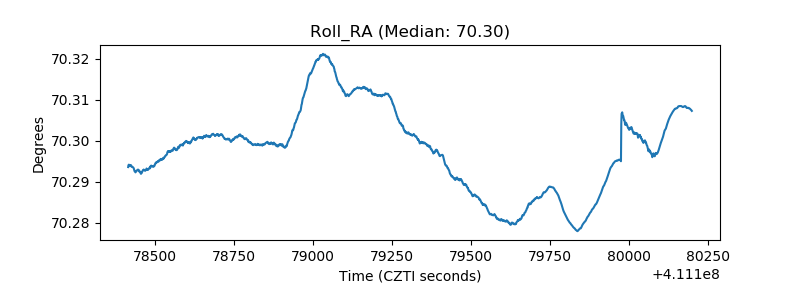 |
| Veto Counter | 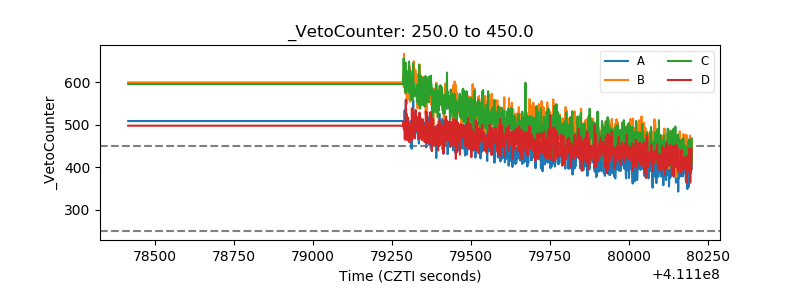 |