| Param | Original file | Final file |
|---|---|---|
| Filename | modeM0/AS1A12_077T06_9000005474_39418cztM0_level2.fits | modeM0/AS1A12_077T06_9000005474_39418cztM0_level2_quad_clean.evt |
| Size (bytes) | 489,844,800 | 45,362,880 |
| Size | 467.2 MB | 43.3 MB |
| Events in quadrant A | 4,750,896 | 288,525 |
| Events in quadrant B | 1,715,193 | 422,621 |
| Events in quadrant C | 3,061,502 | 377,374 |
| Events in quadrant D | 8,344,400 | 47,145 |
| Mode M0 | |||
|---|---|---|---|
| Quadrant | BADHDUFLAG | Total packets | Discarded packets |
| A | 0 | 16395 | 2 |
| B | 0 | 7264 | 1 |
| C | 0 | 11322 | 1 |
| D | 0 | 27065 | 1 |
| Mode SS | |||
|---|---|---|---|
| Quadrant | BADHDUFLAG | Total packets | Discarded packets |
| A | 0 | 70 | 0 |
| B | 0 | 70 | 0 |
| C | 0 | 70 | 0 |
| D | 0 | 70 | 0 |
| Mode M9 | |||
|---|---|---|---|
| Quadrant | BADHDUFLAG | Total packets | Discarded packets |
| A | 0 | 21 | 0 |
| B | 0 | 21 | 0 |
| C | 0 | 21 | 0 |
| D | 0 | 21 | 0 |
| Quadrant | Total seconds | Saturated seconds | Saturation percentage |
|---|---|---|---|
| A | 3346 | 1187 | 35.475194% |
| B | 3346 | 21 | 0.627615% |
| C | 3346 | 251 | 7.501494% |
| D | 3346 | 3020 | 90.257023% |
Noise dominated data is calculated using 1-second bins in cleaned event files. If a bin has >2000 counts, and if more than 50% of those come from <1% of pixels, then it is considered to be noise-dominated and hence unusable.
| Quadrant | # 1 sec bins | Bins with >0 counts | Bins with >2000 counts | High rate bins dominated by noise | Noise dominated (total time) | Noise dominated (detector-on time) | Marked lightcurve |
|---|---|---|---|---|---|---|---|
| A | 5469 | 3347 | 891 | 891 | 16.29% | 26.62% | 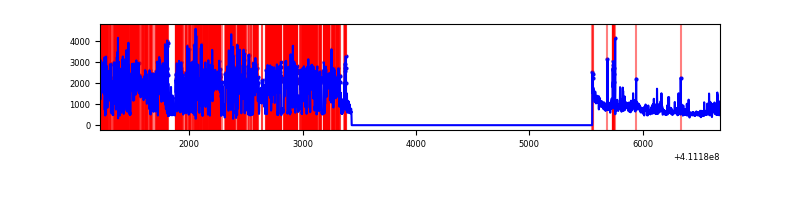 |
| B | 5469 | 3347 | 9 | 9 | 0.16% | 0.27% | 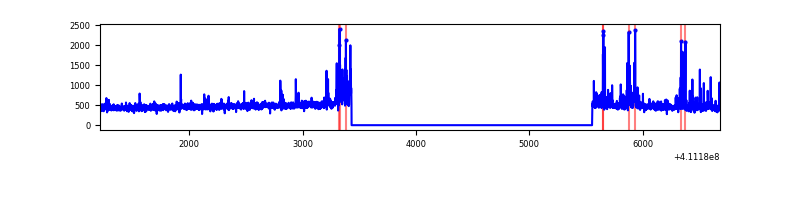 |
| C | 5469 | 3347 | 196 | 196 | 3.58% | 5.86% | 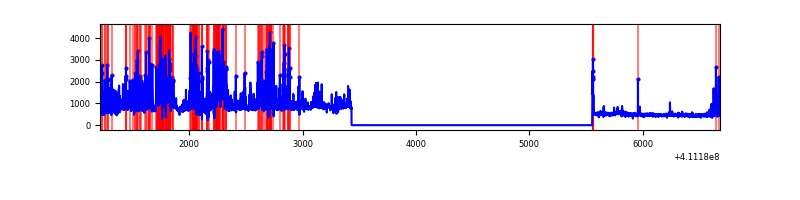 |
| D | 5468 | 3346 | 2660 | 2660 | 48.65% | 79.50% | 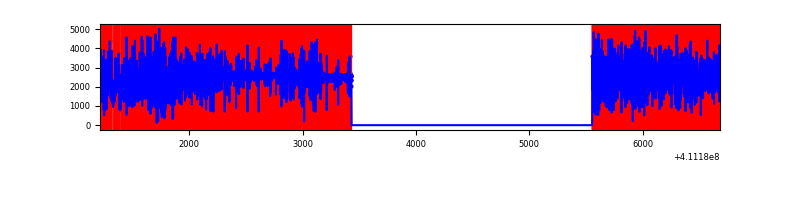 |
Top three noisy pixels from each quadrant. If the there are fewer than three noisy pixels in the level2.evt file, extra rows are filled as -1
| Pixel properties | Quadrant properties | ||||||
|---|---|---|---|---|---|---|---|
| Quadrant | DetID | PixID | Counts | Sigma | Mean | Median | Sigma |
| A | 15 | 222 | 2760259 | 38841.89 | 347 | 341 | 71.1 |
| A | 15 | 174 | 268815 | 3778.39 | 347 | 341 | 71.1 |
| A | 10 | 83 | 239149 | 3360.88 | 347 | 341 | 71.1 |
| B | 5 | 255 | 97771 | 1294.4 | 387 | 377 | 75.2 |
| B | 5 | 172 | 46531 | 613.4 | 387 | 377 | 75.2 |
| B | 15 | 85 | 41840 | 551.06 | 387 | 377 | 75.2 |
| C | 15 | 208 | 1032089 | 12011.37 | 367 | 370 | 85.9 |
| C | 10 | 70 | 437426 | 5088.25 | 367 | 370 | 85.9 |
| C | 15 | 214 | 136965 | 1590.25 | 367 | 370 | 85.9 |
| D | 12 | 235 | 6109737 | 130870.87 | 184 | 179 | 46.7 |
| D | 12 | 0 | 1273915 | 27284.29 | 184 | 179 | 46.7 |
| D | 12 | 227 | 107278 | 2294.13 | 184 | 179 | 46.7 |
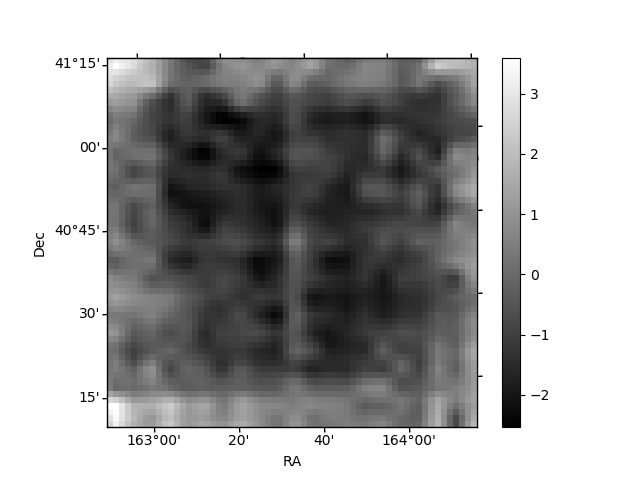
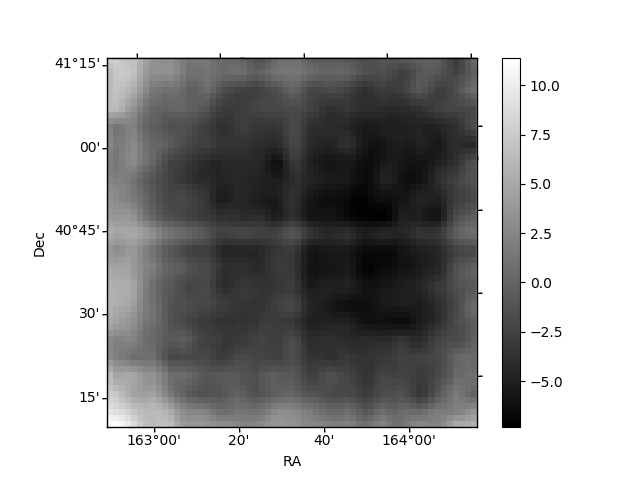
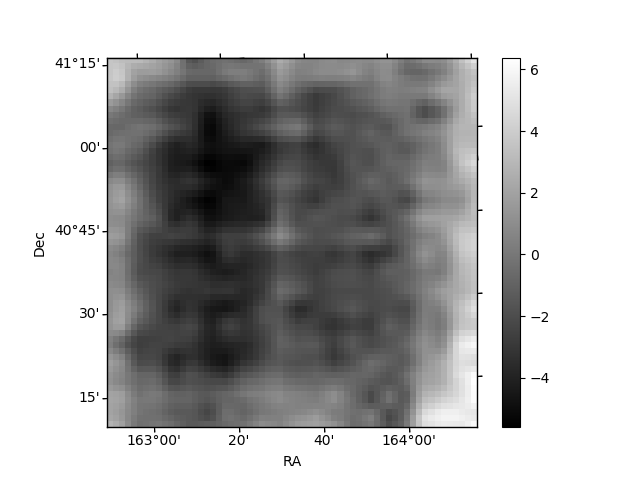
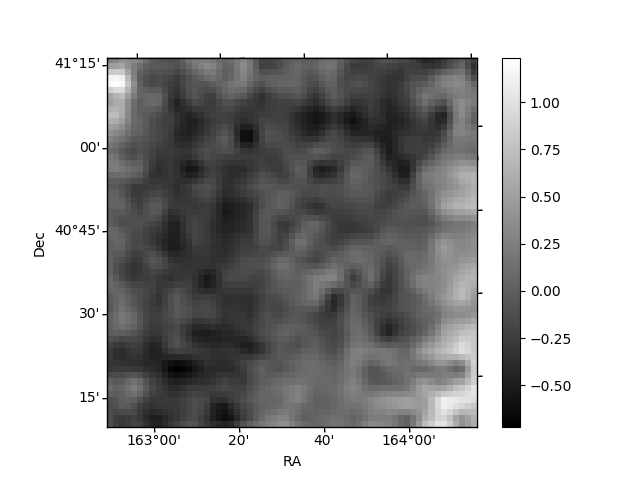
Histogram calculated using DETX and DETY for each event in the final _common_clean file
| Quadrant A | 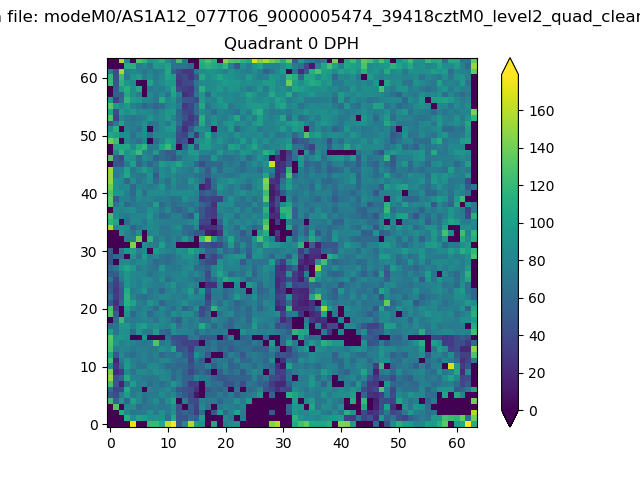 |
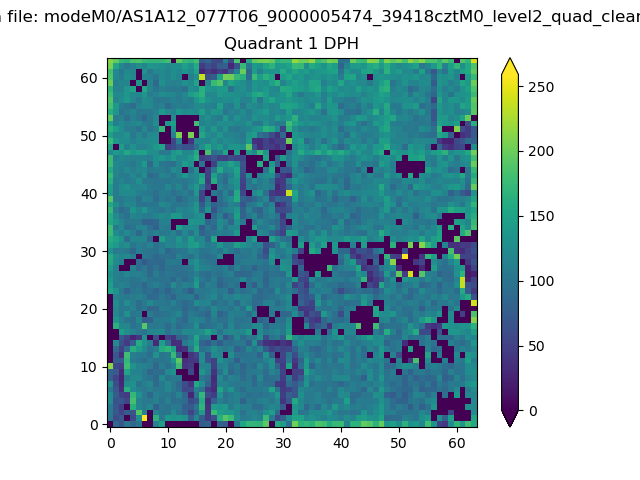 |
Quadrant B |
|---|---|---|---|
| Quadrant D | 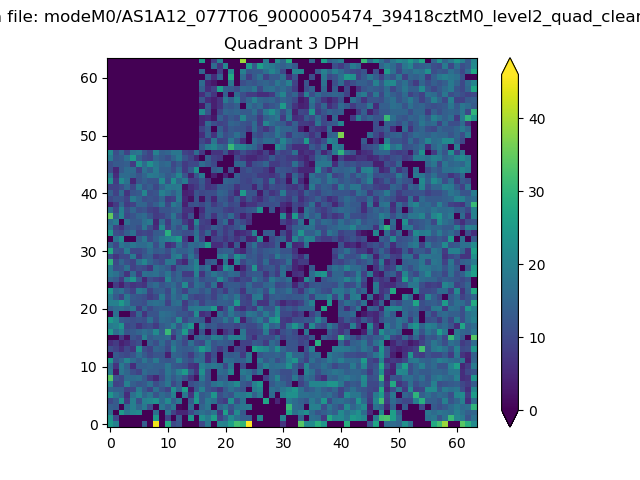 |
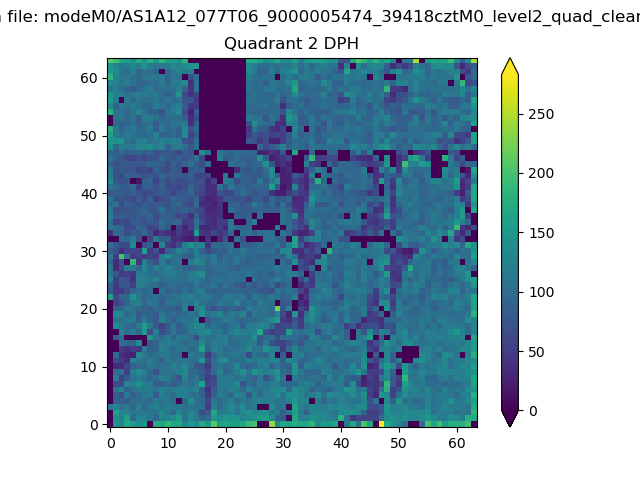 |
Quadrant C |
| Plot type | Count rate plots | Images |
|---|---|---|
| Comparison with Poisson distribution Blue bars denote a histogram of data divided into 1 sec bins. Red curve is a Poisson curve with rate = median count rate of data. |
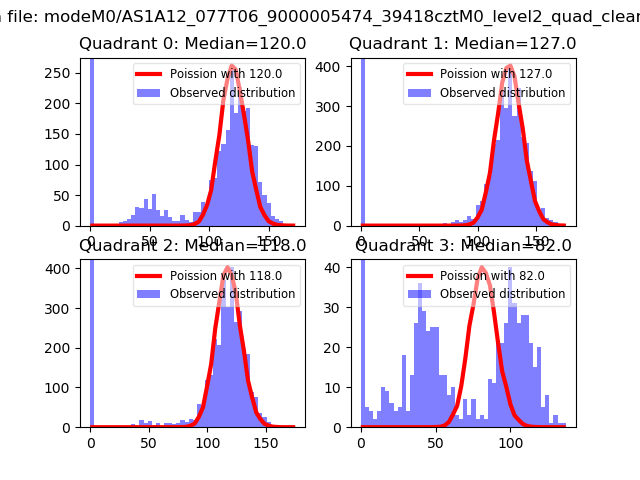 |
 |
| Quadrant-wise count rates Data is divided into 100 sec bins |
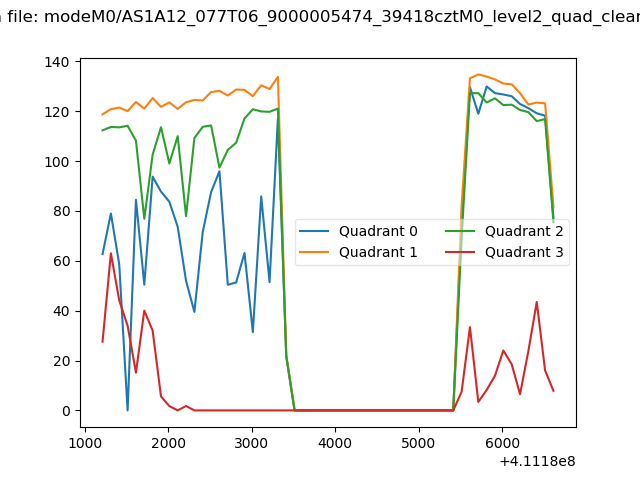 |
|
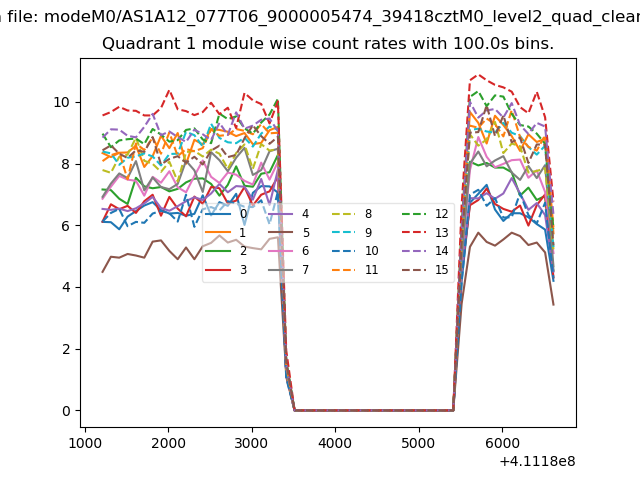
| Module-wise count rates for Quadrant A Data is divided into 100 sec bins |
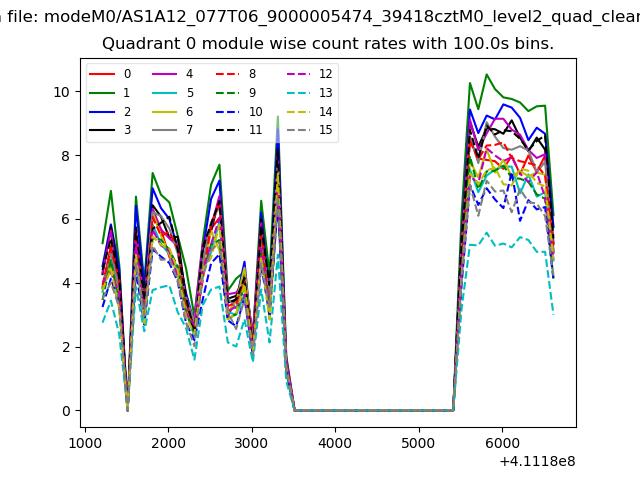 |
 |
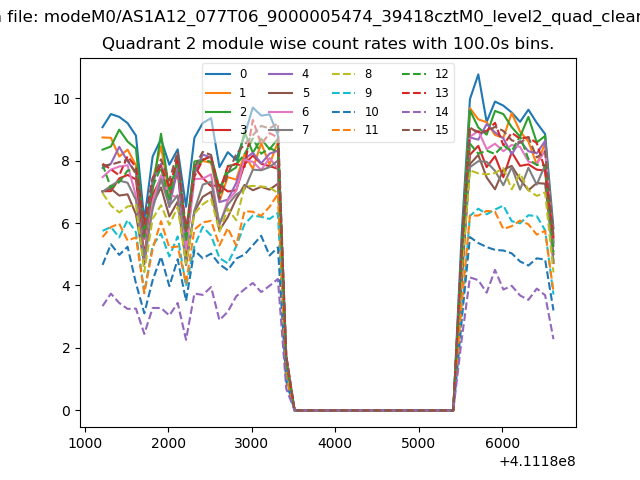
| Module-wise count rates for Quadrant B Data is divided into 100 sec bins |
 |
 |
| Module-wise count rates for Quadrant C Data is divided into 100 sec bins |
 |
 |
| Module-wise count rates for Quadrant D Data is divided into 100 sec bins |
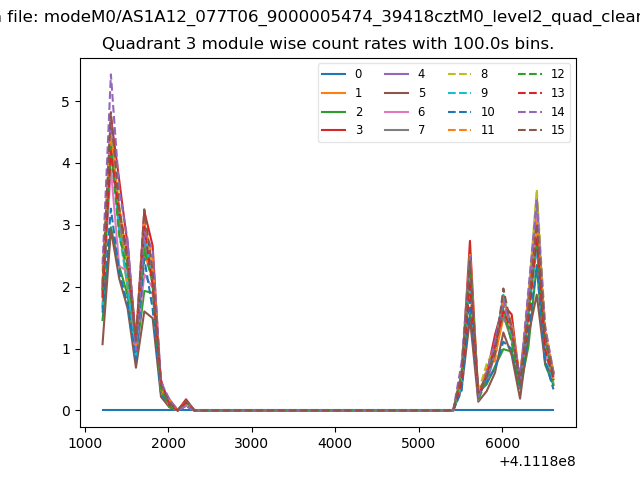 |
 |
| Parameter | Plot |
|---|---|
| CZT HV Monitor | 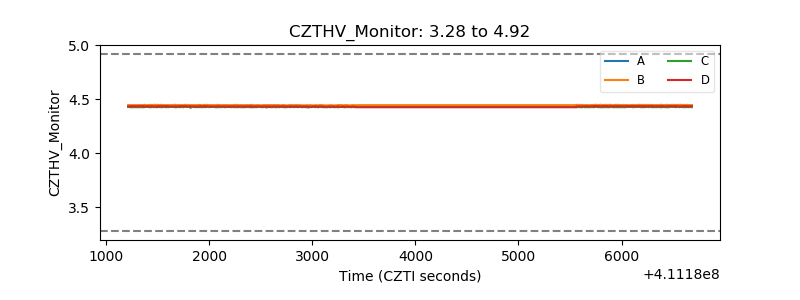 |
| D_VDD | 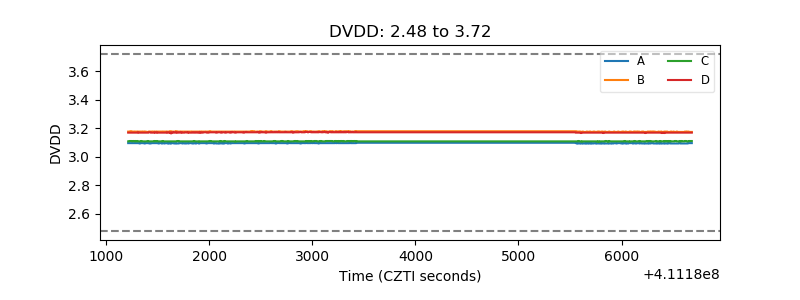 |
| Temperature 1 | 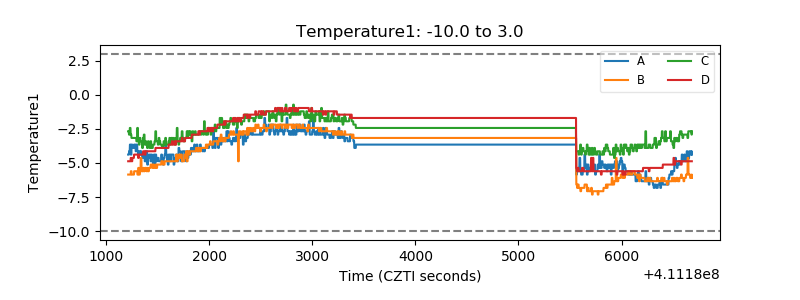 |
| Veto HV Monitor | 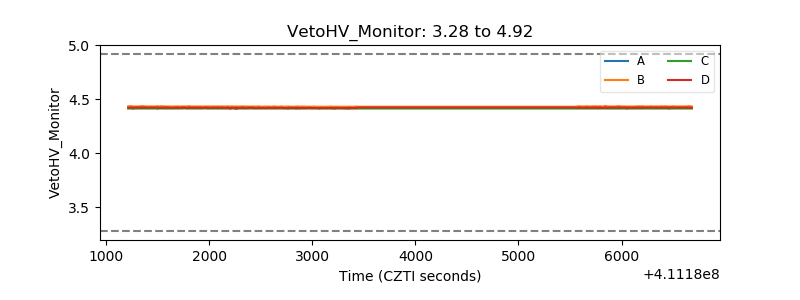 |
| Veto LLD | 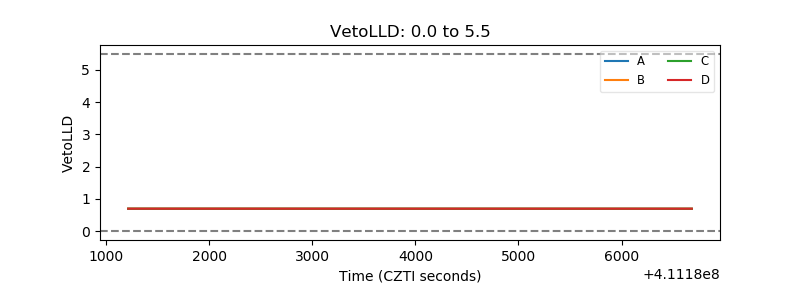 |
| Alpha Counter | 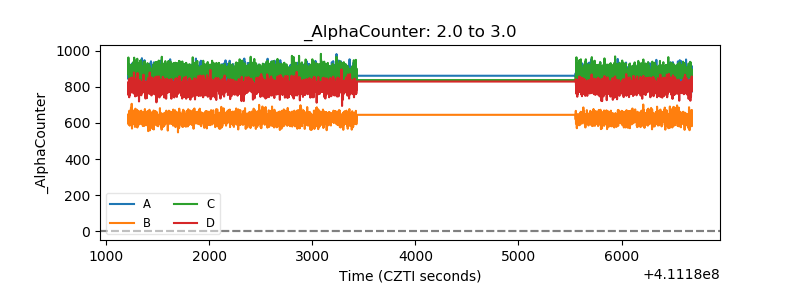 |
| _CPM_Rate | 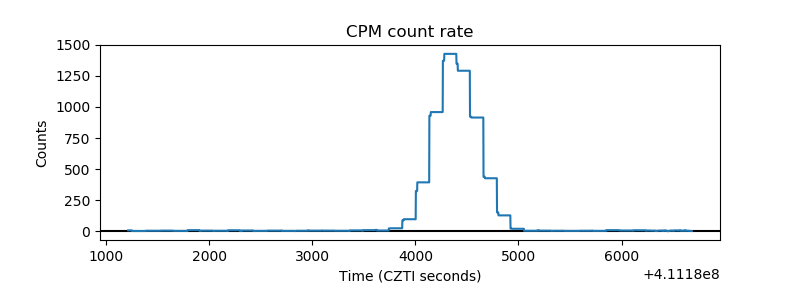 |
| CZT Counter | 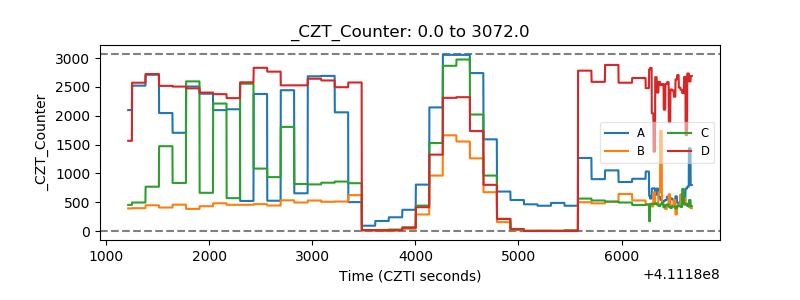 |
| +2.5 Volts monitor | 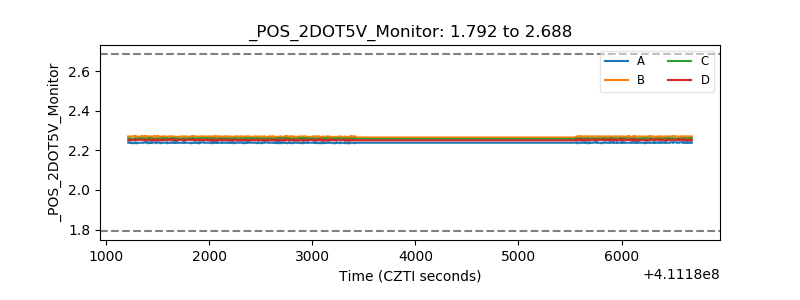 |
| +5 Volts monitor |  |
| _ROLL_ROT | 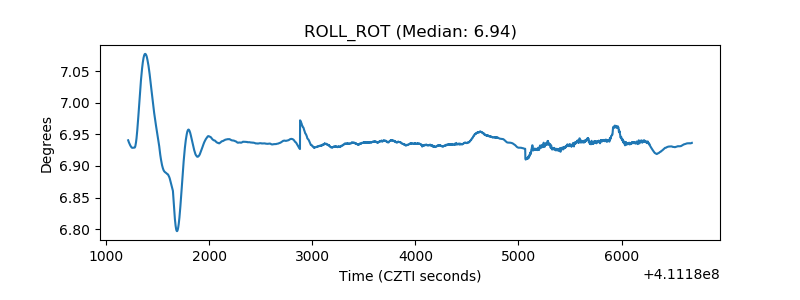 |
| _Roll_DEC | 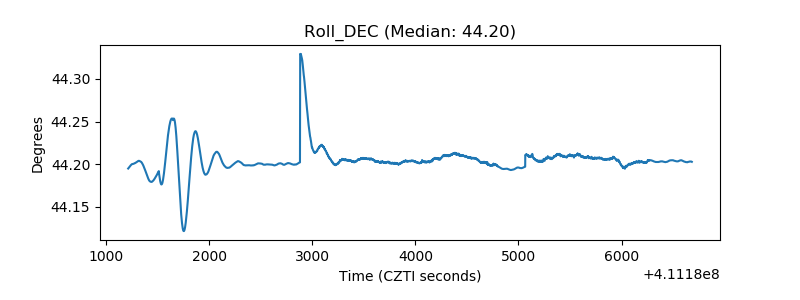 |
| _Roll_RA | 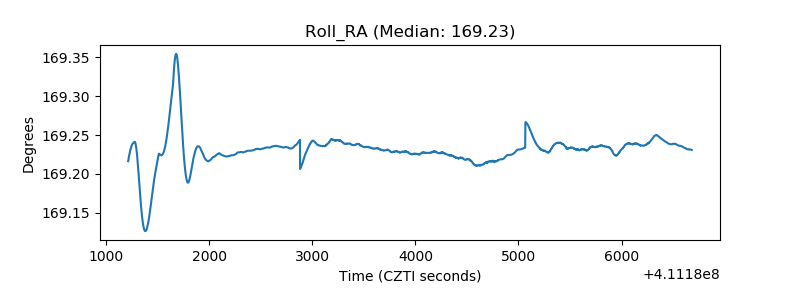 |
| Veto Counter | 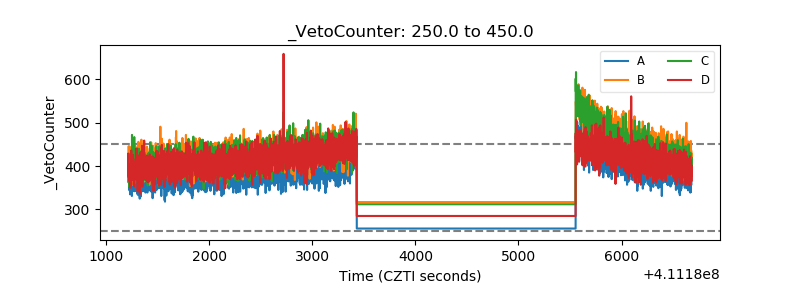 |