| Param | Original file | Final file |
|---|---|---|
| Filename | modeM0/AS1A12_077T06_9000005474_39420cztM0_level2.fits | modeM0/AS1A12_077T06_9000005474_39420cztM0_level2_quad_clean.evt |
| Size (bytes) | 570,726,720 | 67,374,720 |
| Size | 544.3 MB | 64.3 MB |
| Events in quadrant A | 4,059,148 | 547,137 |
| Events in quadrant B | 2,236,775 | 572,570 |
| Events in quadrant C | 4,112,071 | 493,521 |
| Events in quadrant D | 10,339,927 | 85,426 |
| Mode M0 | |||
|---|---|---|---|
| Quadrant | BADHDUFLAG | Total packets | Discarded packets |
| A | 0 | 15430 | 2 |
| B | 0 | 9993 | 1 |
| C | 0 | 15447 | 1 |
| D | 0 | 34025 | 1 |
| Mode SS | |||
|---|---|---|---|
| Quadrant | BADHDUFLAG | Total packets | Discarded packets |
| A | 0 | 100 | 0 |
| B | 0 | 100 | 0 |
| C | 0 | 100 | 0 |
| D | 0 | 100 | 0 |
| Mode M9 | |||
|---|---|---|---|
| Quadrant | BADHDUFLAG | Total packets | Discarded packets |
| A | 0 | 20 | 0 |
| B | 0 | 20 | 0 |
| C | 0 | 20 | 0 |
| D | 0 | 20 | 0 |
| Quadrant | Total seconds | Saturated seconds | Saturation percentage |
|---|---|---|---|
| A | 4861 | 144 | 2.962353% |
| B | 4861 | 15 | 0.308578% |
| C | 4861 | 477 | 9.812796% |
| D | 4861 | 4170 | 85.784818% |
Noise dominated data is calculated using 1-second bins in cleaned event files. If a bin has >2000 counts, and if more than 50% of those come from <1% of pixels, then it is considered to be noise-dominated and hence unusable.
| Quadrant | # 1 sec bins | Bins with >0 counts | Bins with >2000 counts | High rate bins dominated by noise | Noise dominated (total time) | Noise dominated (detector-on time) | Marked lightcurve |
|---|---|---|---|---|---|---|---|
| A | 6894 | 4862 | 103 | 103 | 1.49% | 2.12% | 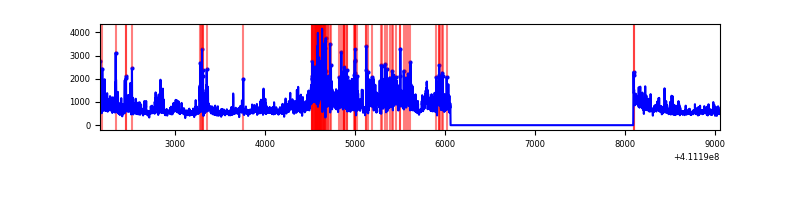 |
| B | 6894 | 4862 | 4 | 4 | 0.06% | 0.08% | 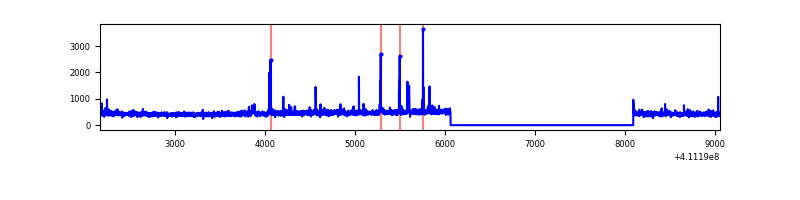 |
| C | 6894 | 4861 | 401 | 401 | 5.82% | 8.25% | 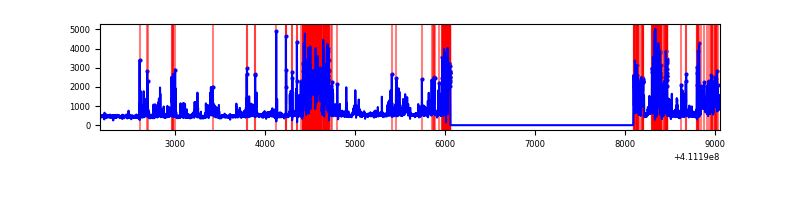 |
| D | 6894 | 4861 | 2877 | 2877 | 41.73% | 59.19% | 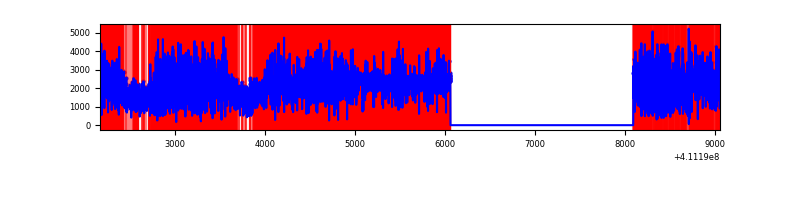 |
Top three noisy pixels from each quadrant. If the there are fewer than three noisy pixels in the level2.evt file, extra rows are filled as -1
| Pixel properties | Quadrant properties | ||||||
|---|---|---|---|---|---|---|---|
| Quadrant | DetID | PixID | Counts | Sigma | Mean | Median | Sigma |
| A | 15 | 222 | 1555186 | 14169.92 | 540 | 529 | 109.7 |
| A | 10 | 83 | 355513 | 3235.5 | 540 | 529 | 109.7 |
| A | 13 | 248 | 28947 | 259.02 | 540 | 529 | 109.7 |
| B | 4 | 170 | 68465 | 644.68 | 541 | 526 | 105.4 |
| B | 5 | 172 | 17755 | 163.49 | 541 | 526 | 105.4 |
| B | 5 | 255 | 13551 | 123.59 | 541 | 526 | 105.4 |
| C | 15 | 208 | 1779638 | 15229.35 | 503 | 506 | 116.8 |
| C | 15 | 214 | 193979 | 1656.13 | 503 | 506 | 116.8 |
| C | 9 | 187 | 160644 | 1370.78 | 503 | 506 | 116.8 |
| D | 12 | 0 | 4698122 | 86635.6 | 212 | 205 | 54.2 |
| D | 12 | 235 | 4444838 | 81964.72 | 212 | 205 | 54.2 |
| D | 12 | 227 | 281241 | 5182.66 | 212 | 205 | 54.2 |
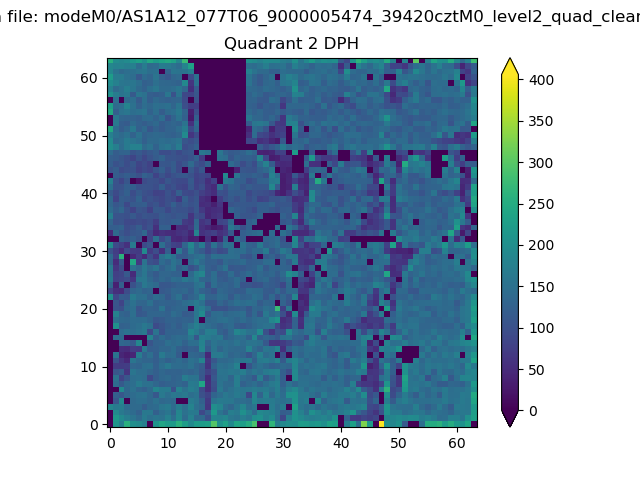
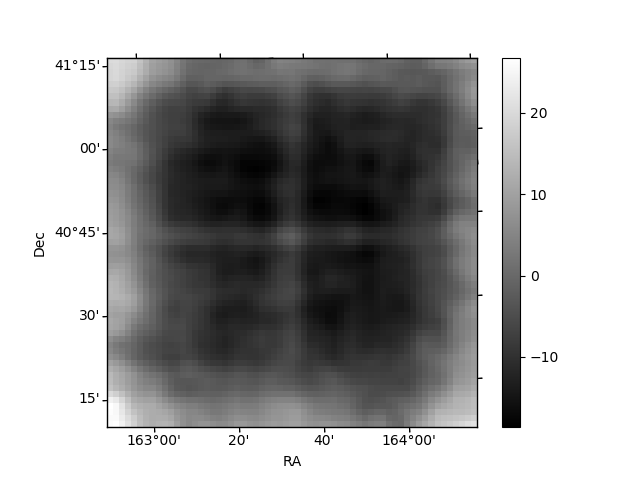
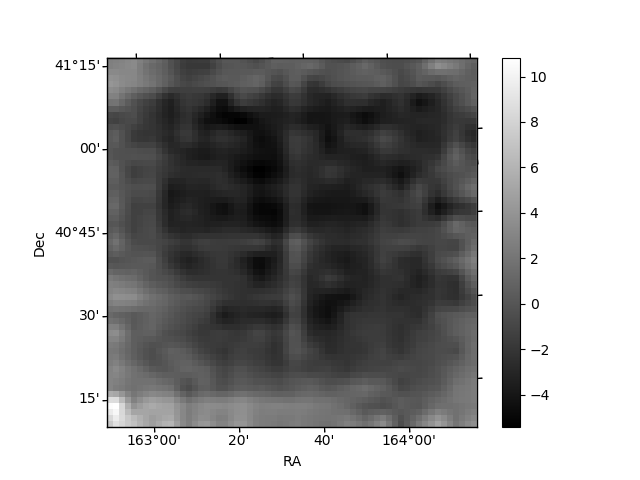
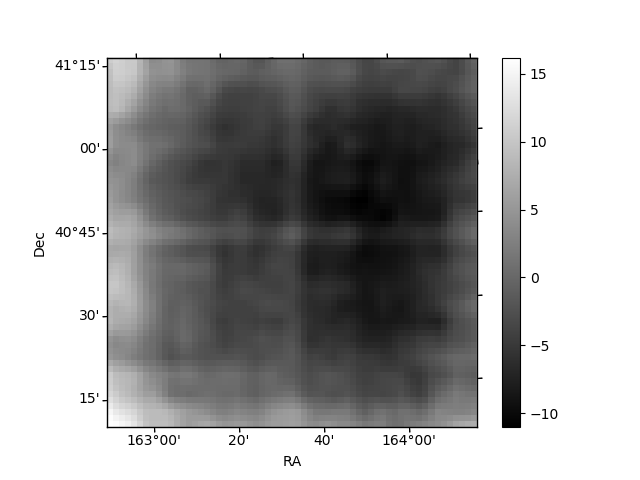
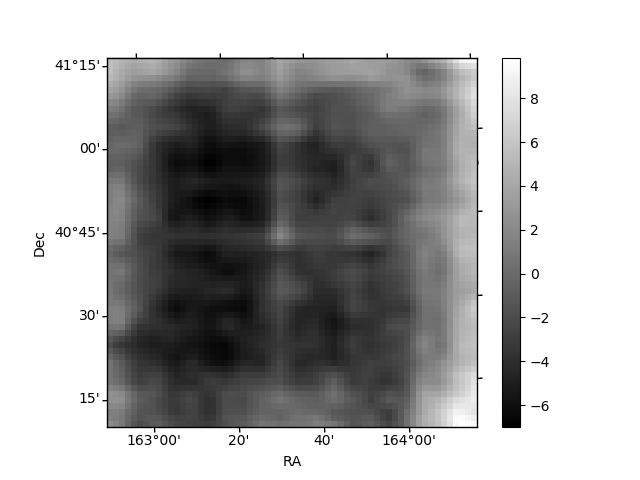
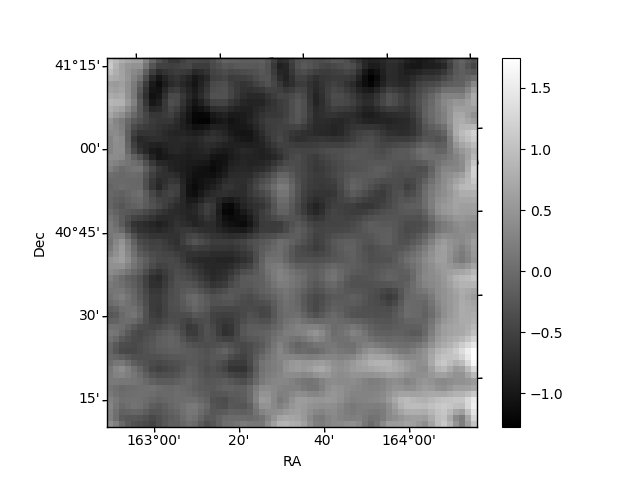
Histogram calculated using DETX and DETY for each event in the final _common_clean file
| Quadrant A | 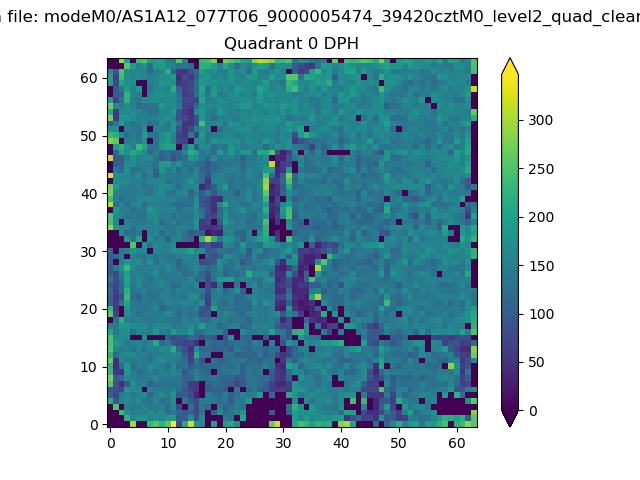 |
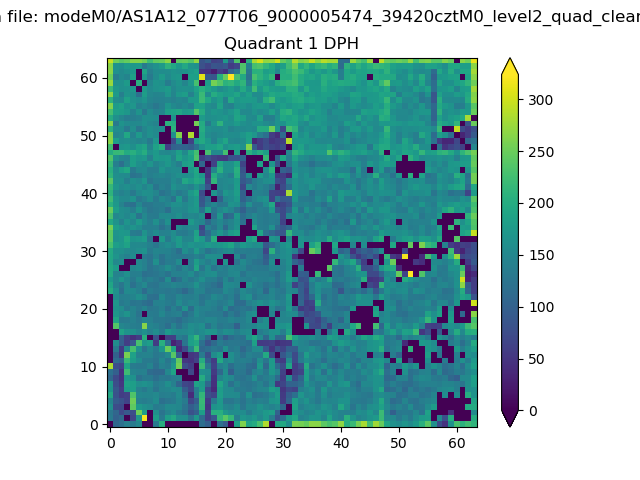 |
Quadrant B |
|---|---|---|---|
| Quadrant D | 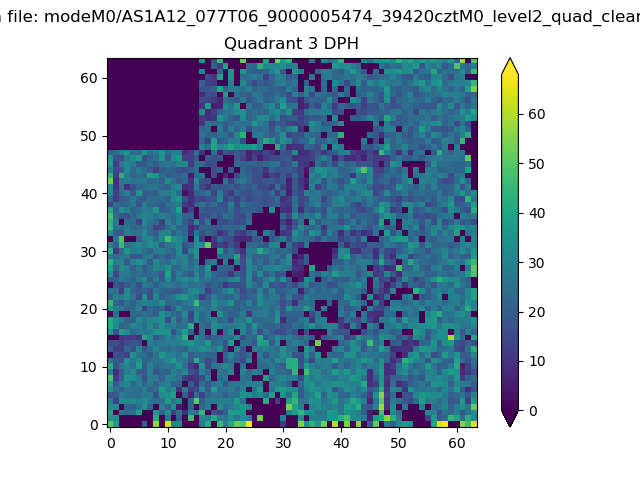 |
 |
Quadrant C |
| Plot type | Count rate plots | Images |
|---|---|---|
| Comparison with Poisson distribution Blue bars denote a histogram of data divided into 1 sec bins. Red curve is a Poisson curve with rate = median count rate of data. |
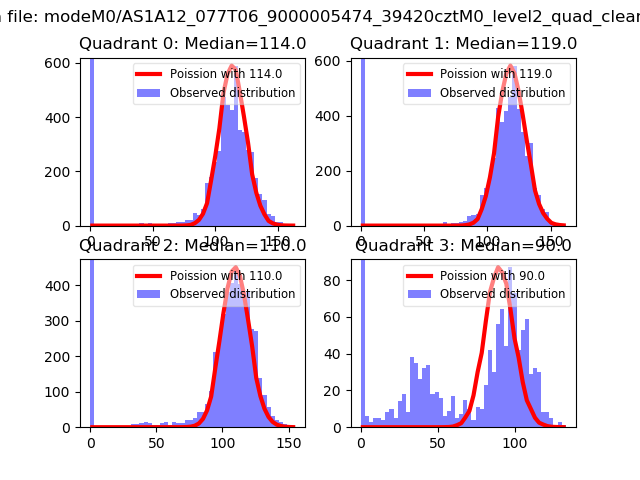 |
 |
| Quadrant-wise count rates Data is divided into 100 sec bins |
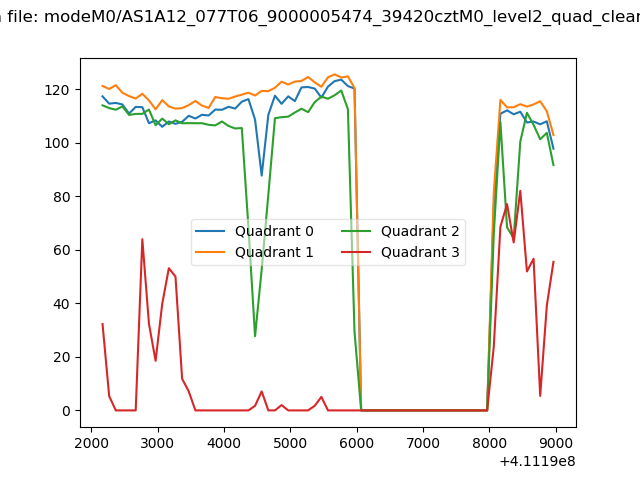 |
|
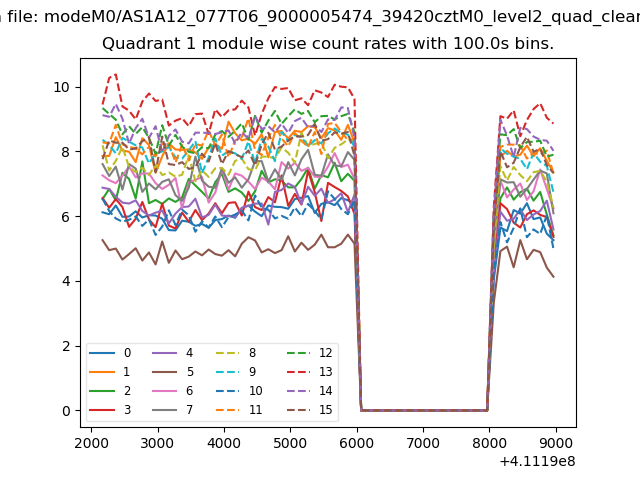
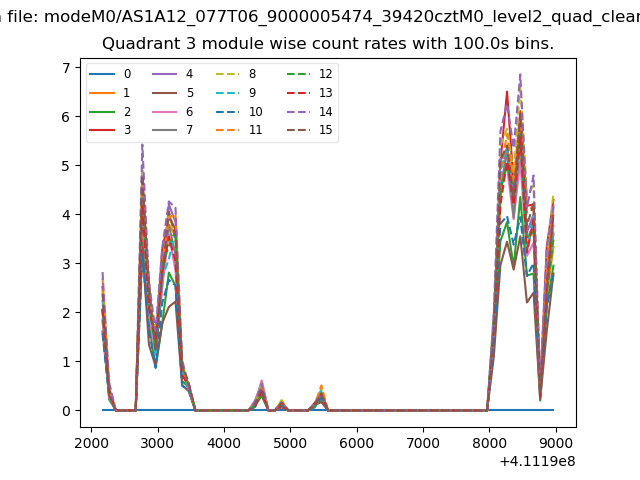
| Module-wise count rates for Quadrant A Data is divided into 100 sec bins |
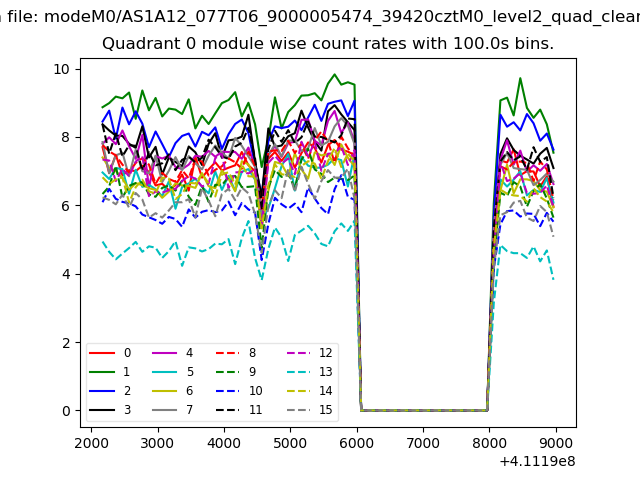 |
 |
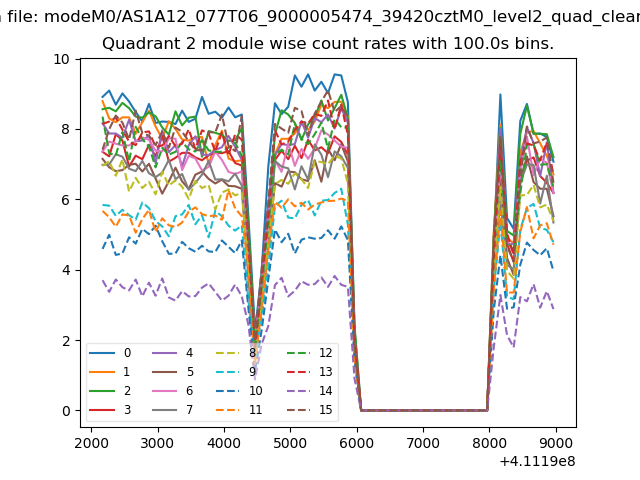
| Module-wise count rates for Quadrant B Data is divided into 100 sec bins |
 |
 |
| Module-wise count rates for Quadrant C Data is divided into 100 sec bins |
 |
 |
| Module-wise count rates for Quadrant D Data is divided into 100 sec bins |
 |
 |
| Parameter | Plot |
|---|---|
| CZT HV Monitor | 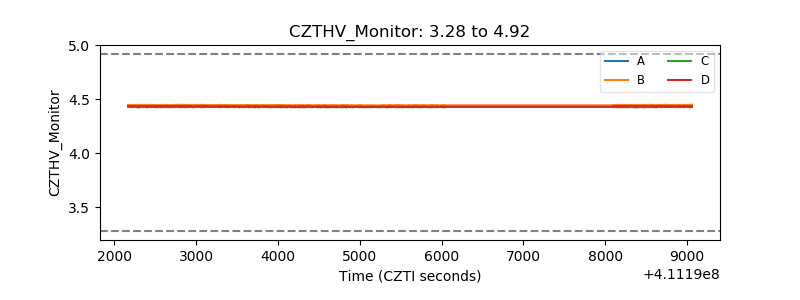 |
| D_VDD | 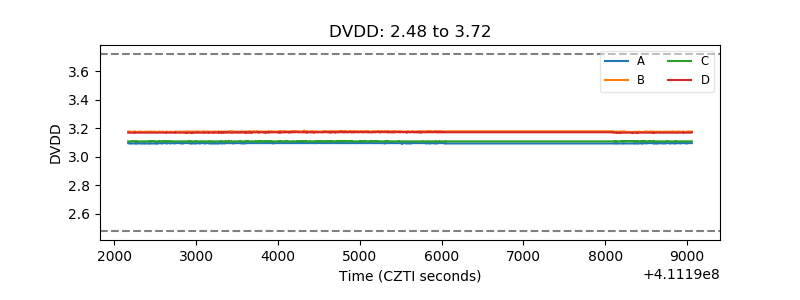 |
| Temperature 1 | 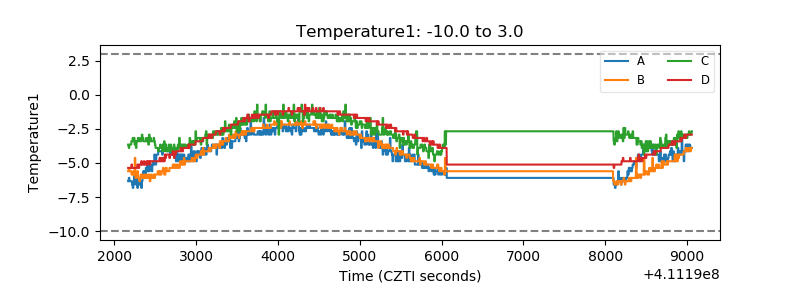 |
| Veto HV Monitor | 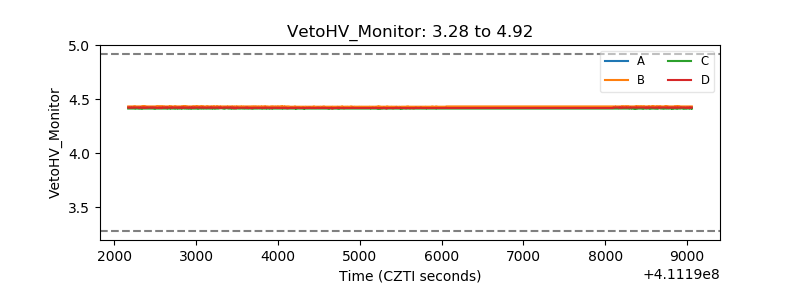 |
| Veto LLD | 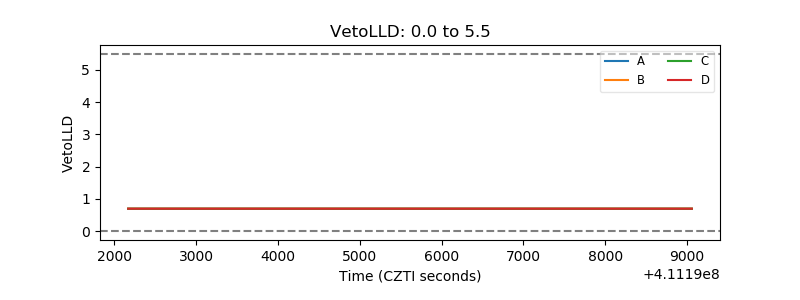 |
| Alpha Counter | 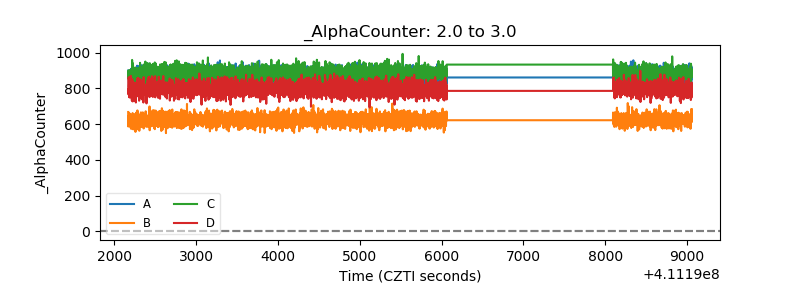 |
| _CPM_Rate | 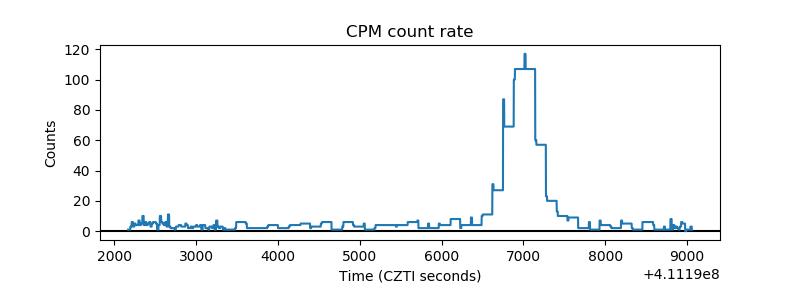 |
| CZT Counter | 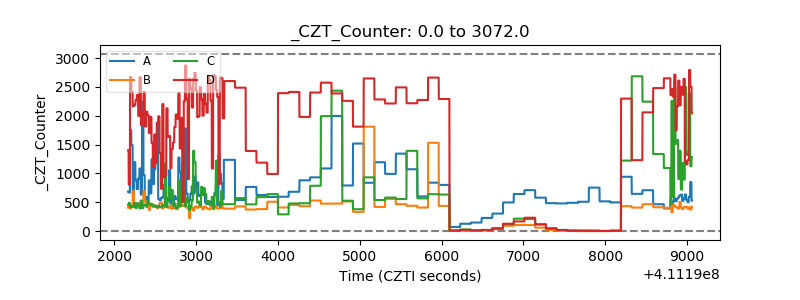 |
| +2.5 Volts monitor | 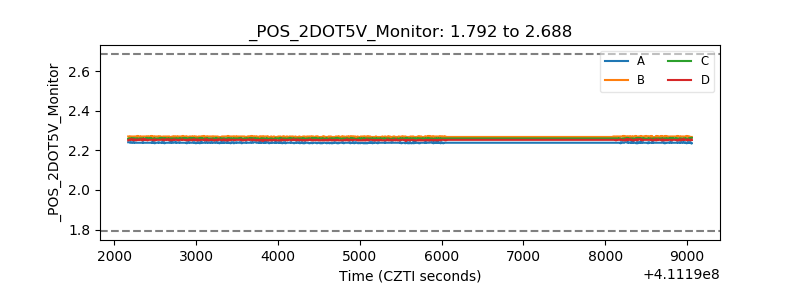 |
| +5 Volts monitor | 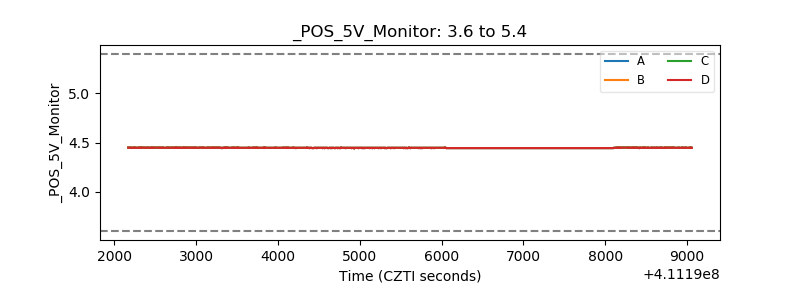 |
| _ROLL_ROT | 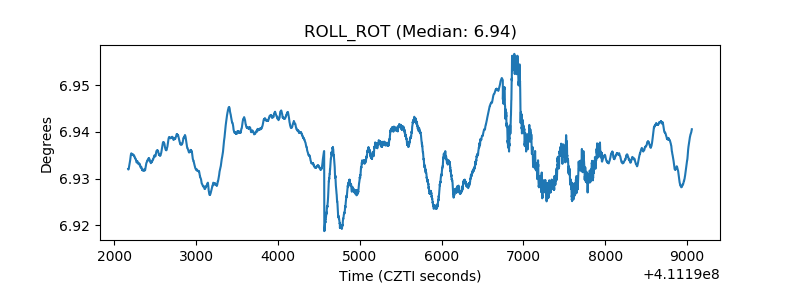 |
| _Roll_DEC | 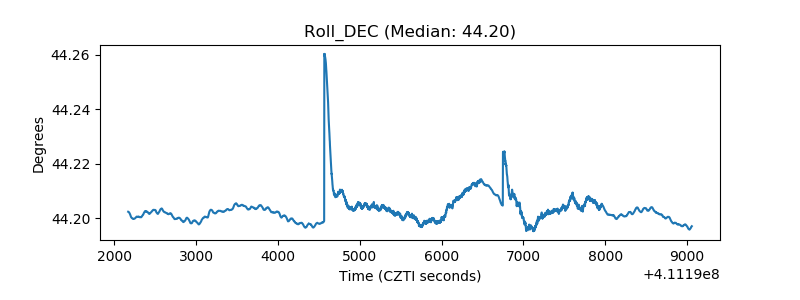 |
| _Roll_RA | 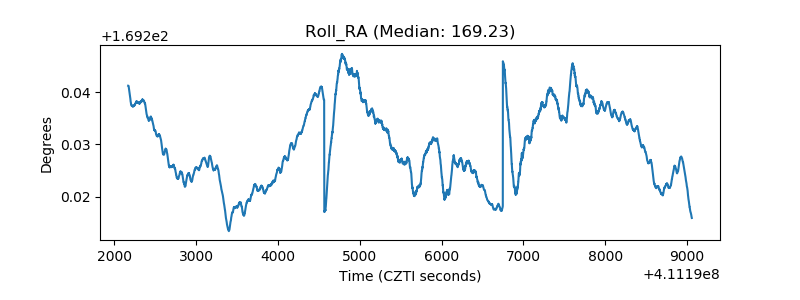 |
| Veto Counter | 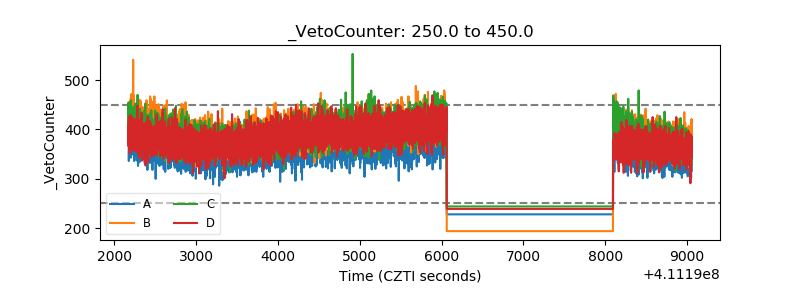 |