| Param | Original file | Final file |
|---|---|---|
| Filename | modeM0/AS1A12_077T06_9000005474_39421cztM0_level2.fits | modeM0/AS1A12_077T06_9000005474_39421cztM0_level2_quad_clean.evt |
| Size (bytes) | 647,530,560 | 73,984,320 |
| Size | 617.5 MB | 70.6 MB |
| Events in quadrant A | 4,413,311 | 583,086 |
| Events in quadrant B | 2,620,367 | 603,617 |
| Events in quadrant C | 4,251,302 | 549,567 |
| Events in quadrant D | 12,272,145 | 131,205 |
| Mode M0 | |||
|---|---|---|---|
| Quadrant | BADHDUFLAG | Total packets | Discarded packets |
| A | 0 | 16902 | 3 |
| B | 0 | 11435 | 2 |
| C | 0 | 15994 | 2 |
| D | 0 | 40105 | 2 |
| Mode SS | |||
|---|---|---|---|
| Quadrant | BADHDUFLAG | Total packets | Discarded packets |
| A | 0 | 110 | 0 |
| B | 0 | 110 | 0 |
| C | 0 | 110 | 0 |
| D | 0 | 110 | 0 |
| Mode M9 | |||
|---|---|---|---|
| Quadrant | BADHDUFLAG | Total packets | Discarded packets |
| A | 0 | 23 | 0 |
| B | 0 | 23 | 0 |
| C | 0 | 23 | 0 |
| D | 0 | 24 | 0 |
| Quadrant | Total seconds | Saturated seconds | Saturation percentage |
|---|---|---|---|
| A | 5311 | 151 | 2.843156% |
| B | 5311 | 62 | 1.167388% |
| C | 5311 | 338 | 6.364150% |
| D | 5311 | 4232 | 79.683675% |
Noise dominated data is calculated using 1-second bins in cleaned event files. If a bin has >2000 counts, and if more than 50% of those come from <1% of pixels, then it is considered to be noise-dominated and hence unusable.
| Quadrant | # 1 sec bins | Bins with >0 counts | Bins with >2000 counts | High rate bins dominated by noise | Noise dominated (total time) | Noise dominated (detector-on time) | Marked lightcurve |
|---|---|---|---|---|---|---|---|
| A | 7044 | 5312 | 87 | 87 | 1.24% | 1.64% | 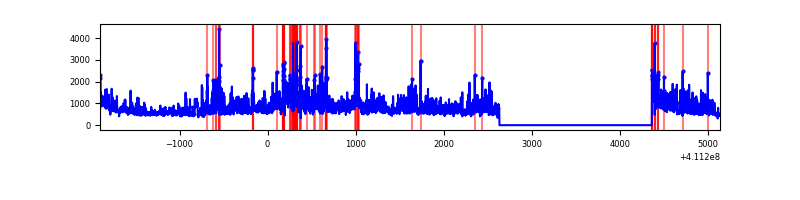 |
| B | 7044 | 5312 | 45 | 45 | 0.64% | 0.85% | 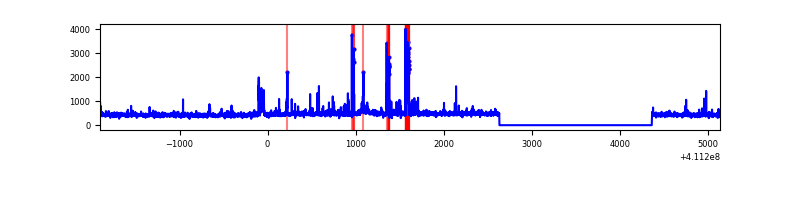 |
| C | 7044 | 5312 | 325 | 325 | 4.61% | 6.12% | 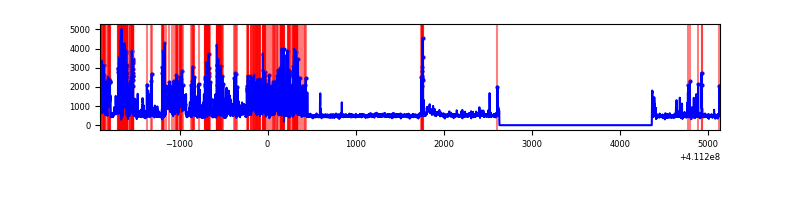 |
| D | 7044 | 5312 | 3530 | 3530 | 50.11% | 66.45% | 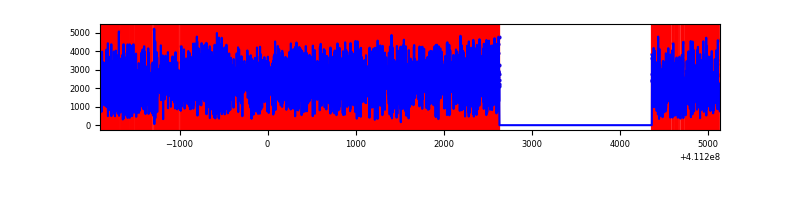 |
Top three noisy pixels from each quadrant. If the there are fewer than three noisy pixels in the level2.evt file, extra rows are filled as -1
| Pixel properties | Quadrant properties | ||||||
|---|---|---|---|---|---|---|---|
| Quadrant | DetID | PixID | Counts | Sigma | Mean | Median | Sigma |
| A | 15 | 222 | 1535294 | 12918.84 | 588 | 575 | 118.8 |
| A | 10 | 83 | 453629 | 3813.68 | 588 | 575 | 118.8 |
| A | 13 | 248 | 103263 | 864.4 | 588 | 575 | 118.8 |
| B | 4 | 170 | 164736 | 1441.46 | 584 | 568 | 113.9 |
| B | 5 | 172 | 61422 | 534.32 | 584 | 568 | 113.9 |
| B | 5 | 255 | 46975 | 407.47 | 584 | 568 | 113.9 |
| C | 15 | 208 | 1694462 | 12952.3 | 560 | 563 | 130.8 |
| C | 15 | 214 | 218589 | 1667.12 | 560 | 563 | 130.8 |
| C | 9 | 187 | 118683 | 903.2 | 560 | 563 | 130.8 |
| D | 12 | 235 | 8935923 | 117349.56 | 307 | 298 | 76.1 |
| D | 12 | 0 | 1738194 | 22823.4 | 307 | 298 | 76.1 |
| D | 13 | 249 | 261159 | 3425.83 | 307 | 298 | 76.1 |
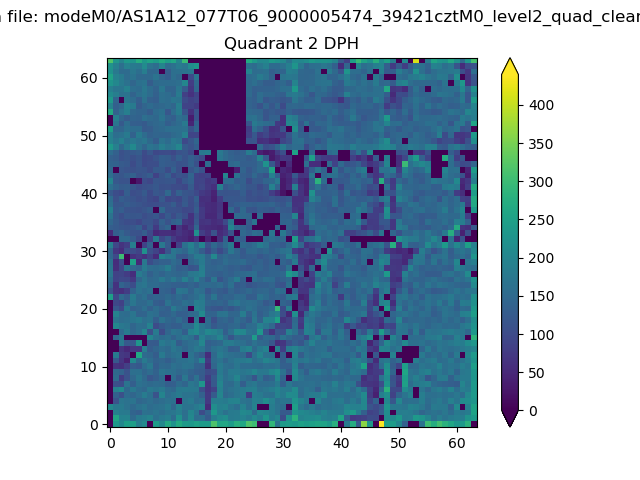
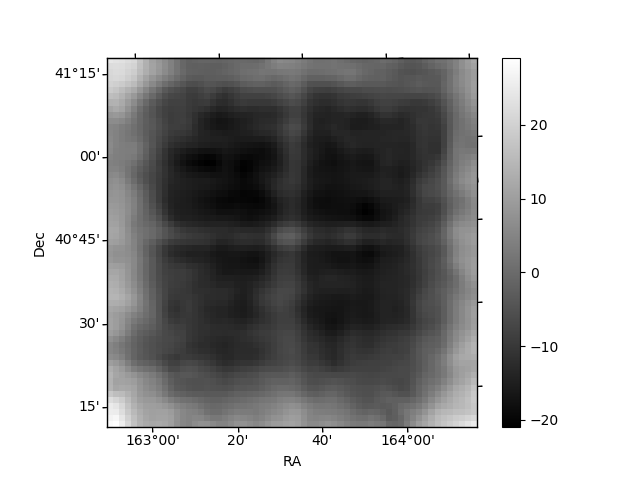
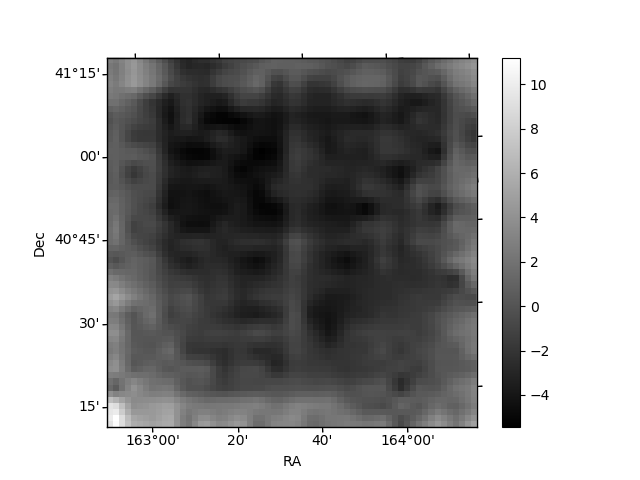
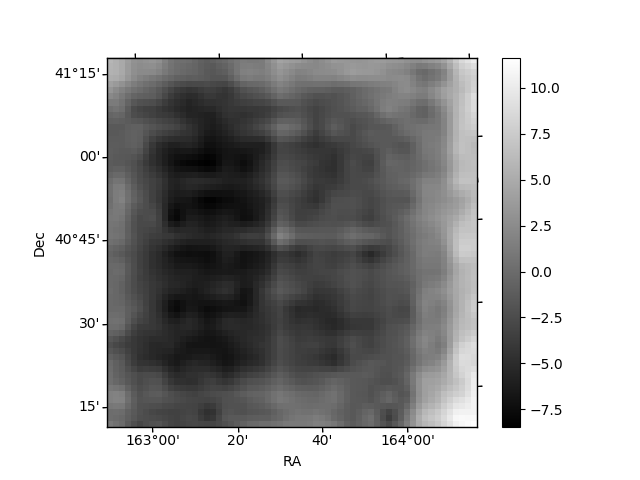
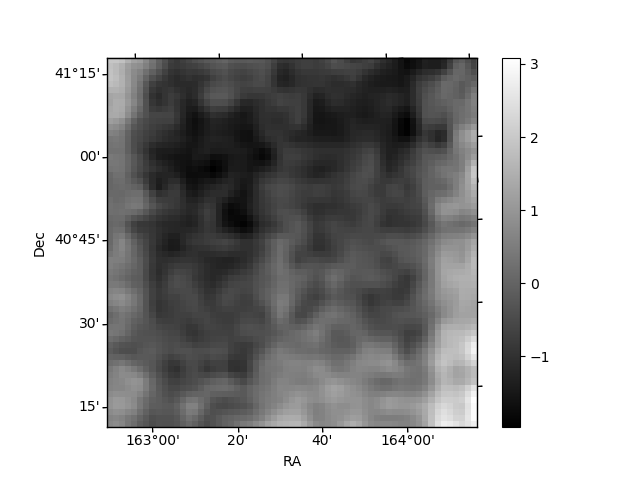
Histogram calculated using DETX and DETY for each event in the final _common_clean file
| Quadrant A | 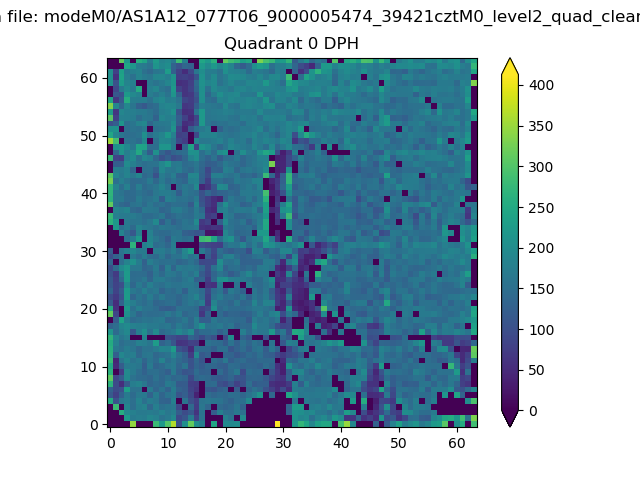 |
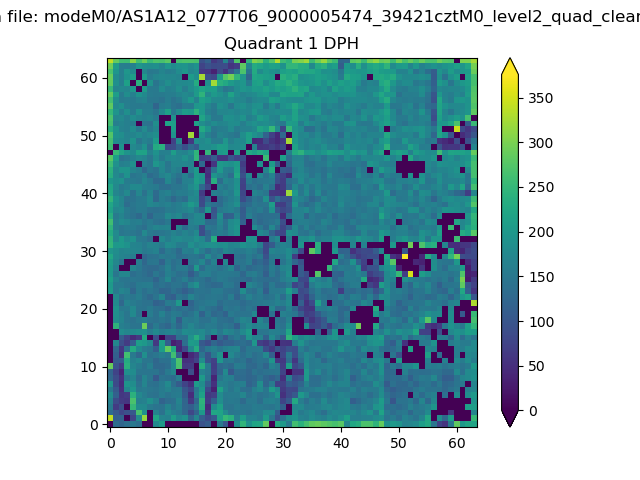 |
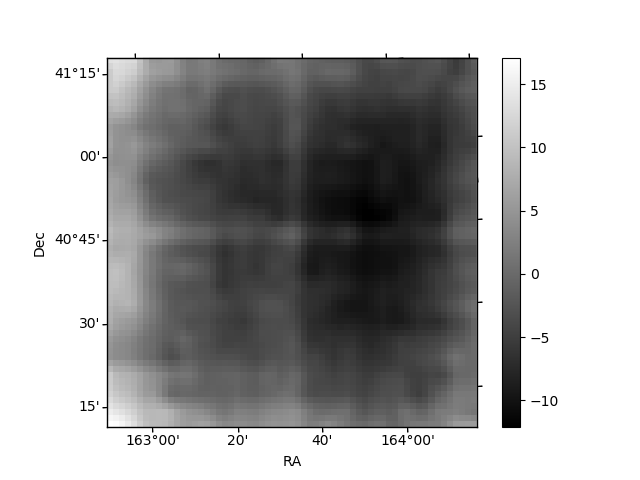
Quadrant B |
|---|---|---|---|
| Quadrant D | 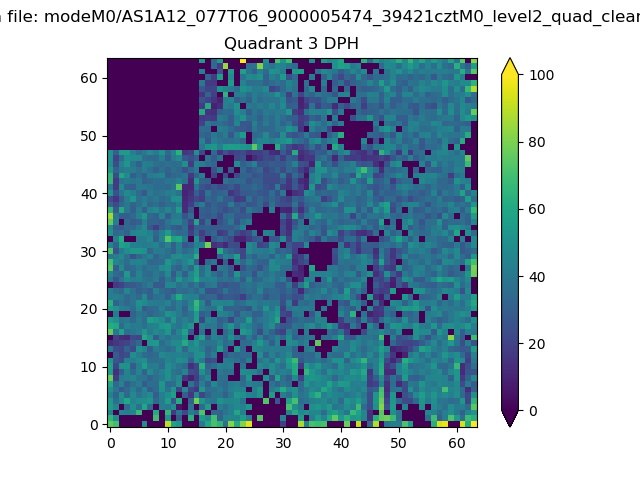 |
 |
Quadrant C |
| Plot type | Count rate plots | Images |
|---|---|---|
| Comparison with Poisson distribution Blue bars denote a histogram of data divided into 1 sec bins. Red curve is a Poisson curve with rate = median count rate of data. |
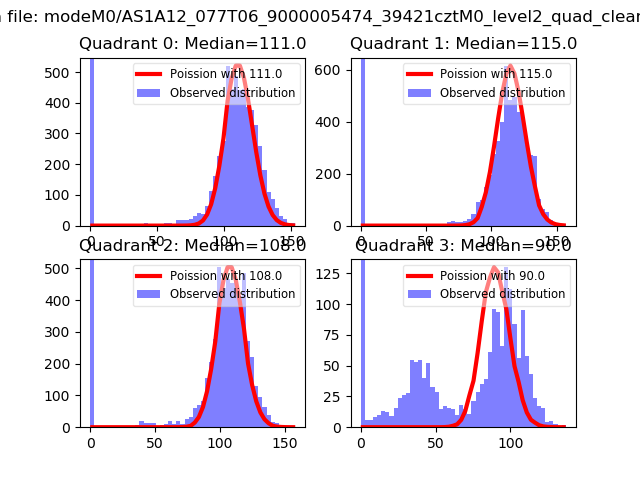 |
 |
| Quadrant-wise count rates Data is divided into 100 sec bins |
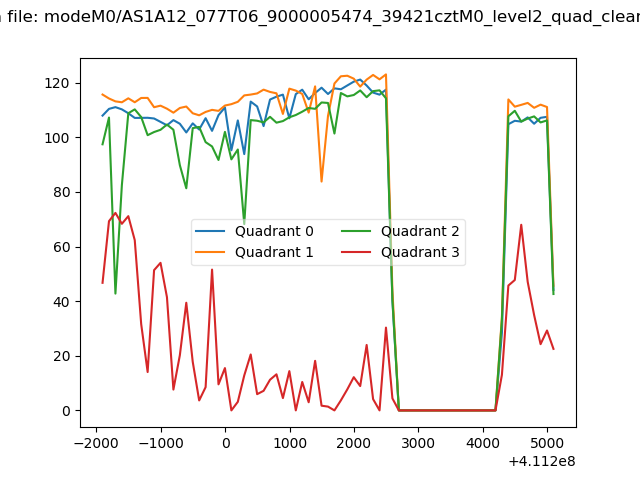 |
|
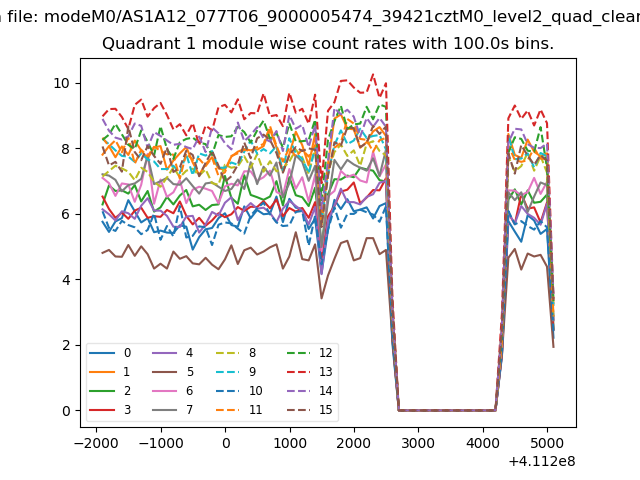
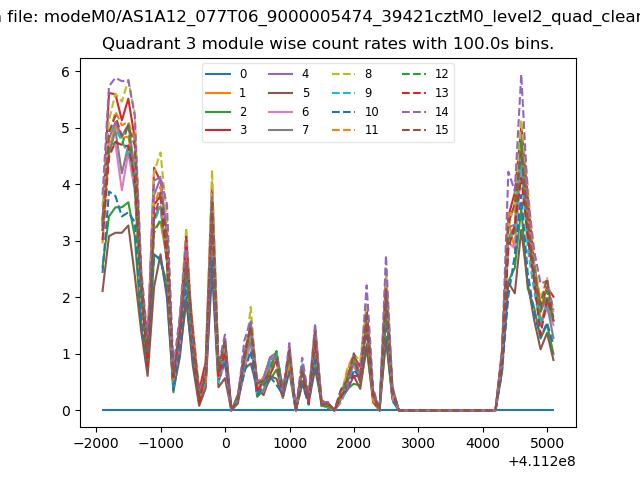
| Module-wise count rates for Quadrant A Data is divided into 100 sec bins |
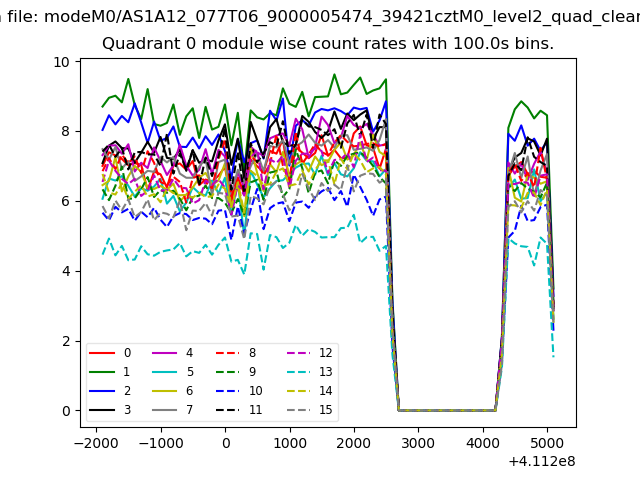 |
 |
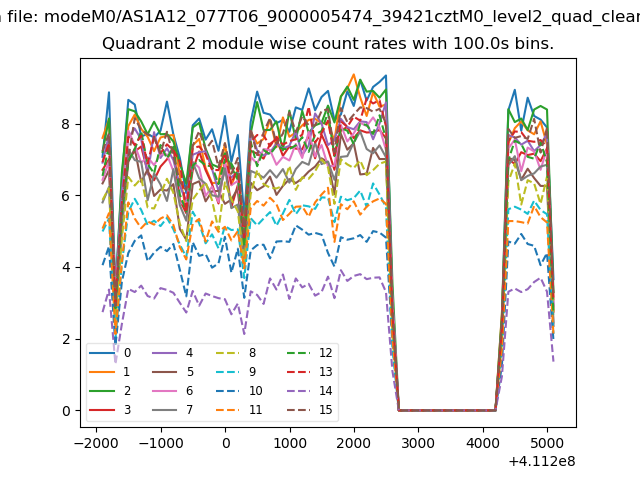
| Module-wise count rates for Quadrant B Data is divided into 100 sec bins |
 |
 |
| Module-wise count rates for Quadrant C Data is divided into 100 sec bins |
 |
 |
| Module-wise count rates for Quadrant D Data is divided into 100 sec bins |
 |
 |
| Parameter | Plot |
|---|---|
| CZT HV Monitor | 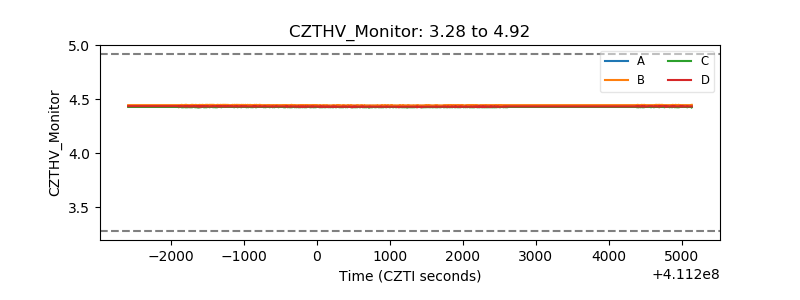 |
| D_VDD | 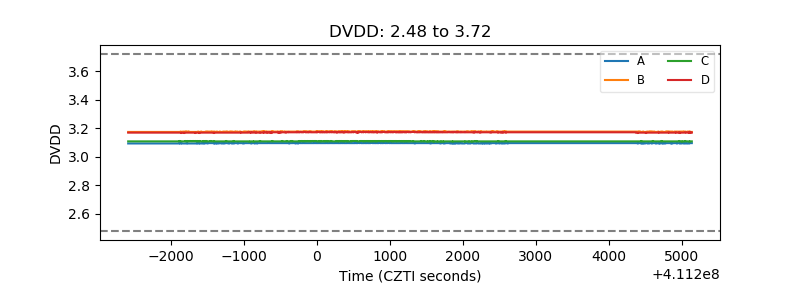 |
| Temperature 1 | 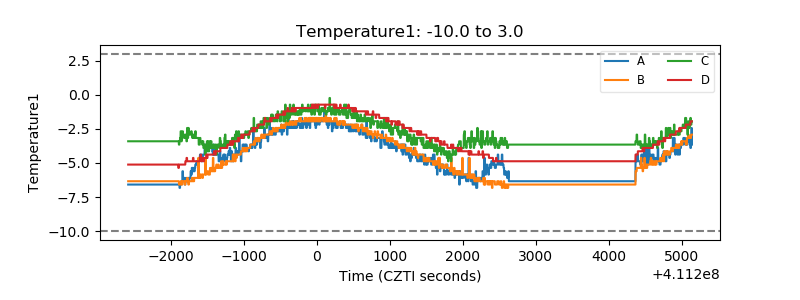 |
| Veto HV Monitor | 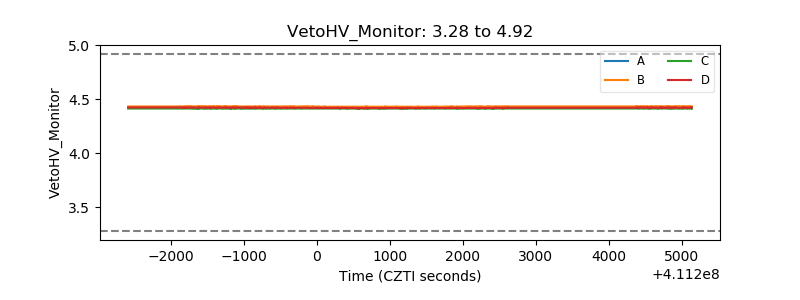 |
| Veto LLD | 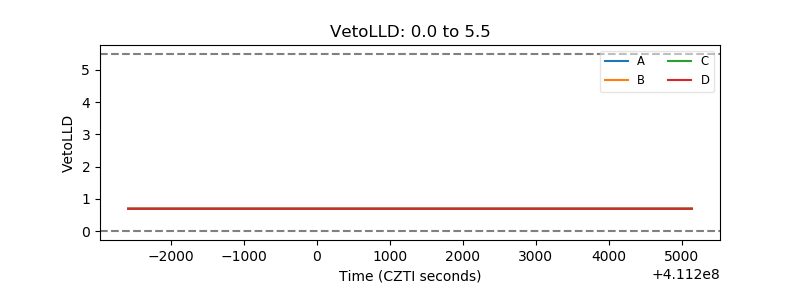 |
| Alpha Counter | 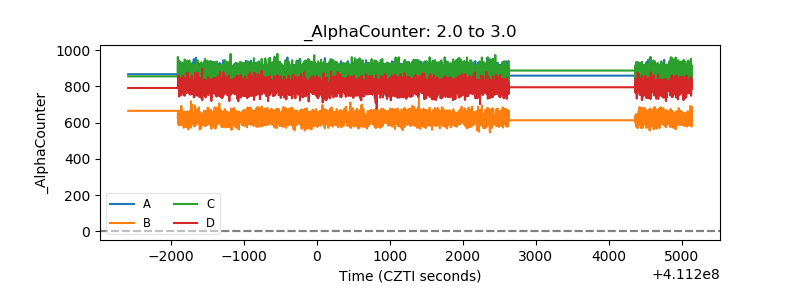 |
| _CPM_Rate |  |
| CZT Counter | 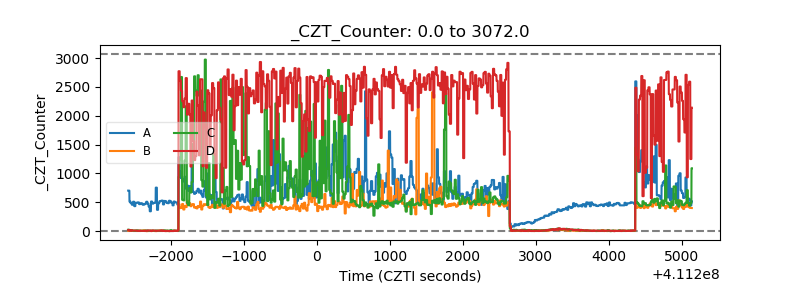 |
| +2.5 Volts monitor |  |
| +5 Volts monitor | 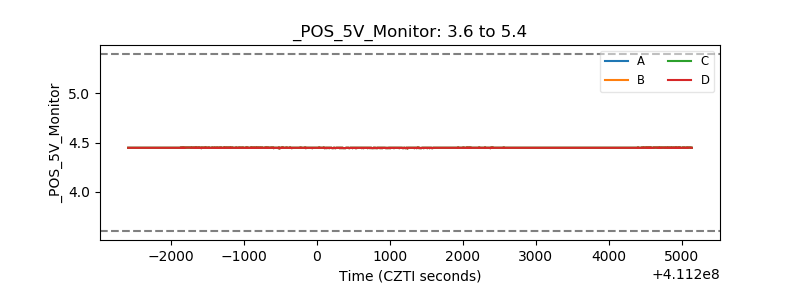 |
| _ROLL_ROT | 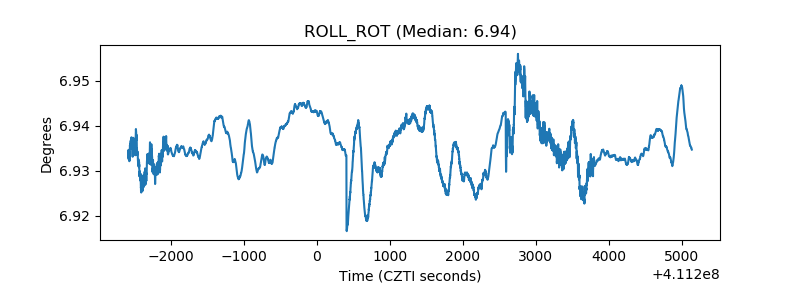 |
| _Roll_DEC | 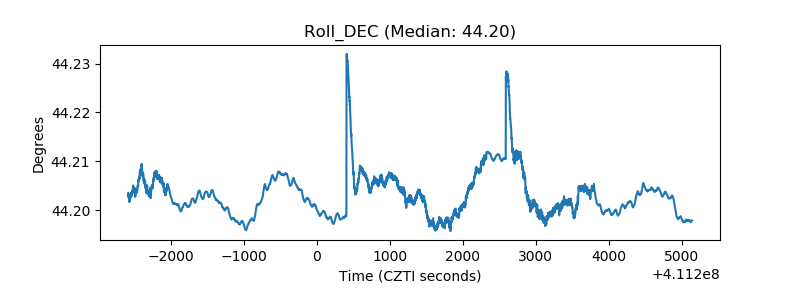 |
| _Roll_RA | 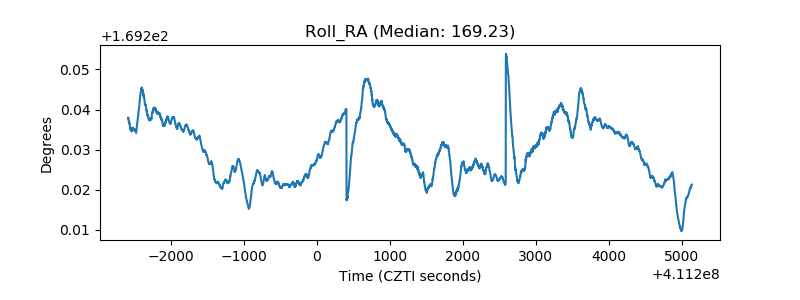 |
| Veto Counter | 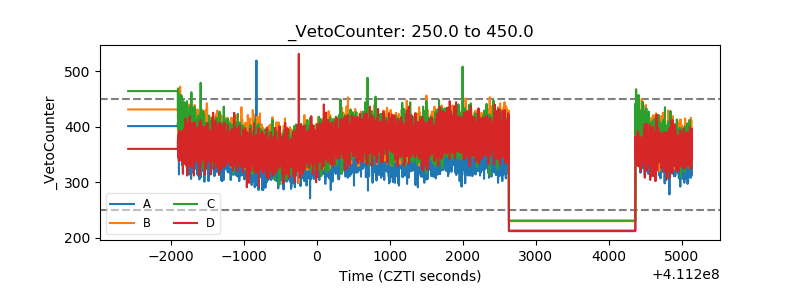 |