| Param | Original file | Final file |
|---|---|---|
| Filename | modeM0/AS1A12_077T06_9000005474_39422cztM0_level2.fits | modeM0/AS1A12_077T06_9000005474_39422cztM0_level2_quad_clean.evt |
| Size (bytes) | 679,567,680 | 78,462,720 |
| Size | 648.1 MB | 74.8 MB |
| Events in quadrant A | 5,078,510 | 607,348 |
| Events in quadrant B | 3,161,379 | 627,021 |
| Events in quadrant C | 3,914,362 | 577,947 |
| Events in quadrant D | 12,563,106 | 168,415 |
| Mode M0 | |||
|---|---|---|---|
| Quadrant | BADHDUFLAG | Total packets | Discarded packets |
| A | 0 | 18941 | 3 |
| B | 0 | 13224 | 2 |
| C | 0 | 15226 | 2 |
| D | 0 | 41194 | 2 |
| Mode SS | |||
|---|---|---|---|
| Quadrant | BADHDUFLAG | Total packets | Discarded packets |
| A | 0 | 114 | 0 |
| B | 0 | 114 | 0 |
| C | 0 | 114 | 0 |
| D | 0 | 114 | 0 |
| Mode M9 | |||
|---|---|---|---|
| Quadrant | BADHDUFLAG | Total packets | Discarded packets |
| A | 0 | 17 | 0 |
| B | 0 | 17 | 0 |
| C | 0 | 17 | 0 |
| D | 0 | 18 | 0 |
| Quadrant | Total seconds | Saturated seconds | Saturation percentage |
|---|---|---|---|
| A | 5643 | 270 | 4.784689% |
| B | 5643 | 177 | 3.136629% |
| C | 5643 | 307 | 5.440369% |
| D | 5643 | 4266 | 75.598086% |
Noise dominated data is calculated using 1-second bins in cleaned event files. If a bin has >2000 counts, and if more than 50% of those come from <1% of pixels, then it is considered to be noise-dominated and hence unusable.
| Quadrant | # 1 sec bins | Bins with >0 counts | Bins with >2000 counts | High rate bins dominated by noise | Noise dominated (total time) | Noise dominated (detector-on time) | Marked lightcurve |
|---|---|---|---|---|---|---|---|
| A | 7045 | 5644 | 194 | 194 | 2.75% | 3.44% | 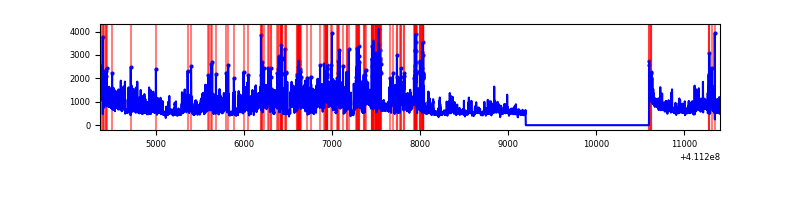 |
| B | 7045 | 5644 | 113 | 113 | 1.60% | 2.00% | 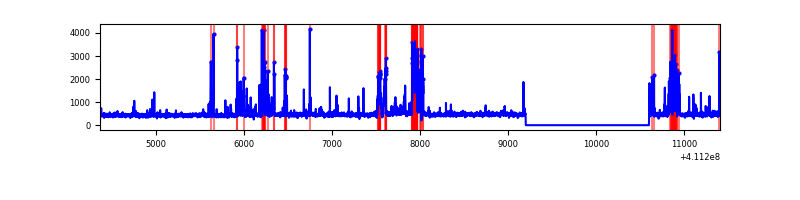 |
| C | 7045 | 5644 | 266 | 266 | 3.78% | 4.71% | 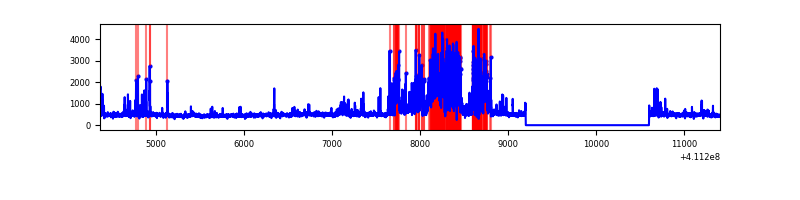 |
| D | 7045 | 5644 | 3442 | 3442 | 48.86% | 60.99% | 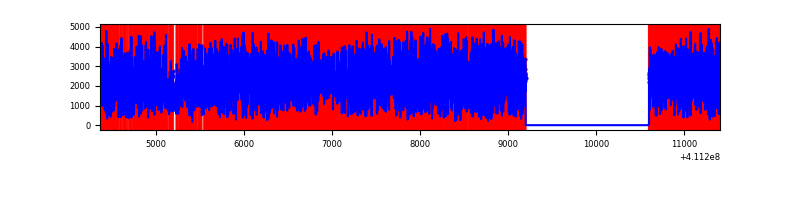 |
Top three noisy pixels from each quadrant. If the there are fewer than three noisy pixels in the level2.evt file, extra rows are filled as -1
| Pixel properties | Quadrant properties | ||||||
|---|---|---|---|---|---|---|---|
| Quadrant | DetID | PixID | Counts | Sigma | Mean | Median | Sigma |
| A | 15 | 222 | 2160605 | 17119.91 | 619 | 606 | 126.2 |
| A | 10 | 83 | 470329 | 3722.97 | 619 | 606 | 126.2 |
| A | 2 | 79 | 42950 | 335.61 | 619 | 606 | 126.2 |
| B | 5 | 172 | 404733 | 3356.13 | 618 | 601 | 120.4 |
| B | 5 | 255 | 165944 | 1373.1 | 618 | 601 | 120.4 |
| B | 4 | 170 | 143766 | 1188.92 | 618 | 601 | 120.4 |
| C | 15 | 208 | 1013548 | 7278.4 | 596 | 600 | 139.2 |
| C | 15 | 214 | 236680 | 1696.32 | 596 | 600 | 139.2 |
| C | 9 | 187 | 235798 | 1689.98 | 596 | 600 | 139.2 |
| D | 12 | 235 | 8588143 | 94296.39 | 362 | 351 | 91.1 |
| D | 12 | 0 | 1755585 | 19272.97 | 362 | 351 | 91.1 |
| D | 13 | 249 | 340672 | 3736.82 | 362 | 351 | 91.1 |
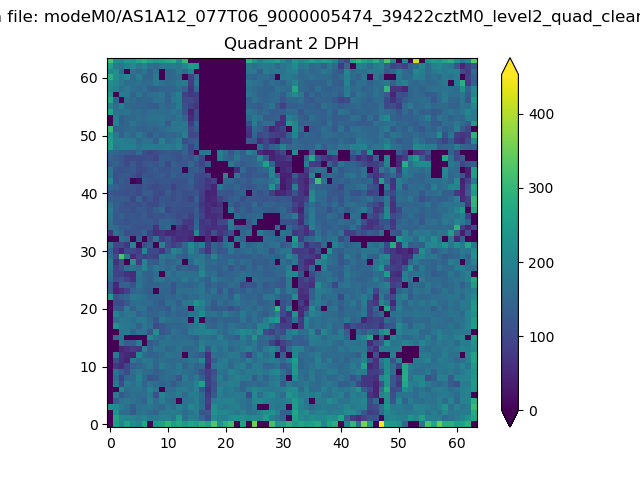
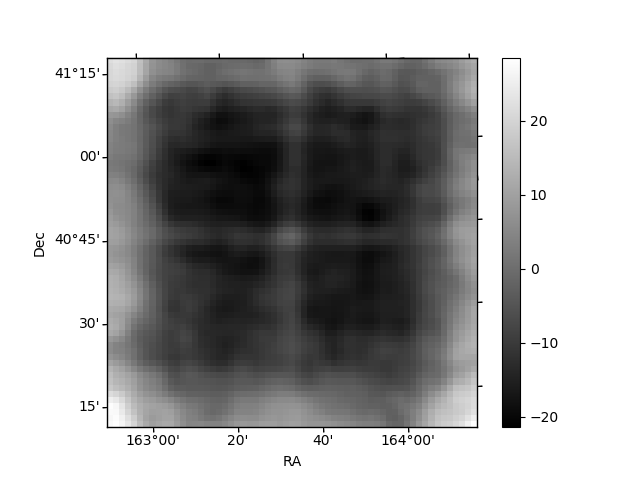
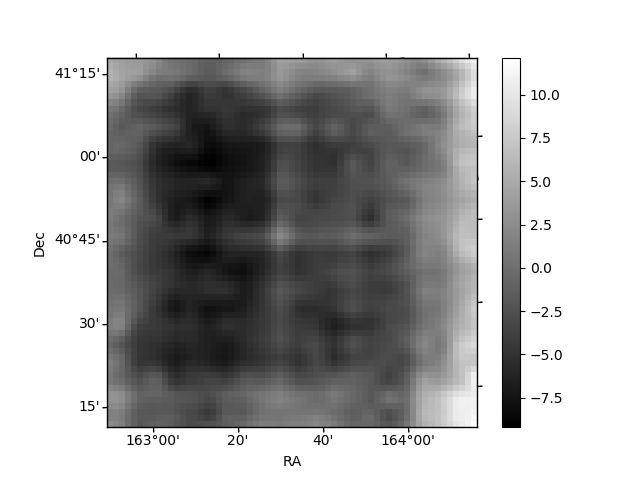
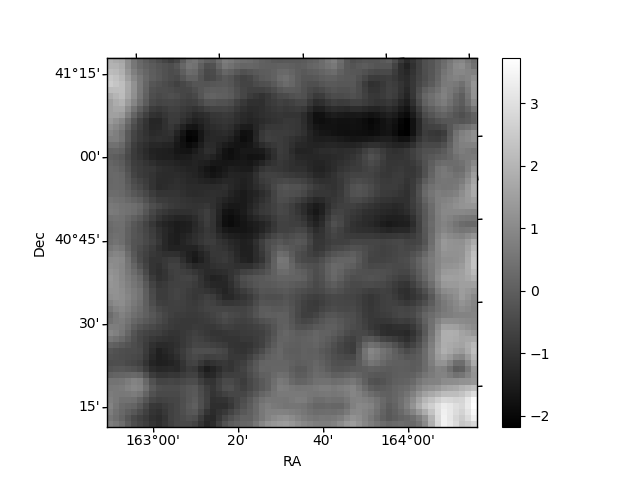
Histogram calculated using DETX and DETY for each event in the final _common_clean file
| Quadrant A | 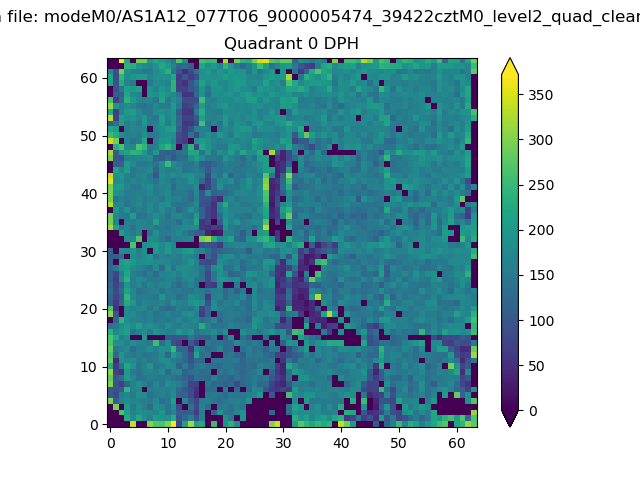 |
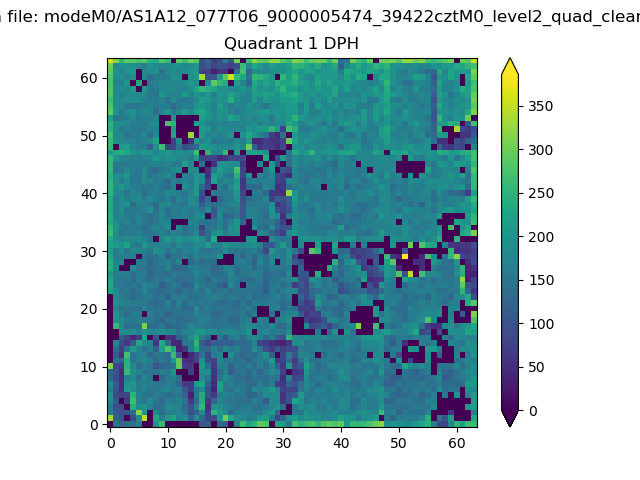 |
Quadrant B |
|---|---|---|---|
| Quadrant D | 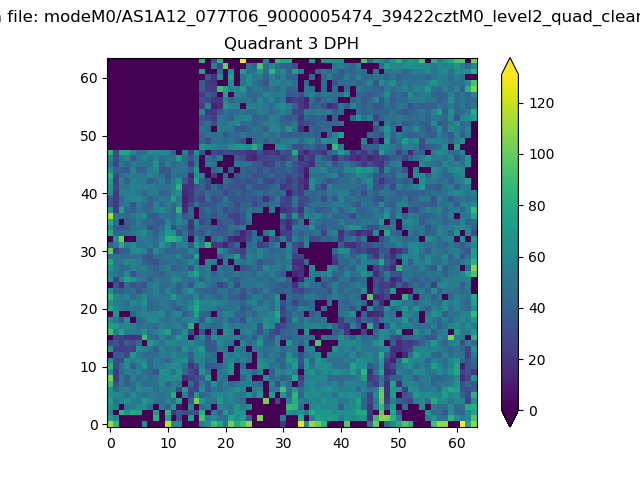 |
 |
Quadrant C |
| Plot type | Count rate plots | Images |
|---|---|---|
| Comparison with Poisson distribution Blue bars denote a histogram of data divided into 1 sec bins. Red curve is a Poisson curve with rate = median count rate of data. |
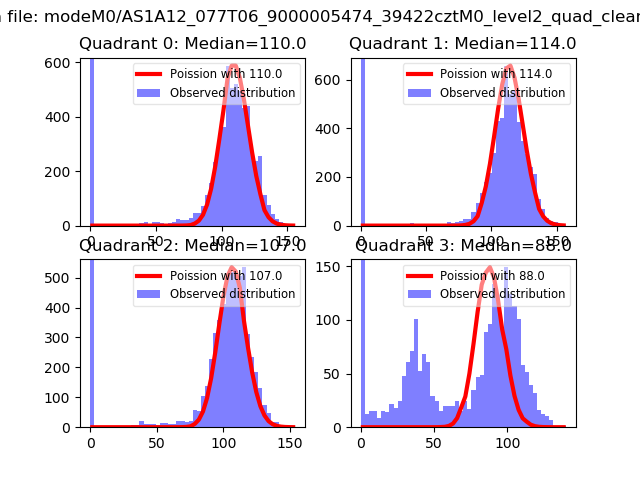 |
 |
| Quadrant-wise count rates Data is divided into 100 sec bins |
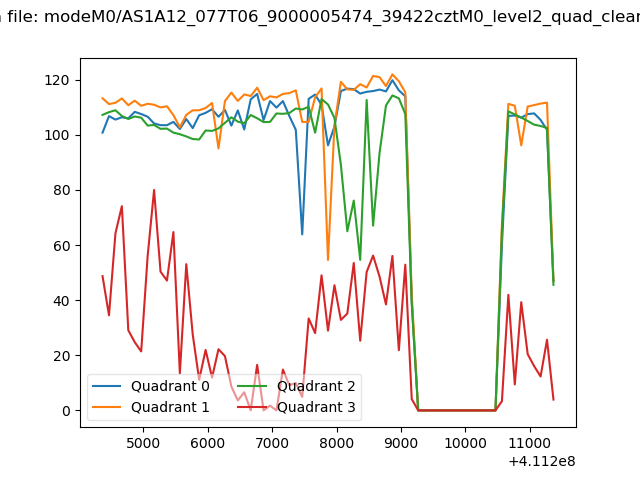 |
|
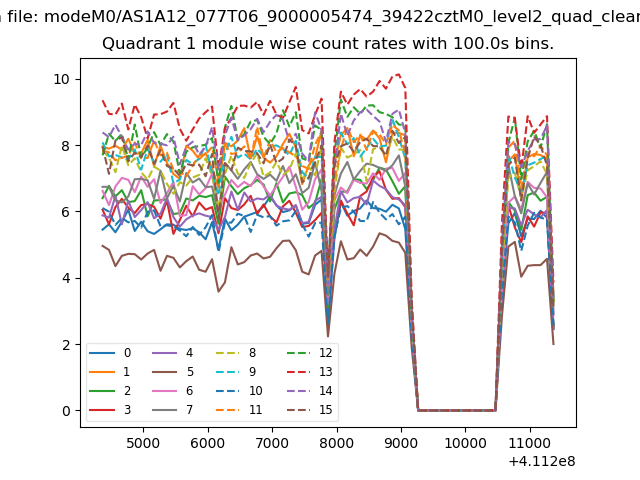
| Module-wise count rates for Quadrant A Data is divided into 100 sec bins |
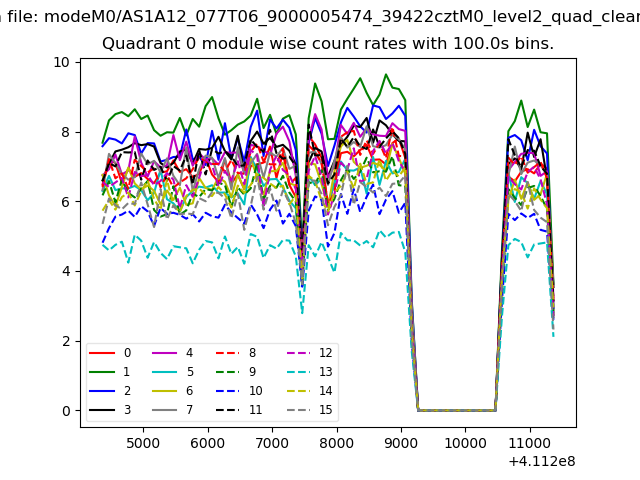 |
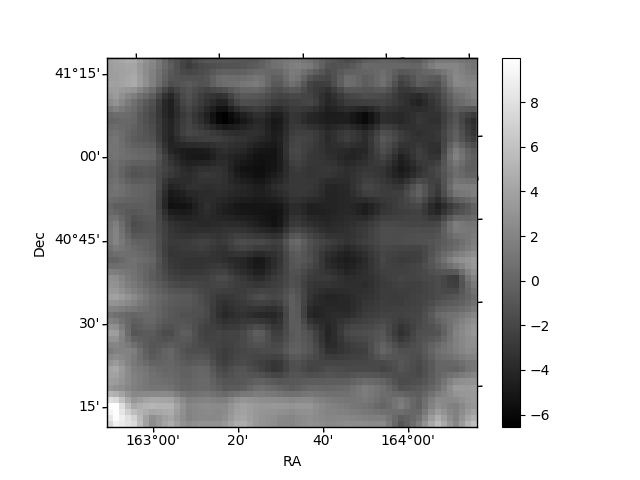 |
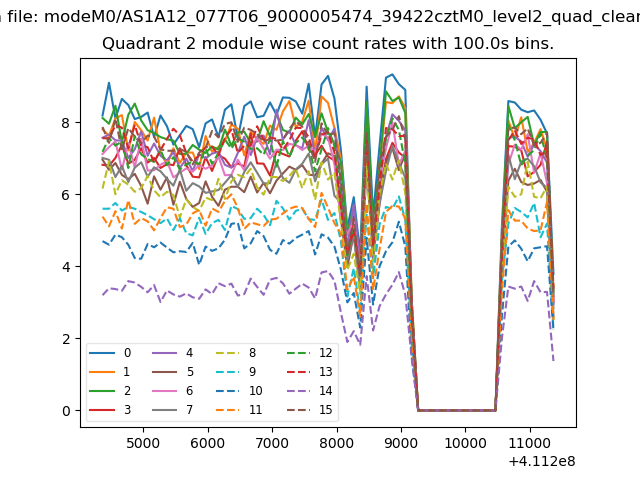
| Module-wise count rates for Quadrant B Data is divided into 100 sec bins |
 |
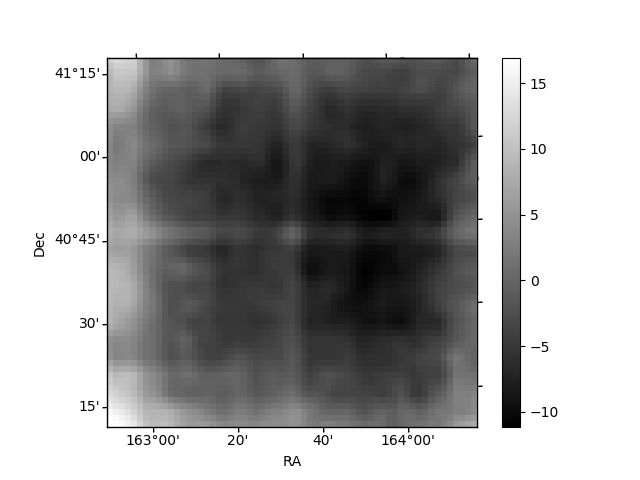 |
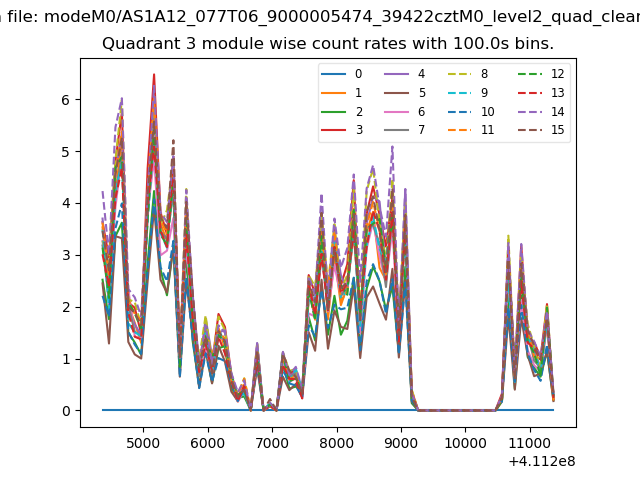
| Module-wise count rates for Quadrant C Data is divided into 100 sec bins |
 |
 |
| Module-wise count rates for Quadrant D Data is divided into 100 sec bins |
 |
 |
| Parameter | Plot |
|---|---|
| CZT HV Monitor | 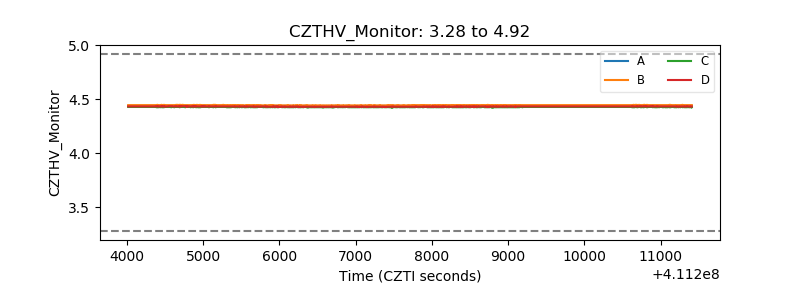 |
| D_VDD | 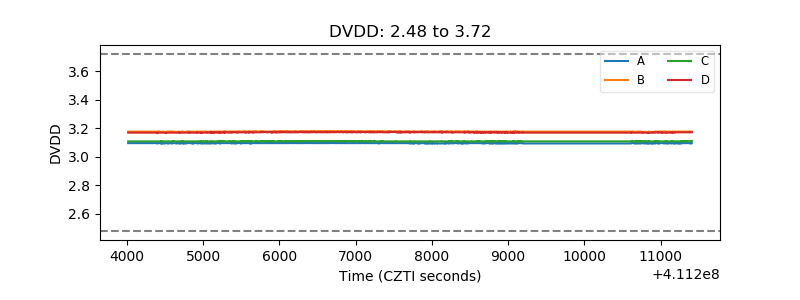 |
| Temperature 1 | 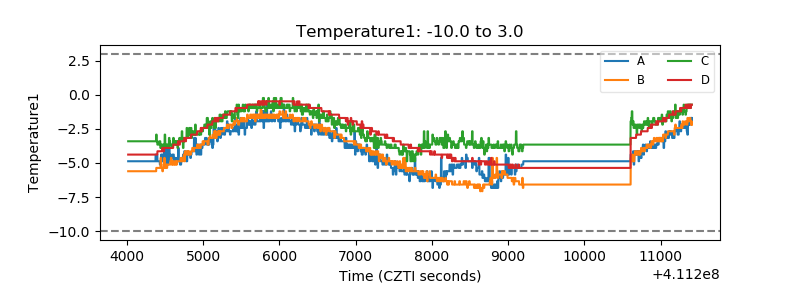 |
| Veto HV Monitor | 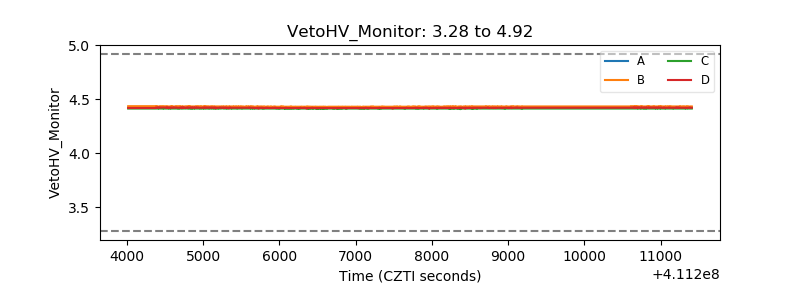 |
| Veto LLD | 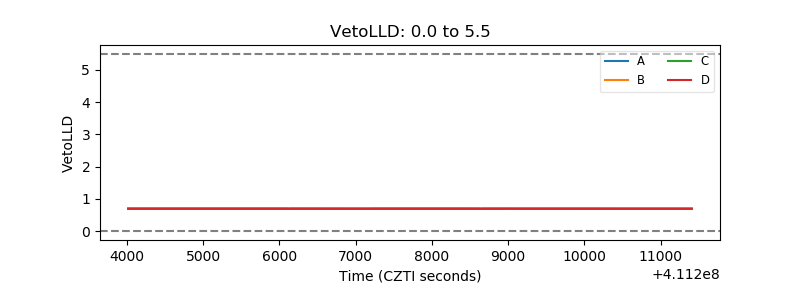 |
| Alpha Counter | 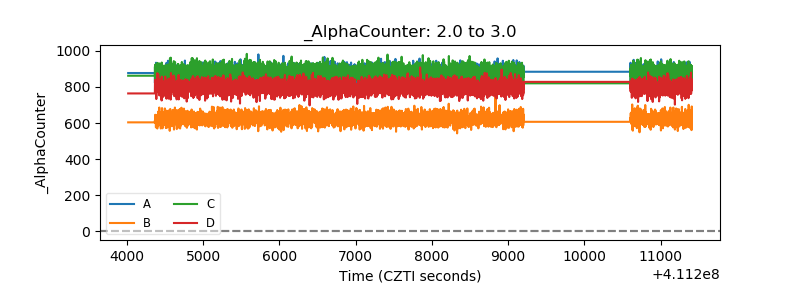 |
| _CPM_Rate | 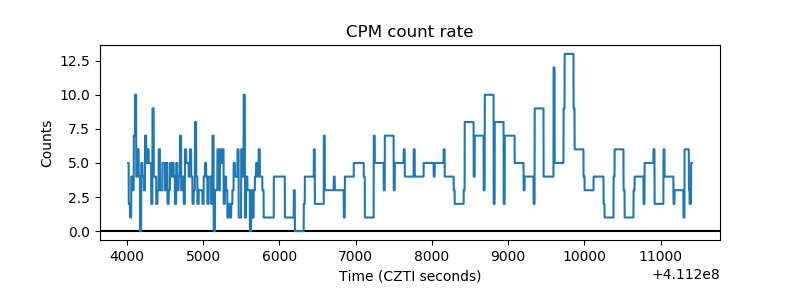 |
| CZT Counter | 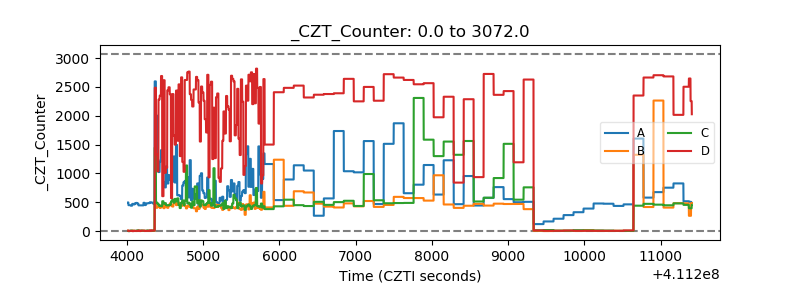 |
| +2.5 Volts monitor | 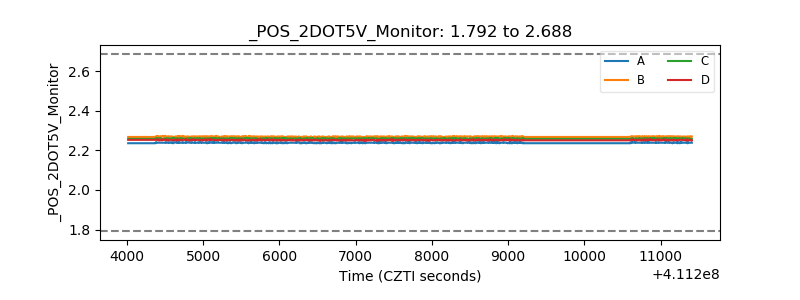 |
| +5 Volts monitor | 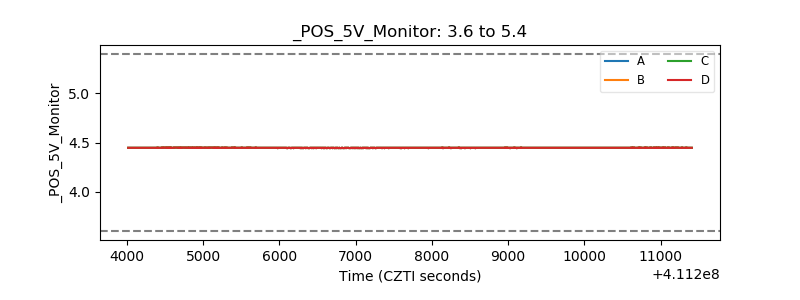 |
| _ROLL_ROT | 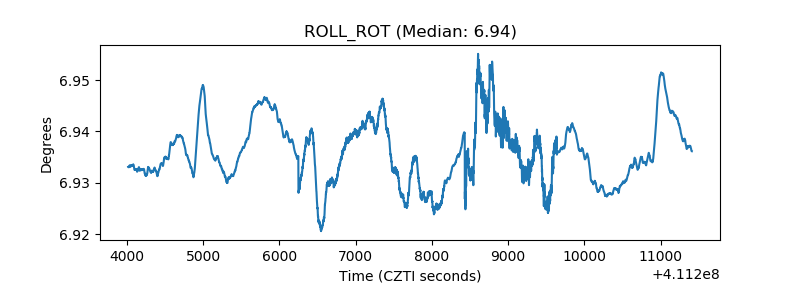 |
| _Roll_DEC | 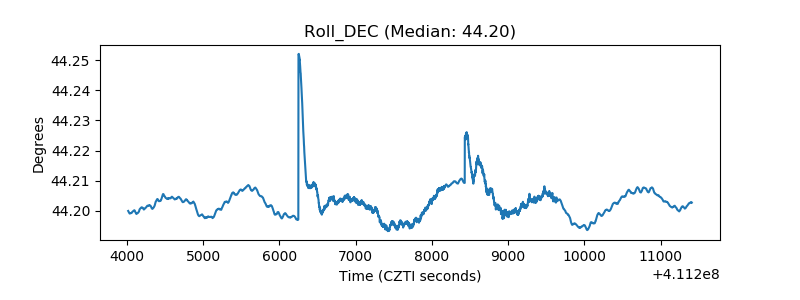 |
| _Roll_RA | 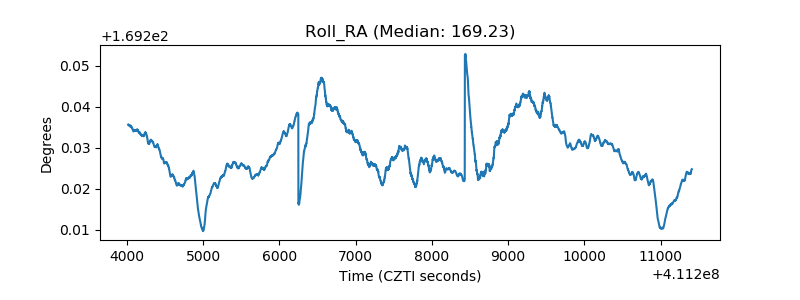 |
| Veto Counter | 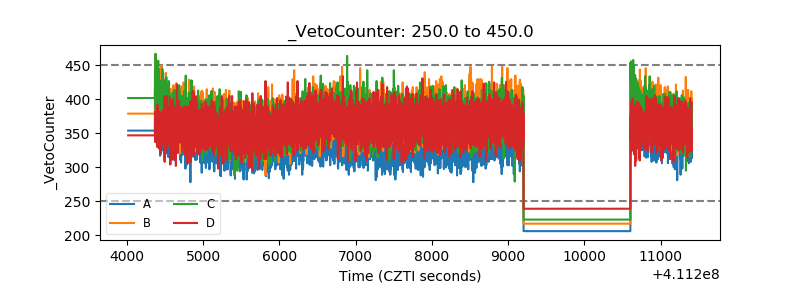 |