| Param | Original file | Final file |
|---|---|---|
| Filename | modeM0/AS1A12_077T06_9000005474_39423cztM0_level2.fits | modeM0/AS1A12_077T06_9000005474_39423cztM0_level2_quad_clean.evt |
| Size (bytes) | 776,335,680 | 79,418,880 |
| Size | 740.4 MB | 75.7 MB |
| Events in quadrant A | 5,224,916 | 645,198 |
| Events in quadrant B | 3,197,541 | 673,375 |
| Events in quadrant C | 5,809,414 | 582,391 |
| Events in quadrant D | 14,044,858 | 87,844 |
| Mode M0 | |||
|---|---|---|---|
| Quadrant | BADHDUFLAG | Total packets | Discarded packets |
| A | 0 | 19811 | 3 |
| B | 0 | 13573 | 2 |
| C | 0 | 21231 | 2 |
| D | 0 | 45907 | 9 |
| Mode SS | |||
|---|---|---|---|
| Quadrant | BADHDUFLAG | Total packets | Discarded packets |
| A | 0 | 122 | 0 |
| B | 0 | 122 | 0 |
| C | 0 | 122 | 0 |
| D | 0 | 122 | 0 |
| Mode M9 | |||
|---|---|---|---|
| Quadrant | BADHDUFLAG | Total packets | Discarded packets |
| A | 0 | 17 | 0 |
| B | 0 | 17 | 0 |
| C | 0 | 17 | 0 |
| D | 0 | 18 | 0 |
| Quadrant | Total seconds | Saturated seconds | Saturation percentage |
|---|---|---|---|
| A | 5982 | 233 | 3.895018% |
| B | 5982 | 85 | 1.420929% |
| C | 5982 | 691 | 11.551321% |
| D | 5836 | 5138 | 88.039753% |
Noise dominated data is calculated using 1-second bins in cleaned event files. If a bin has >2000 counts, and if more than 50% of those come from <1% of pixels, then it is considered to be noise-dominated and hence unusable.
| Quadrant | # 1 sec bins | Bins with >0 counts | Bins with >2000 counts | High rate bins dominated by noise | Noise dominated (total time) | Noise dominated (detector-on time) | Marked lightcurve |
|---|---|---|---|---|---|---|---|
| A | 7264 | 5983 | 169 | 169 | 2.33% | 2.82% | 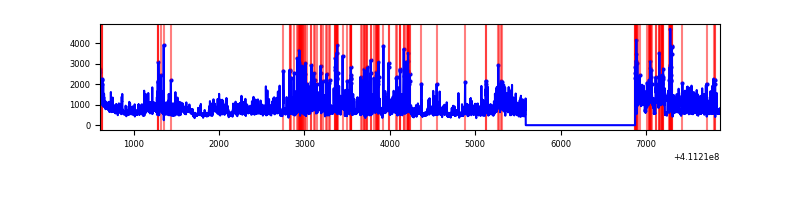 |
| B | 7264 | 5983 | 46 | 46 | 0.63% | 0.77% | 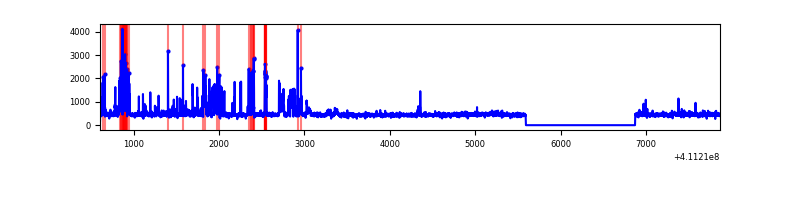 |
| C | 7264 | 5983 | 579 | 579 | 7.97% | 9.68% | 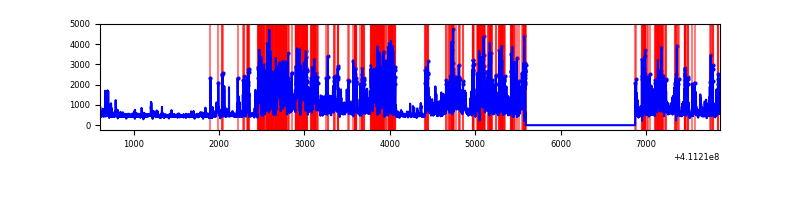 |
| D | 7117 | 5835 | 4394 | 4394 | 61.74% | 75.30% | 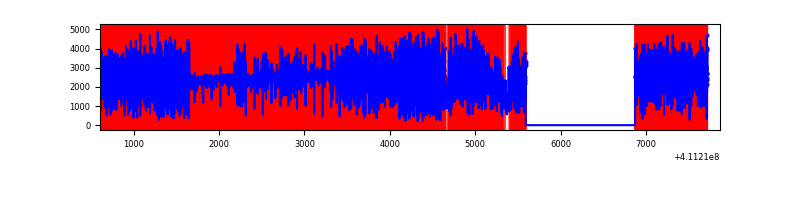 |
Top three noisy pixels from each quadrant. If the there are fewer than three noisy pixels in the level2.evt file, extra rows are filled as -1
| Pixel properties | Quadrant properties | ||||||
|---|---|---|---|---|---|---|---|
| Quadrant | DetID | PixID | Counts | Sigma | Mean | Median | Sigma |
| A | 15 | 222 | 2136237 | 15789.88 | 659 | 645 | 135.3 |
| A | 10 | 83 | 484385 | 3576.62 | 659 | 645 | 135.3 |
| A | 2 | 79 | 34171 | 247.88 | 659 | 645 | 135.3 |
| B | 6 | 203 | 273853 | 2101.96 | 663 | 647 | 130.0 |
| B | 5 | 255 | 225146 | 1727.23 | 663 | 647 | 130.0 |
| B | 5 | 172 | 70734 | 539.23 | 663 | 647 | 130.0 |
| C | 15 | 208 | 2913975 | 19925.43 | 622 | 625 | 146.2 |
| C | 15 | 214 | 243656 | 1662.18 | 622 | 625 | 146.2 |
| C | 14 | 254 | 84243 | 571.89 | 622 | 625 | 146.2 |
| D | 12 | 235 | 10577317 | 146137.0 | 288 | 279 | 72.4 |
| D | 12 | 0 | 1666206 | 23017.18 | 288 | 279 | 72.4 |
| D | 2 | 249 | 355985 | 4914.59 | 288 | 279 | 72.4 |
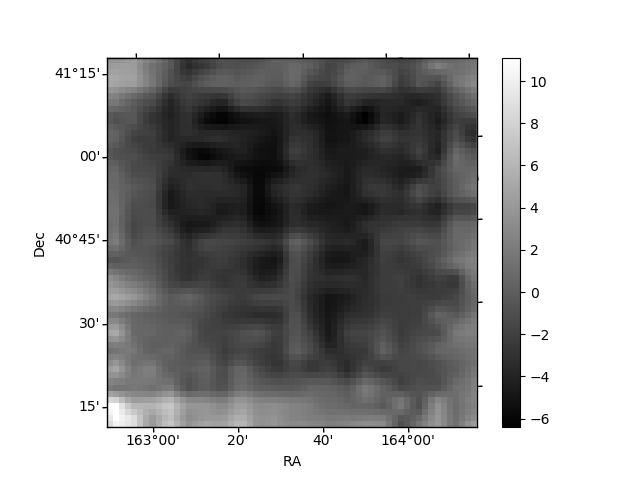
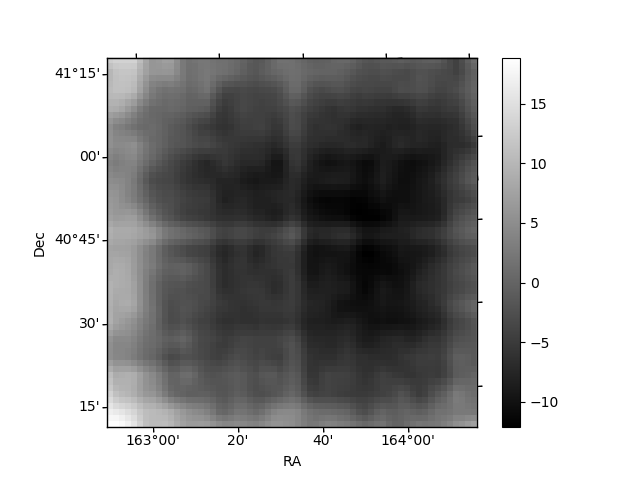
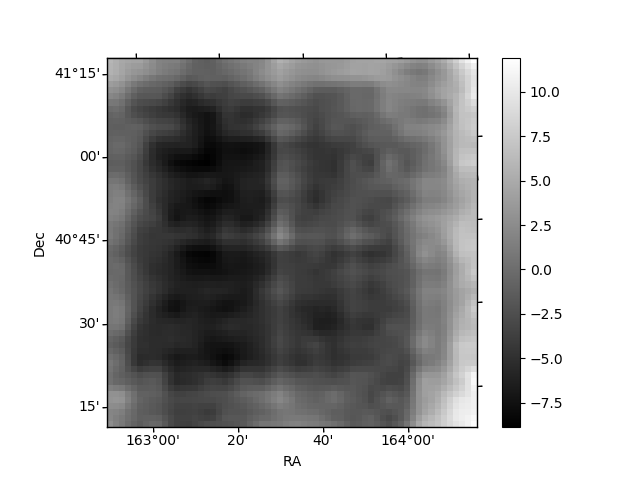
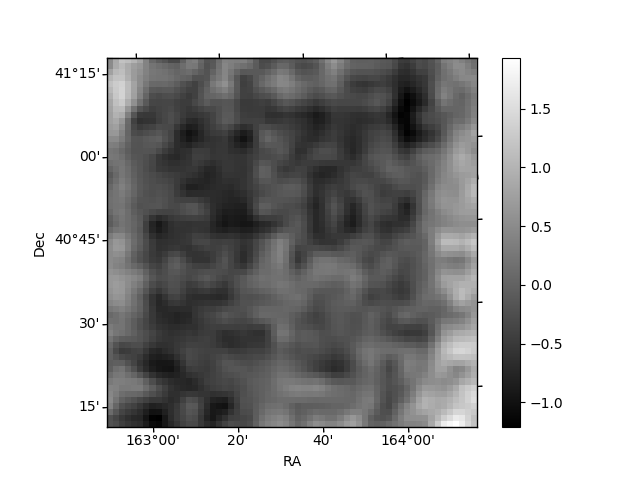
Histogram calculated using DETX and DETY for each event in the final _common_clean file
| Quadrant A | 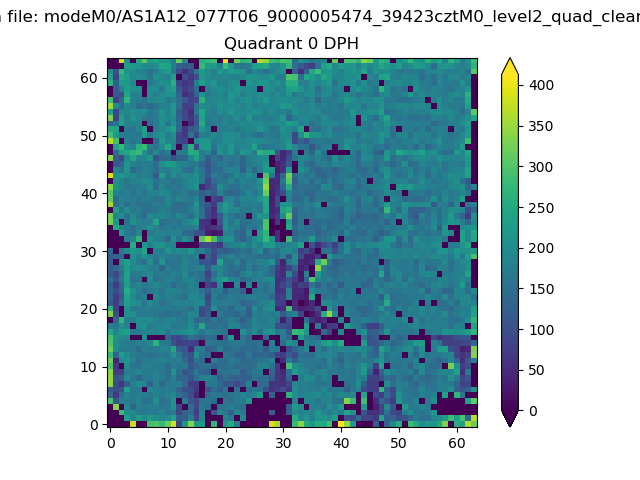 |
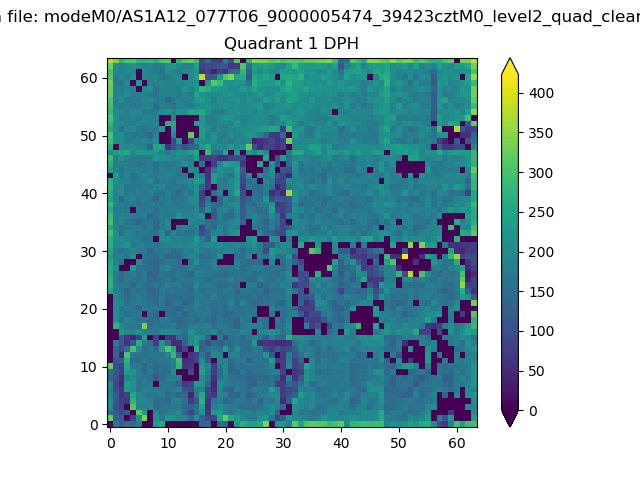 |
Quadrant B |
|---|---|---|---|
| Quadrant D | 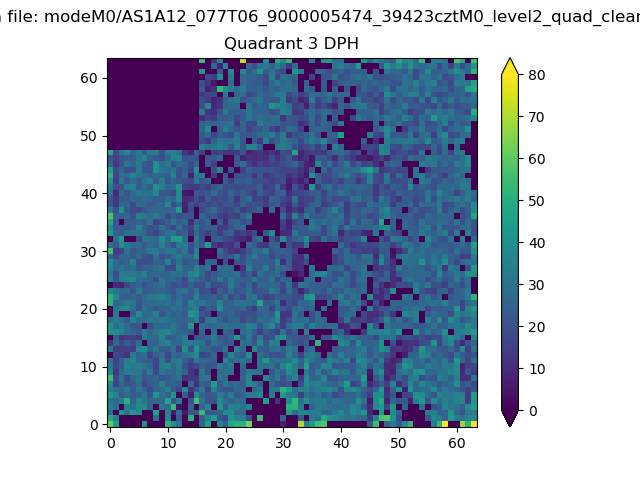 |
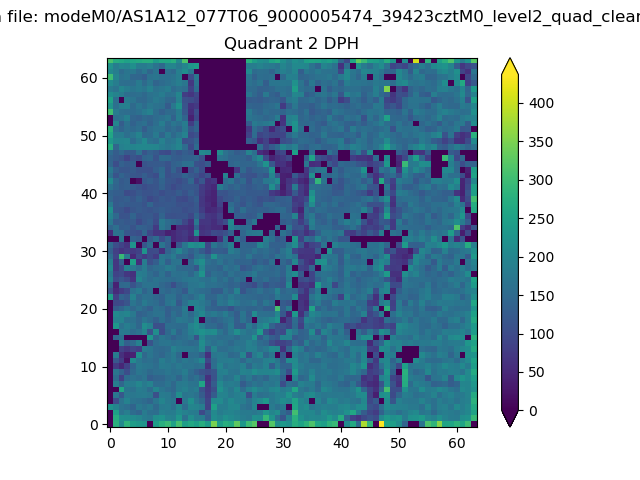 |
Quadrant C |
| Plot type | Count rate plots | Images |
|---|---|---|
| Comparison with Poisson distribution Blue bars denote a histogram of data divided into 1 sec bins. Red curve is a Poisson curve with rate = median count rate of data. |
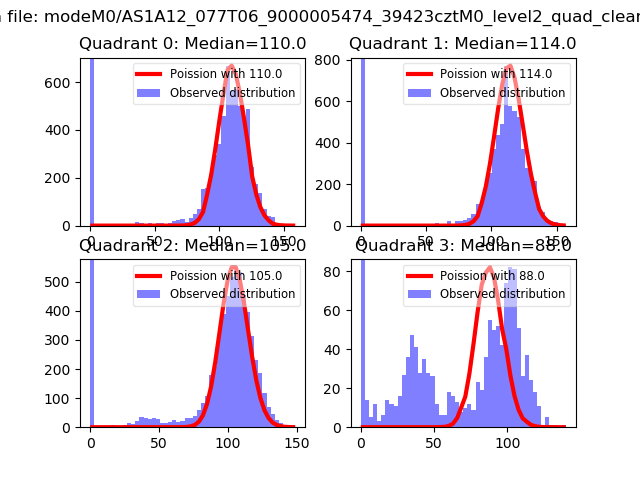 |
 |
| Quadrant-wise count rates Data is divided into 100 sec bins |
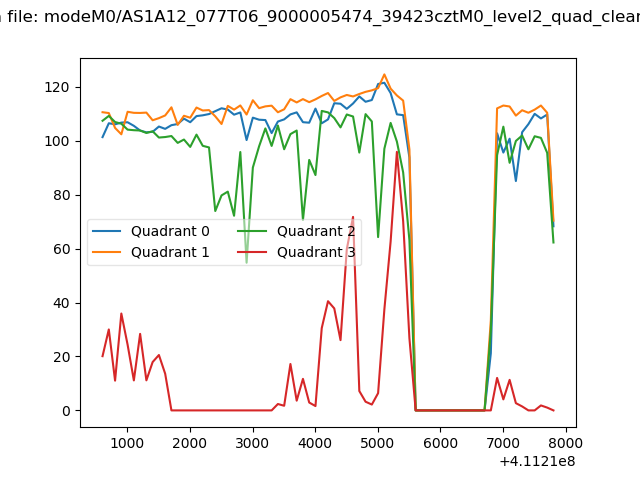 |
|
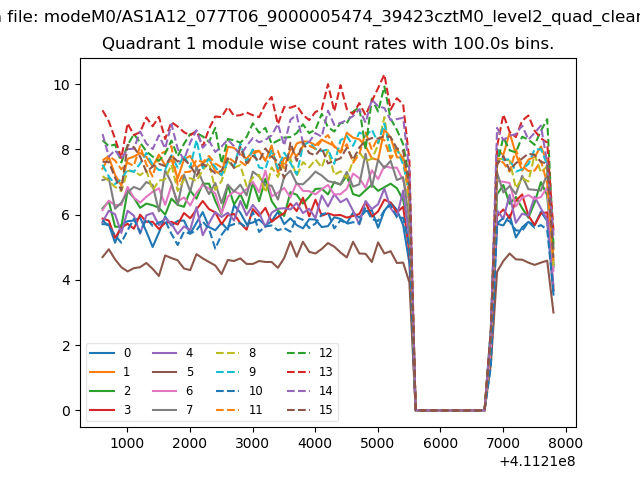
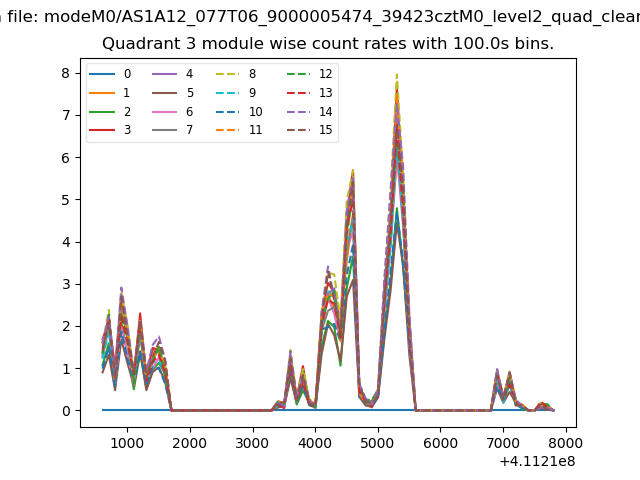
| Module-wise count rates for Quadrant A Data is divided into 100 sec bins |
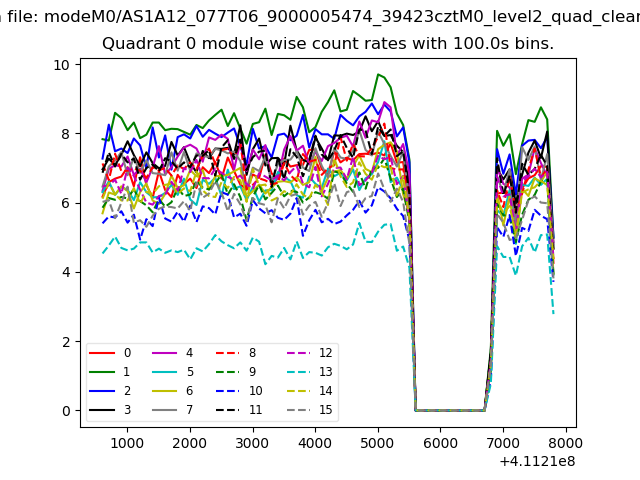 |
 |
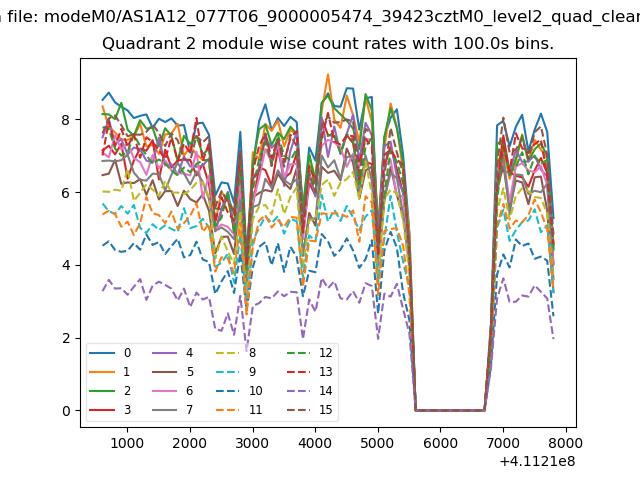
| Module-wise count rates for Quadrant B Data is divided into 100 sec bins |
 |
 |
| Module-wise count rates for Quadrant C Data is divided into 100 sec bins |
 |
 |
| Module-wise count rates for Quadrant D Data is divided into 100 sec bins |
 |
 |
| Parameter | Plot |
|---|---|
| CZT HV Monitor | 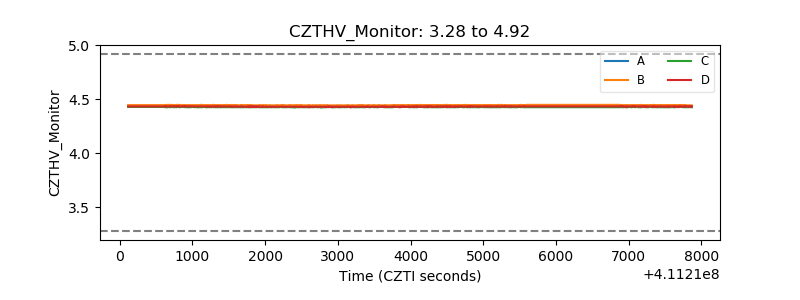 |
| D_VDD | 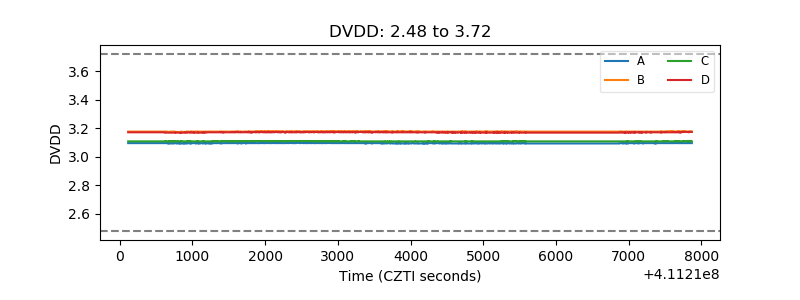 |
| Temperature 1 | 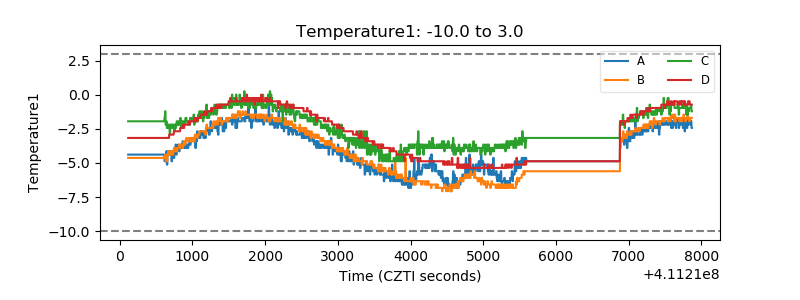 |
| Veto HV Monitor | 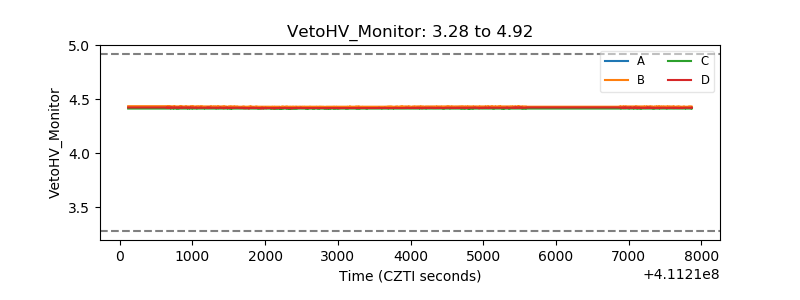 |
| Veto LLD | 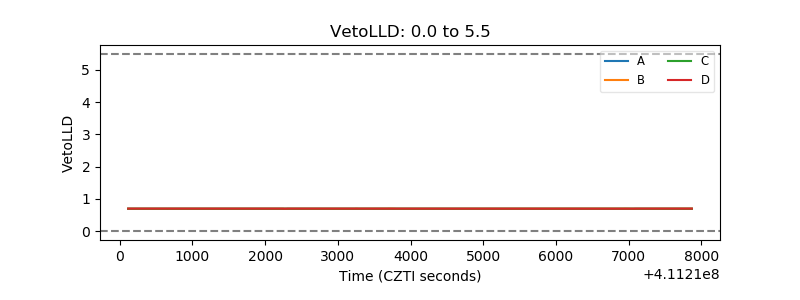 |
| Alpha Counter | 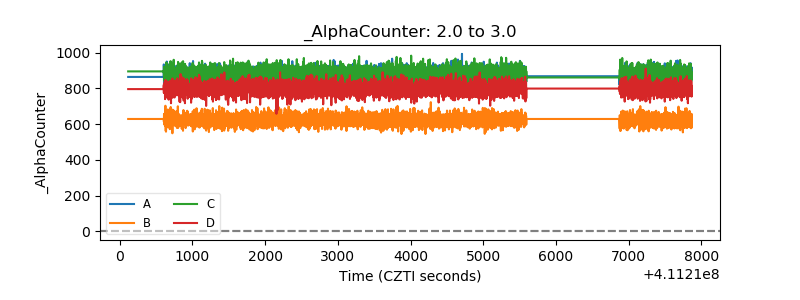 |
| _CPM_Rate | 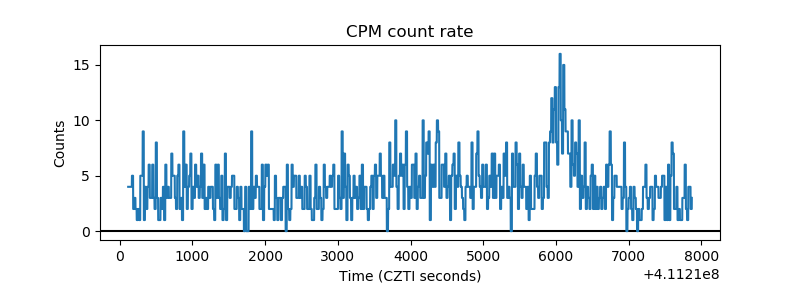 |
| CZT Counter | 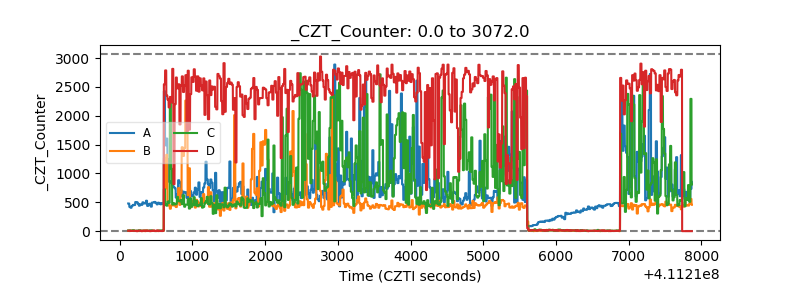 |
| +2.5 Volts monitor | 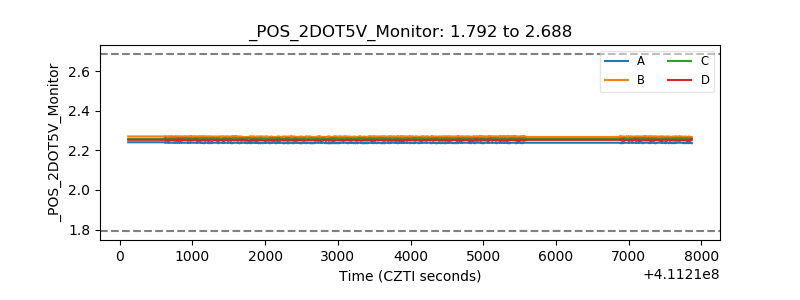 |
| +5 Volts monitor | 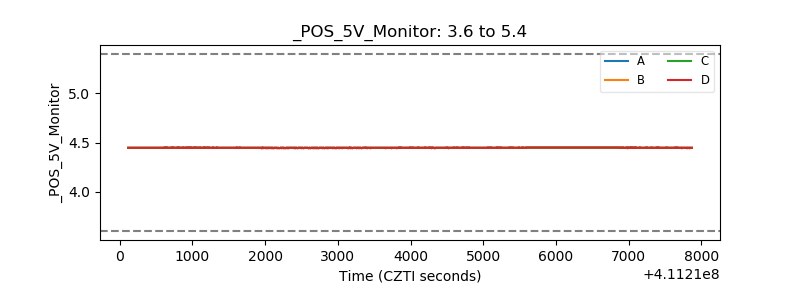 |
| _ROLL_ROT | 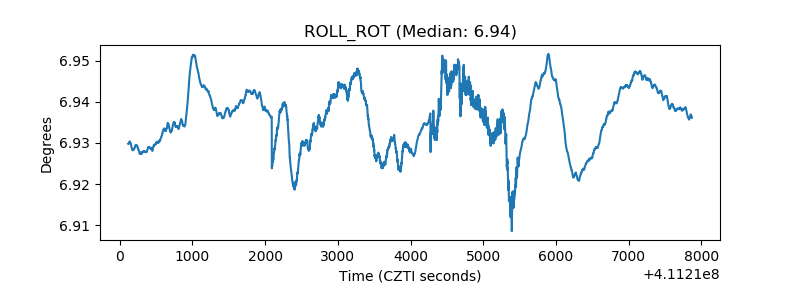 |
| _Roll_DEC | 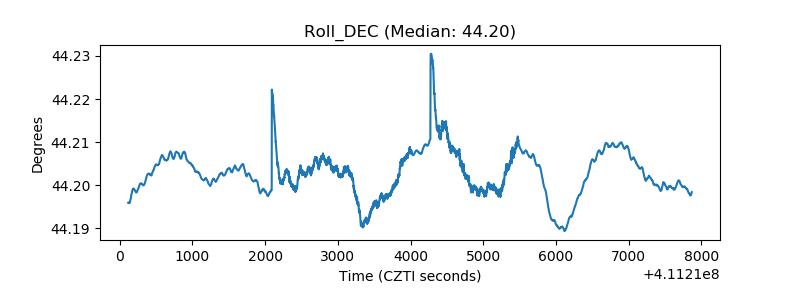 |
| _Roll_RA | 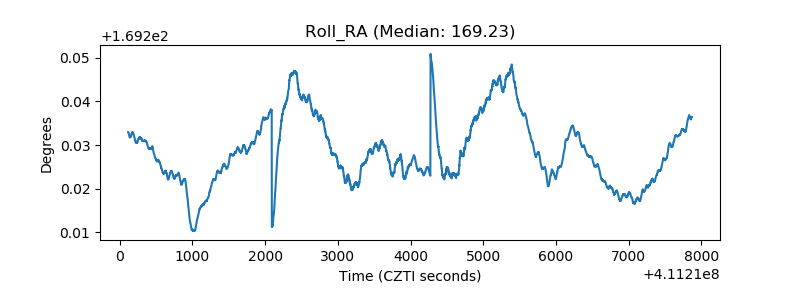 |
| Veto Counter | 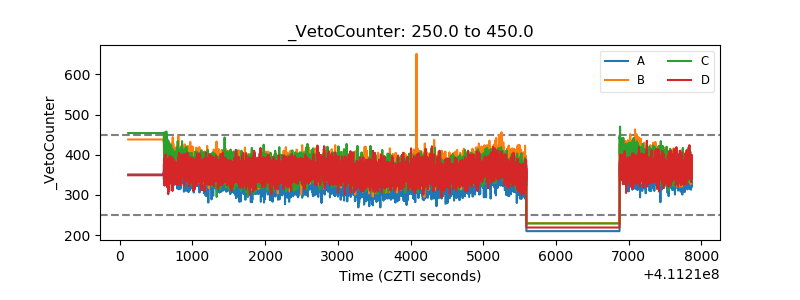 |