| Param | Original file | Final file |
|---|---|---|
| Filename | modeM0/AS1A12_077T06_9000005474_39426cztM0_level2.fits | modeM0/AS1A12_077T06_9000005474_39426cztM0_level2_quad_clean.evt |
| Size (bytes) | 1,333,359,360 | 243,789,120 |
| Size | 1.2 GB | 232.5 MB |
| Events in quadrant A | 11,959,351 | 1,696,881 |
| Events in quadrant B | 8,029,163 | 1,713,876 |
| Events in quadrant C | 16,771,330 | 1,485,029 |
| Events in quadrant D | 11,394,907 | 1,410,658 |
| Mode M0 | |||
|---|---|---|---|
| Quadrant | BADHDUFLAG | Total packets | Discarded packets |
| A | 0 | 45951 | 5 |
| B | 0 | 34704 | 4 |
| C | 0 | 60528 | 4 |
| D | 0 | 44927 | 11 |
| Mode SS | |||
|---|---|---|---|
| Quadrant | BADHDUFLAG | Total packets | Discarded packets |
| A | 0 | 318 | 0 |
| B | 0 | 318 | 0 |
| C | 0 | 318 | 0 |
| D | 0 | 318 | 0 |
| Mode M9 | |||
|---|---|---|---|
| Quadrant | BADHDUFLAG | Total packets | Discarded packets |
| A | 0 | 50 | 0 |
| B | 0 | 50 | 0 |
| C | 0 | 50 | 0 |
| D | 0 | 51 | 0 |
| Quadrant | Total seconds | Saturated seconds | Saturation percentage |
|---|---|---|---|
| A | 15607 | 374 | 2.396361% |
| B | 15607 | 360 | 2.306657% |
| C | 15607 | 2244 | 14.378164% |
| D | 15453 | 1200 | 7.765482% |
Noise dominated data is calculated using 1-second bins in cleaned event files. If a bin has >2000 counts, and if more than 50% of those come from <1% of pixels, then it is considered to be noise-dominated and hence unusable.
| Quadrant | # 1 sec bins | Bins with >0 counts | Bins with >2000 counts | High rate bins dominated by noise | Noise dominated (total time) | Noise dominated (detector-on time) | Marked lightcurve |
|---|---|---|---|---|---|---|---|
| A | 19786 | 15610 | 208 | 208 | 1.05% | 1.33% | 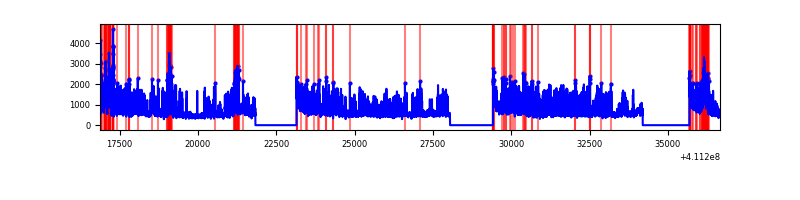 |
| B | 19786 | 15610 | 266 | 266 | 1.34% | 1.70% | 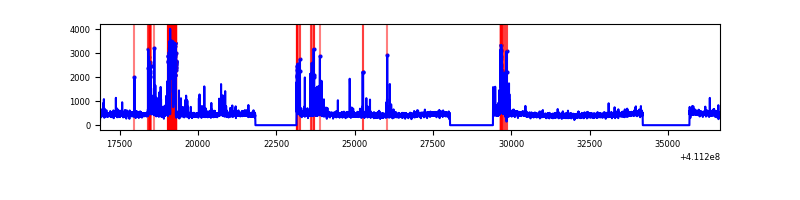 |
| C | 19786 | 15610 | 1887 | 1887 | 9.54% | 12.09% | 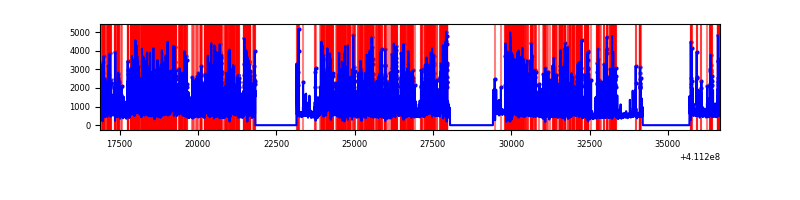 |
| D | 19786 | 15456 | 975 | 975 | 4.93% | 6.31% | 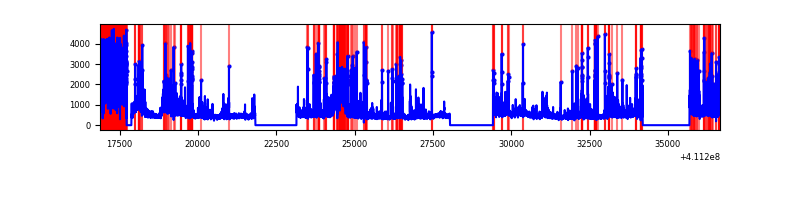 |
Top three noisy pixels from each quadrant. If the there are fewer than three noisy pixels in the level2.evt file, extra rows are filled as -1
| Pixel properties | Quadrant properties | ||||||
|---|---|---|---|---|---|---|---|
| Quadrant | DetID | PixID | Counts | Sigma | Mean | Median | Sigma |
| A | 15 | 222 | 3978848 | 11381.14 | 1722 | 1684 | 349.5 |
| A | 10 | 83 | 1157656 | 3307.96 | 1722 | 1684 | 349.5 |
| A | 2 | 79 | 102974 | 289.85 | 1722 | 1684 | 349.5 |
| B | 5 | 172 | 1232765 | 3691.63 | 1711 | 1661 | 333.5 |
| B | 5 | 255 | 43705 | 126.07 | 1711 | 1661 | 333.5 |
| B | 12 | 111 | 42127 | 121.34 | 1711 | 1661 | 333.5 |
| C | 15 | 208 | 9156917 | 24581.91 | 1605 | 1613 | 372.4 |
| C | 15 | 214 | 619091 | 1657.92 | 1605 | 1613 | 372.4 |
| C | 3 | 233 | 336787 | 899.94 | 1605 | 1613 | 372.4 |
| D | 12 | 235 | 1866135 | 4716.63 | 1609 | 1562 | 395.3 |
| D | 12 | 0 | 1378942 | 3484.23 | 1609 | 1562 | 395.3 |
| D | 13 | 249 | 634942 | 1602.2 | 1609 | 1562 | 395.3 |
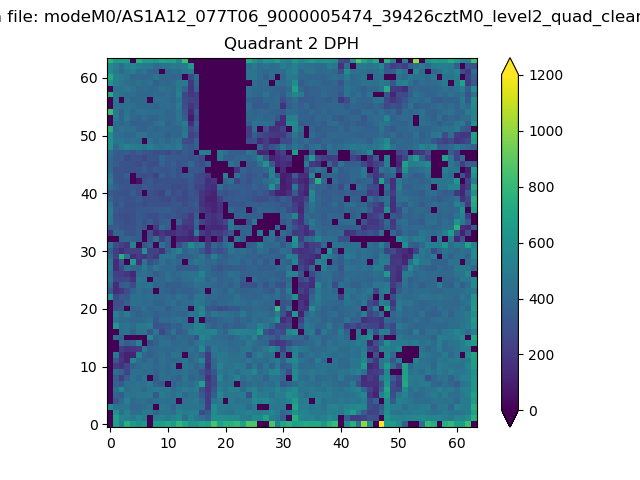
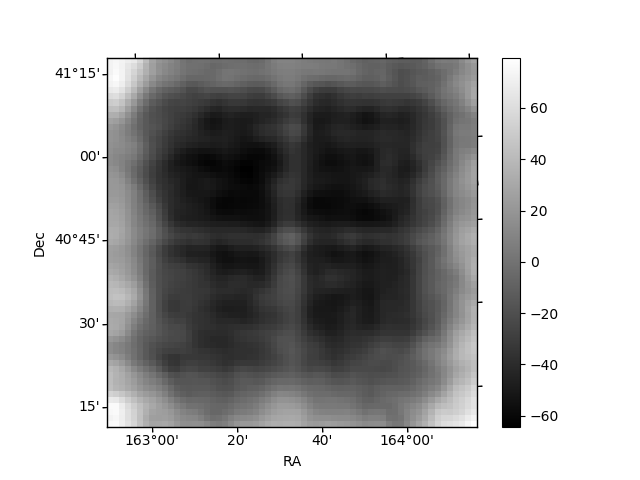
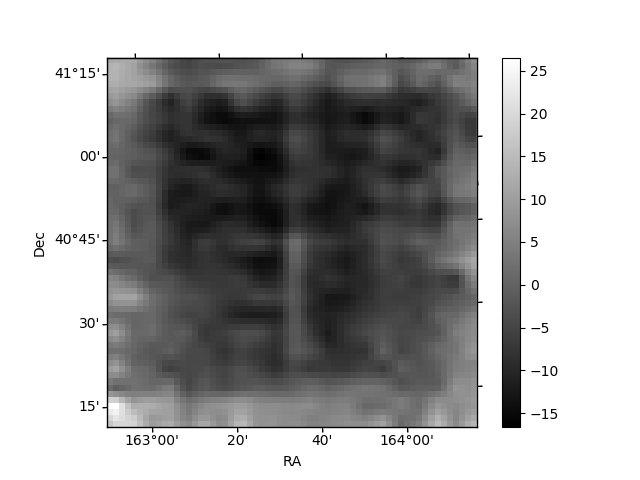
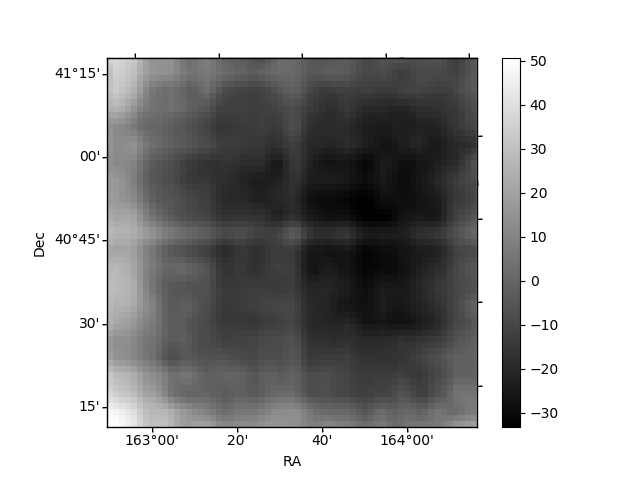
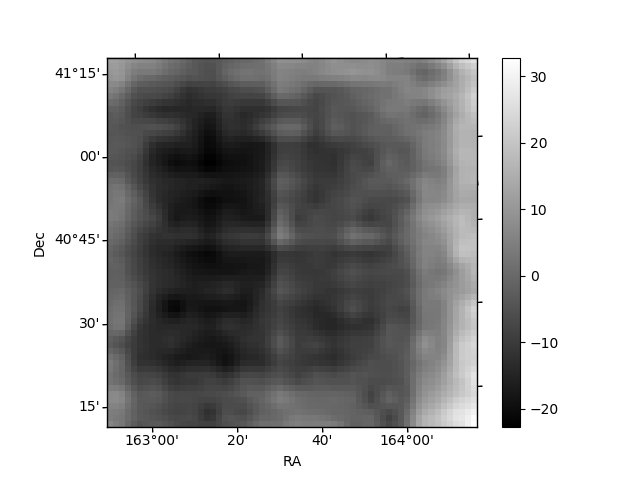
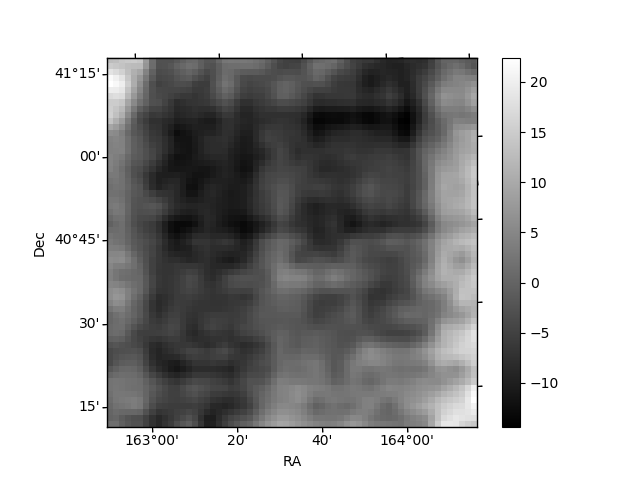
Histogram calculated using DETX and DETY for each event in the final _common_clean file
| Quadrant A | 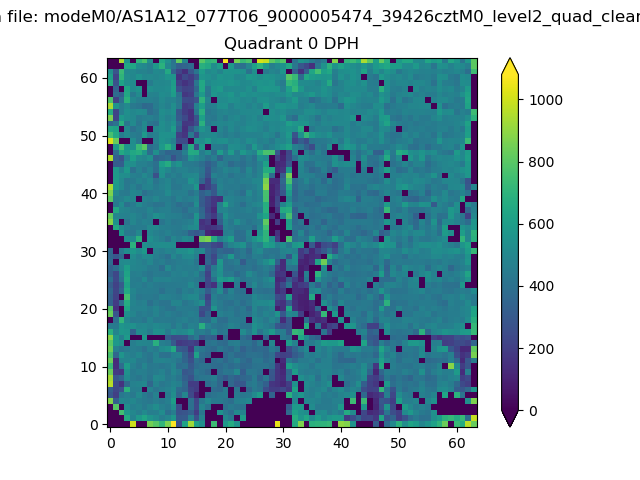 |
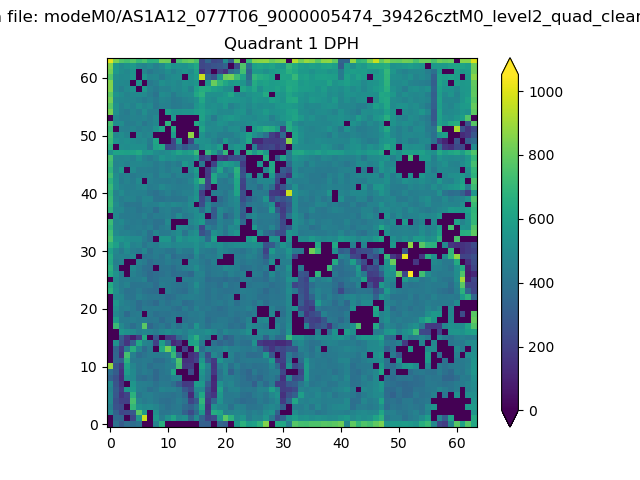 |
Quadrant B |
|---|---|---|---|
| Quadrant D | 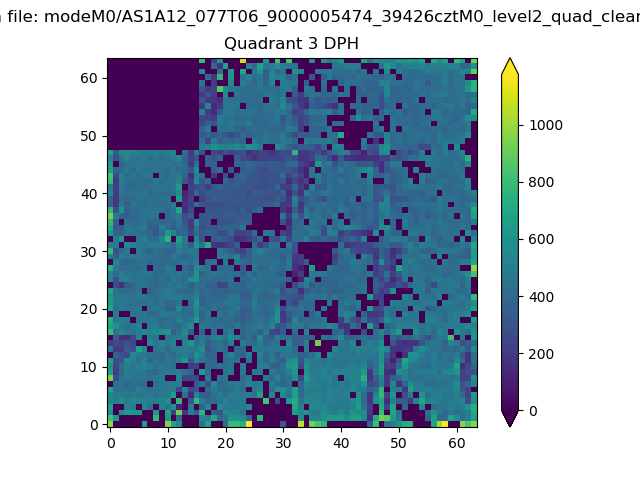 |
 |
Quadrant C |
| Plot type | Count rate plots | Images |
|---|---|---|
| Comparison with Poisson distribution Blue bars denote a histogram of data divided into 1 sec bins. Red curve is a Poisson curve with rate = median count rate of data. |
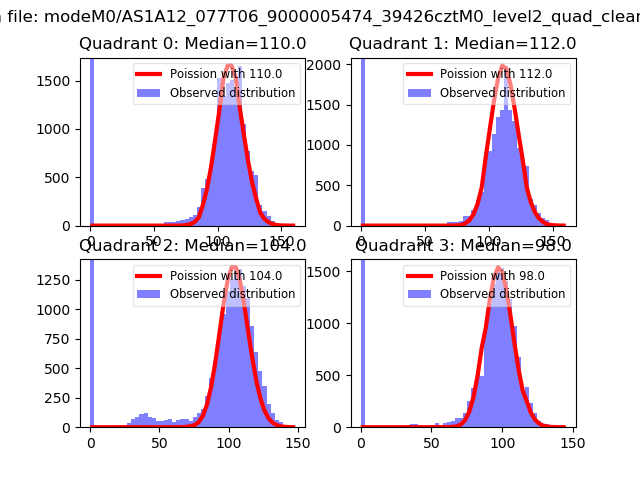 |
 |
| Quadrant-wise count rates Data is divided into 100 sec bins |
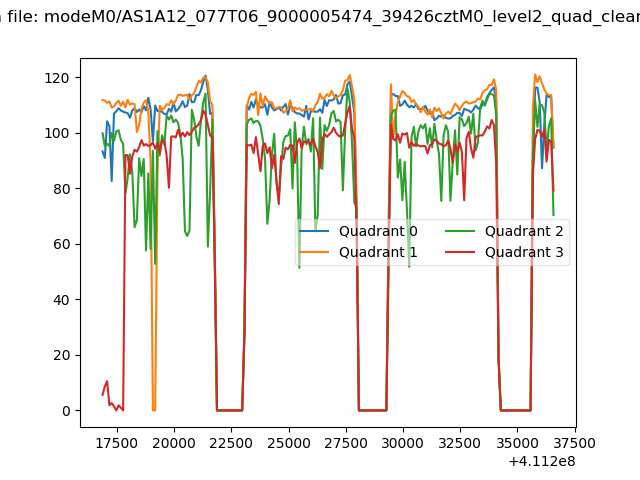 |
|
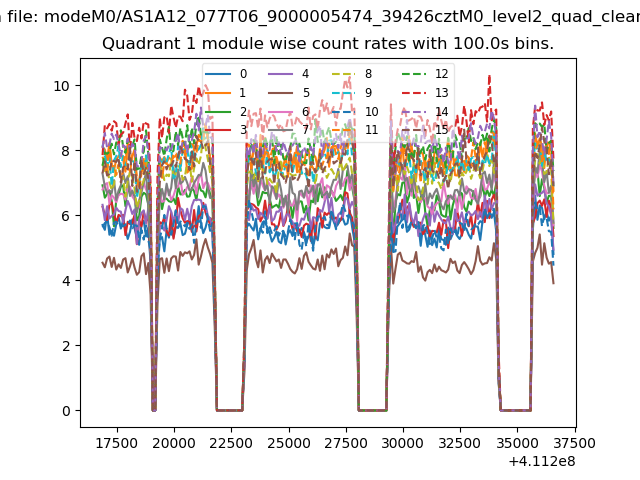
| Module-wise count rates for Quadrant A Data is divided into 100 sec bins |
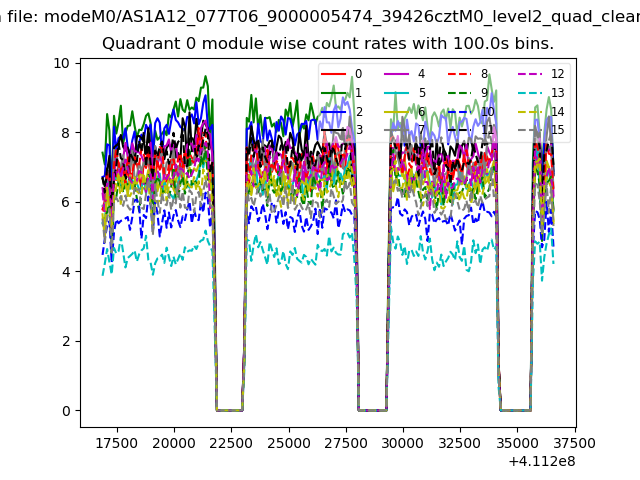 |
 |
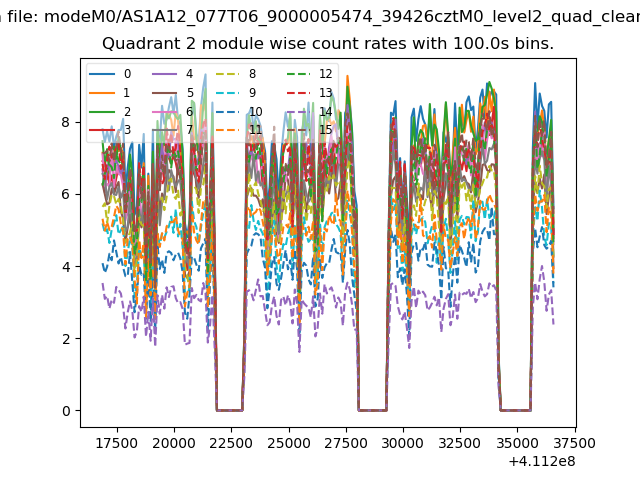
| Module-wise count rates for Quadrant B Data is divided into 100 sec bins |
 |
 |
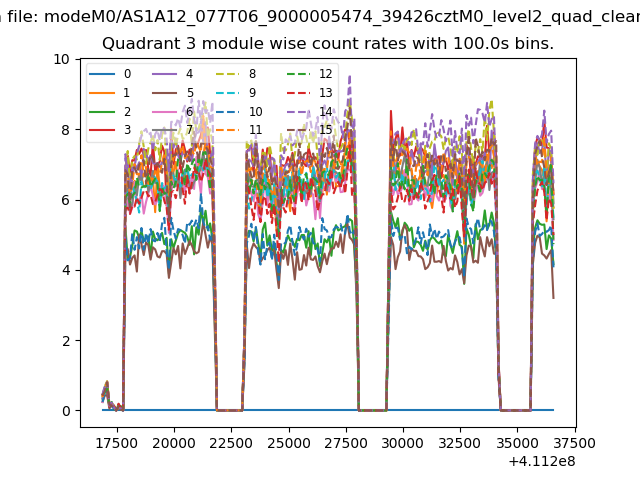
| Module-wise count rates for Quadrant C Data is divided into 100 sec bins |
 |
 |
| Module-wise count rates for Quadrant D Data is divided into 100 sec bins |
 |
 |
| Parameter | Plot |
|---|---|
| CZT HV Monitor | 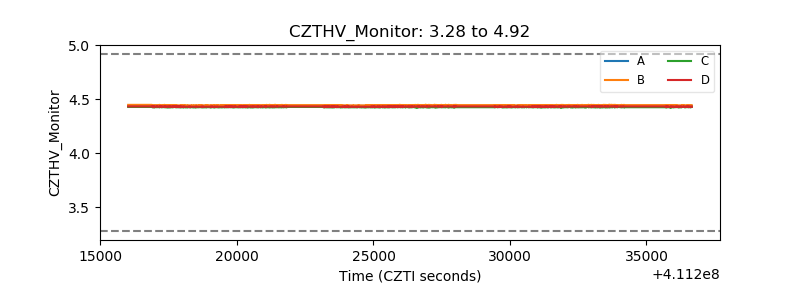 |
| D_VDD | 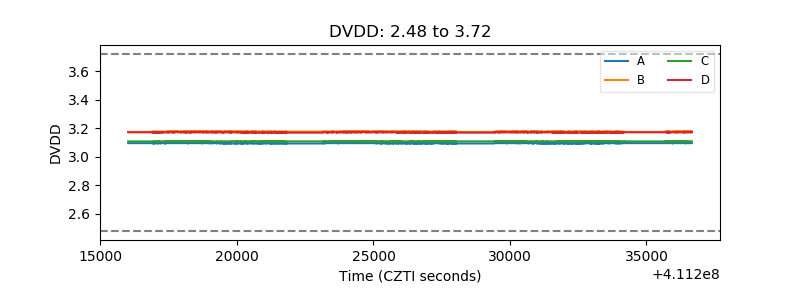 |
| Temperature 1 | 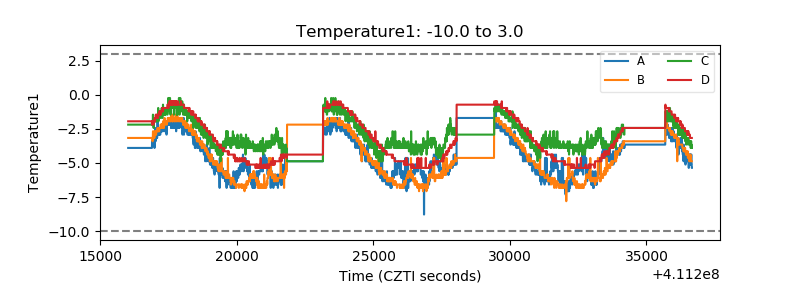 |
| Veto HV Monitor | 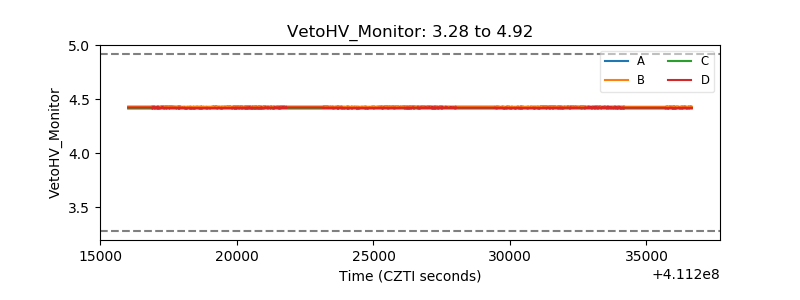 |
| Veto LLD | 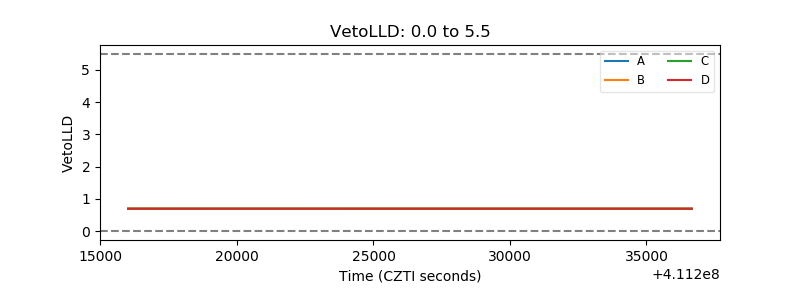 |
| Alpha Counter | 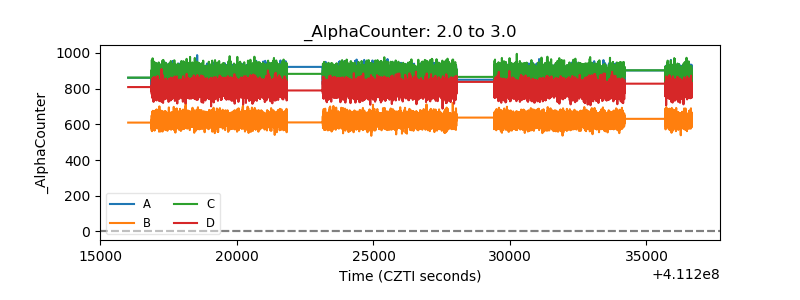 |
| _CPM_Rate | 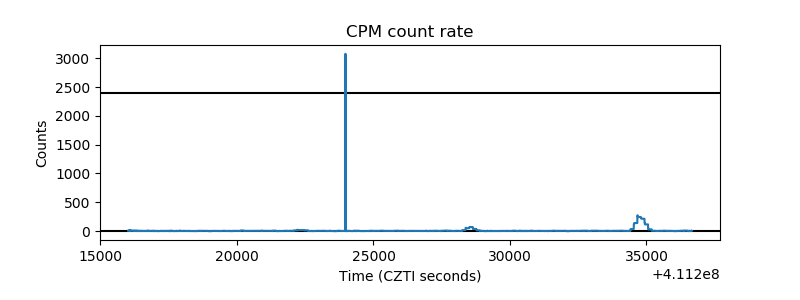 |
| CZT Counter | 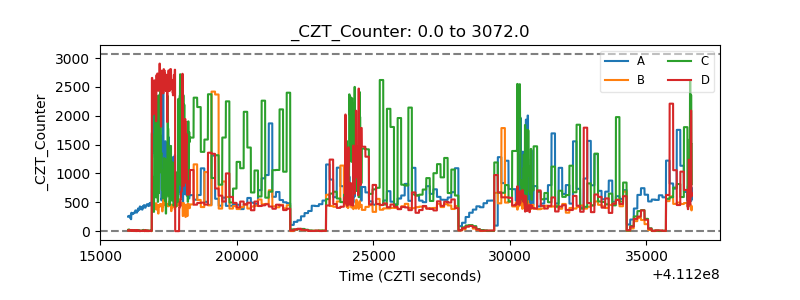 |
| +2.5 Volts monitor | 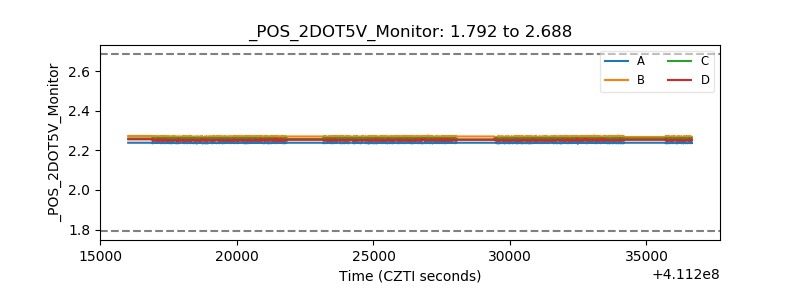 |
| +5 Volts monitor | 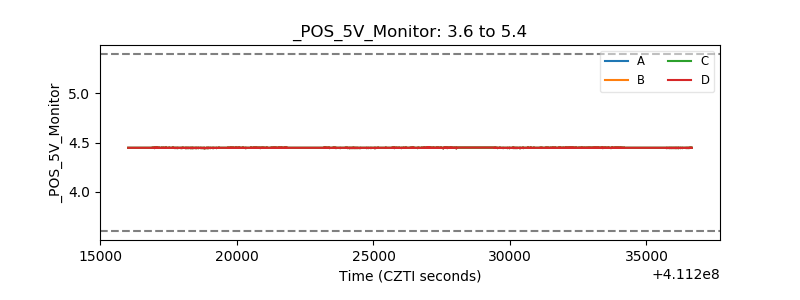 |
| _ROLL_ROT | 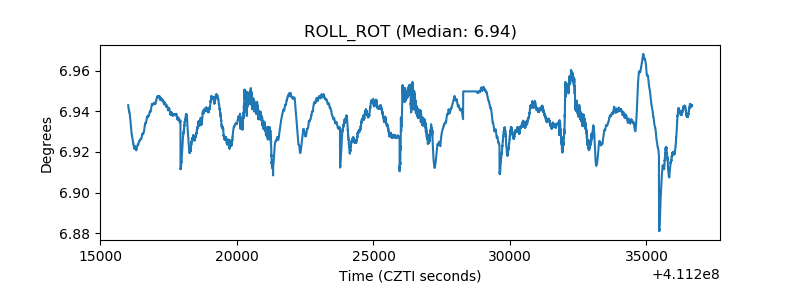 |
| _Roll_DEC | 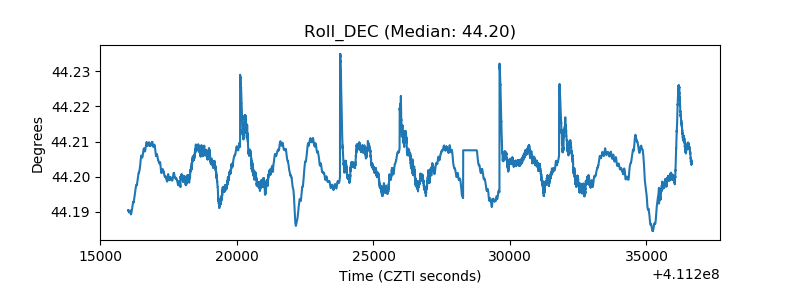 |
| _Roll_RA | 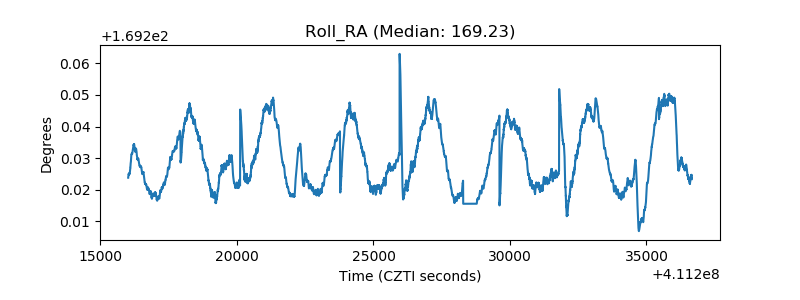 |
| Veto Counter | 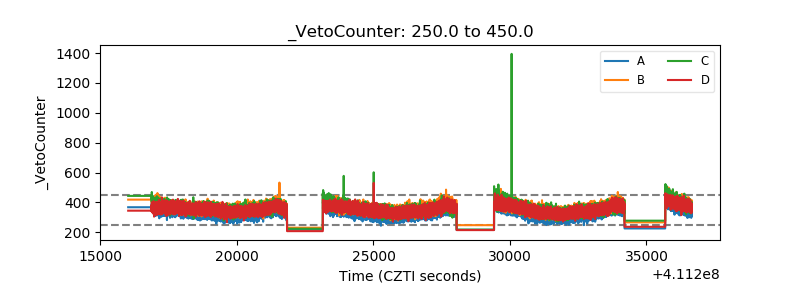 |