| Param | Original file | Final file |
|---|---|---|
| Filename | modeM0/AS1A12_077T06_9000005474_39427cztM0_level2.fits | modeM0/AS1A12_077T06_9000005474_39427cztM0_level2_quad_clean.evt |
| Size (bytes) | 436,219,200 | 92,920,320 |
| Size | 416.0 MB | 88.6 MB |
| Events in quadrant A | 4,452,026 | 624,533 |
| Events in quadrant B | 2,538,434 | 650,632 |
| Events in quadrant C | 4,916,365 | 574,761 |
| Events in quadrant D | 3,800,191 | 566,714 |
| Mode M0 | |||
|---|---|---|---|
| Quadrant | BADHDUFLAG | Total packets | Discarded packets |
| A | 0 | 17020 | 3 |
| B | 0 | 11535 | 2 |
| C | 0 | 18480 | 2 |
| D | 0 | 15364 | 2 |
| Mode SS | |||
|---|---|---|---|
| Quadrant | BADHDUFLAG | Total packets | Discarded packets |
| A | 0 | 118 | 0 |
| B | 0 | 118 | 0 |
| C | 0 | 118 | 0 |
| D | 0 | 118 | 0 |
| Mode M9 | |||
|---|---|---|---|
| Quadrant | BADHDUFLAG | Total packets | Discarded packets |
| A | 0 | 31 | 0 |
| B | 0 | 31 | 0 |
| C | 0 | 31 | 0 |
| D | 0 | 31 | 0 |
| Quadrant | Total seconds | Saturated seconds | Saturation percentage |
|---|---|---|---|
| A | 5671 | 186 | 3.279845% |
| B | 5671 | 5 | 0.088168% |
| C | 5671 | 532 | 9.381062% |
| D | 5671 | 166 | 2.927173% |
Noise dominated data is calculated using 1-second bins in cleaned event files. If a bin has >2000 counts, and if more than 50% of those come from <1% of pixels, then it is considered to be noise-dominated and hence unusable.
| Quadrant | # 1 sec bins | Bins with >0 counts | Bins with >2000 counts | High rate bins dominated by noise | Noise dominated (total time) | Noise dominated (detector-on time) | Marked lightcurve |
|---|---|---|---|---|---|---|---|
| A | 8777 | 5673 | 115 | 115 | 1.31% | 2.03% | 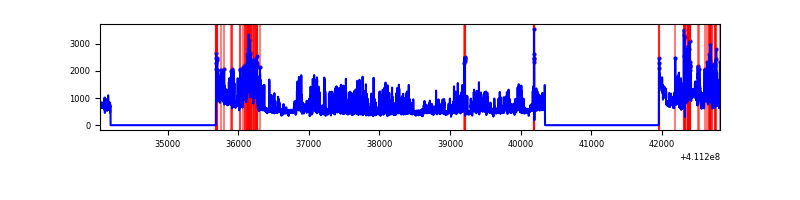 |
| B | 8777 | 5673 | 0 | 0 | 0.00% | 0.00% | 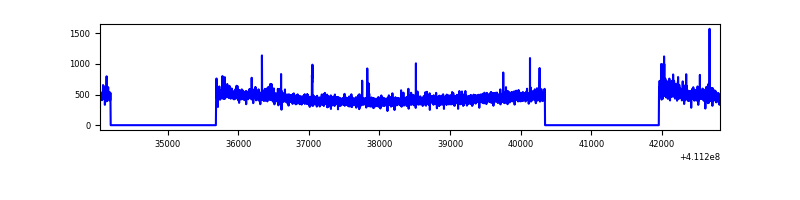 |
| C | 8777 | 5673 | 452 | 452 | 5.15% | 7.97% | 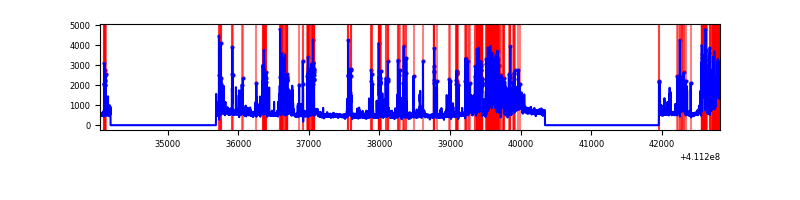 |
| D | 8777 | 5673 | 126 | 126 | 1.44% | 2.22% | 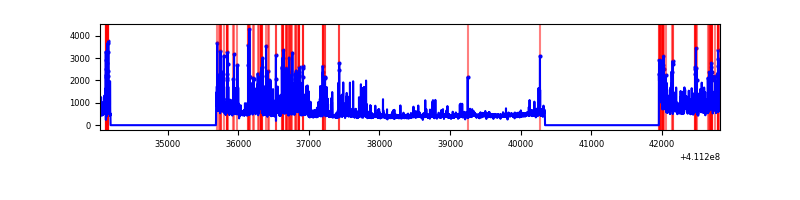 |
Top three noisy pixels from each quadrant. If the there are fewer than three noisy pixels in the level2.evt file, extra rows are filled as -1
| Pixel properties | Quadrant properties | ||||||
|---|---|---|---|---|---|---|---|
| Quadrant | DetID | PixID | Counts | Sigma | Mean | Median | Sigma |
| A | 15 | 222 | 1483180 | 11442.52 | 626 | 614 | 129.6 |
| A | 10 | 83 | 466931 | 3599.06 | 626 | 614 | 129.6 |
| A | 2 | 79 | 29529 | 223.16 | 626 | 614 | 129.6 |
| B | 5 | 172 | 22405 | 176.51 | 632 | 614 | 123.5 |
| B | 5 | 255 | 20001 | 157.04 | 632 | 614 | 123.5 |
| B | 12 | 111 | 15481 | 120.43 | 632 | 614 | 123.5 |
| C | 15 | 208 | 1751288 | 12449.46 | 597 | 601 | 140.6 |
| C | 9 | 187 | 365081 | 2591.88 | 597 | 601 | 140.6 |
| C | 15 | 214 | 230477 | 1634.69 | 597 | 601 | 140.6 |
| D | 12 | 227 | 575353 | 3863.79 | 610 | 593 | 148.8 |
| D | 2 | 249 | 217605 | 1458.85 | 610 | 593 | 148.8 |
| D | 2 | 153 | 205233 | 1375.68 | 610 | 593 | 148.8 |
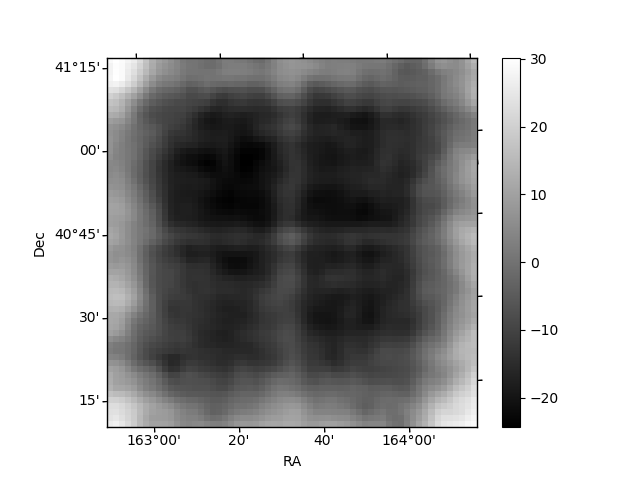
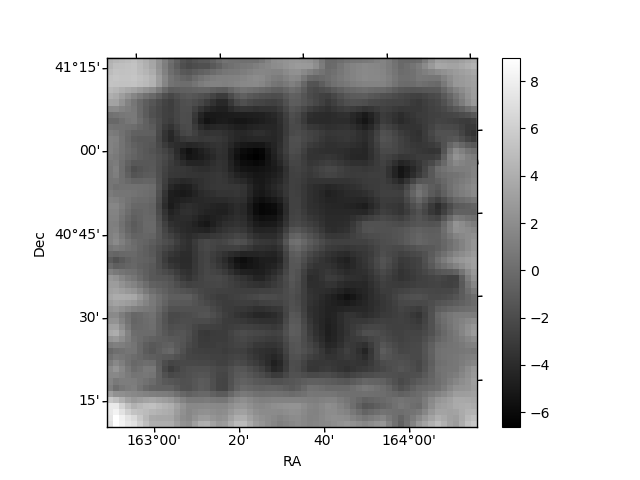
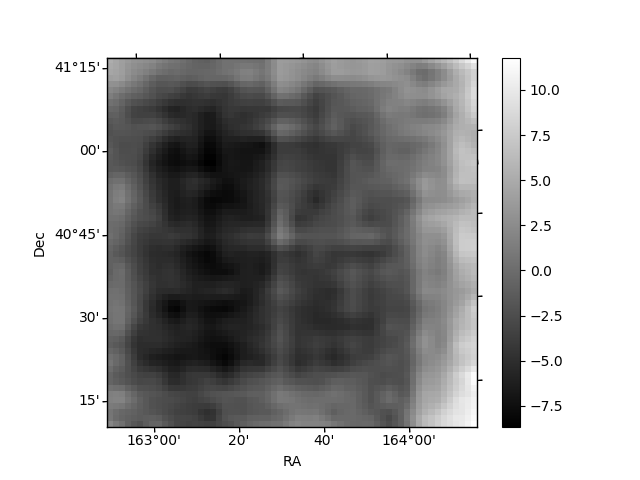
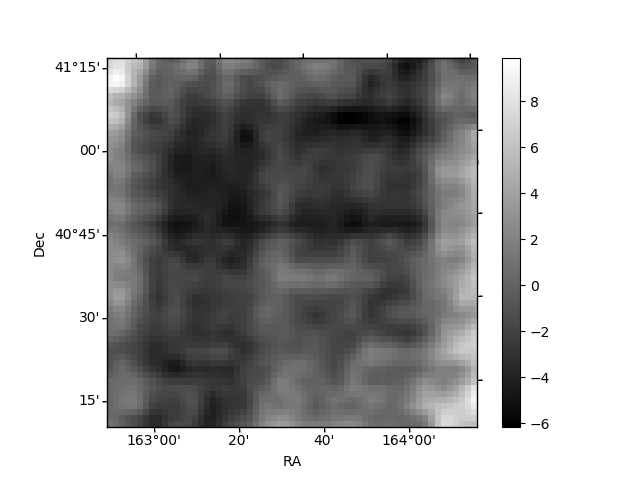
Histogram calculated using DETX and DETY for each event in the final _common_clean file
| Quadrant A | 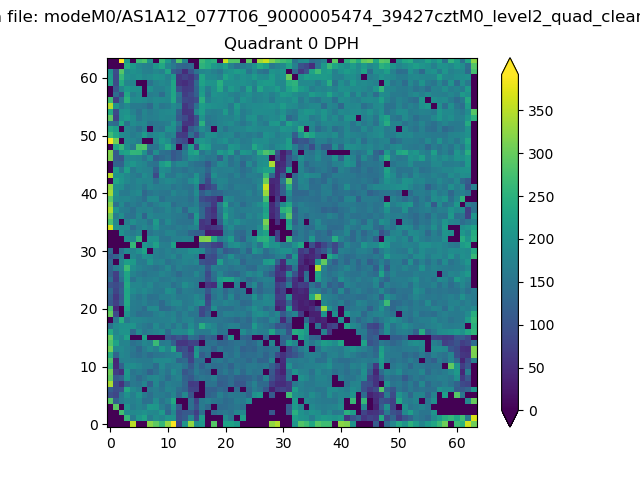 |
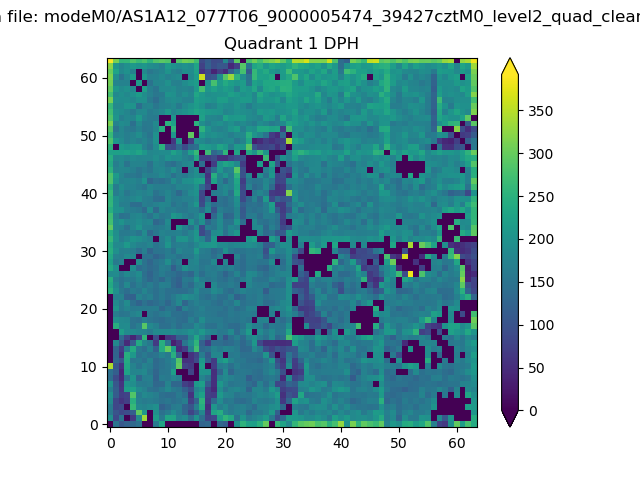 |
Quadrant B |
|---|---|---|---|
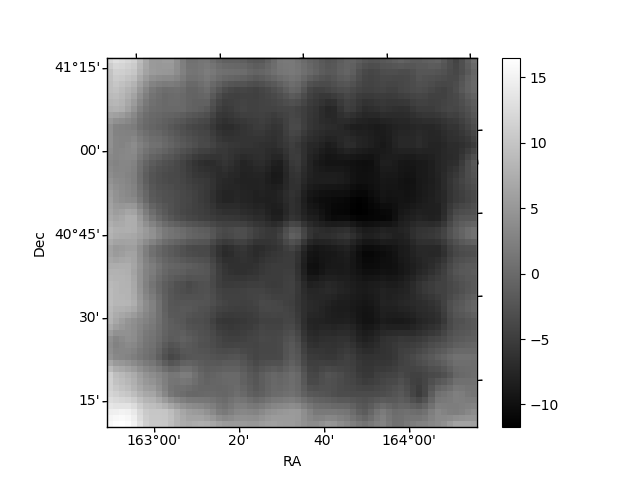
| Quadrant D | 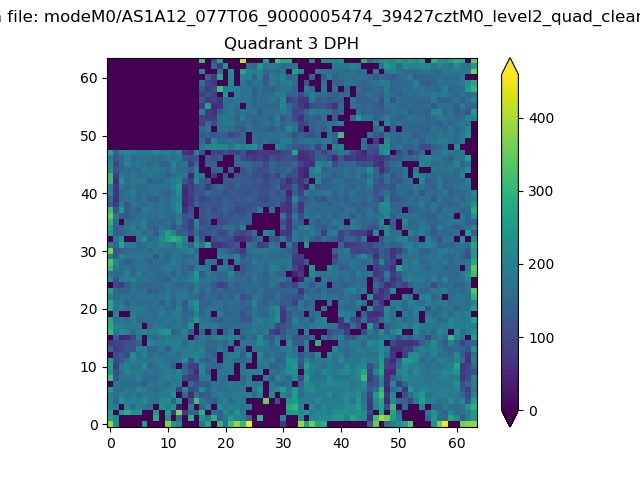 |
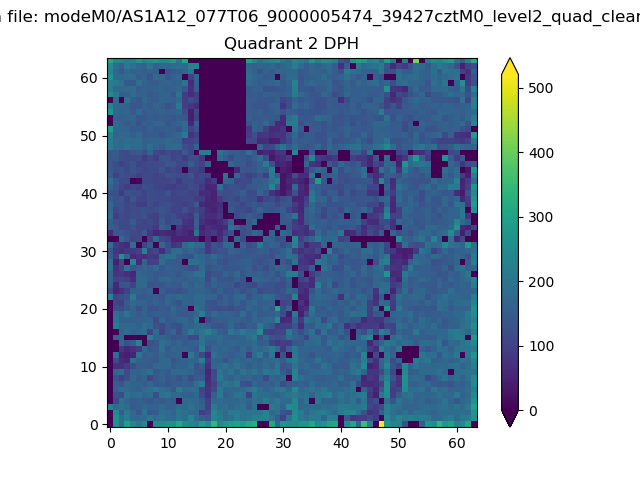 |
Quadrant C |
| Plot type | Count rate plots | Images |
|---|---|---|
| Comparison with Poisson distribution Blue bars denote a histogram of data divided into 1 sec bins. Red curve is a Poisson curve with rate = median count rate of data. |
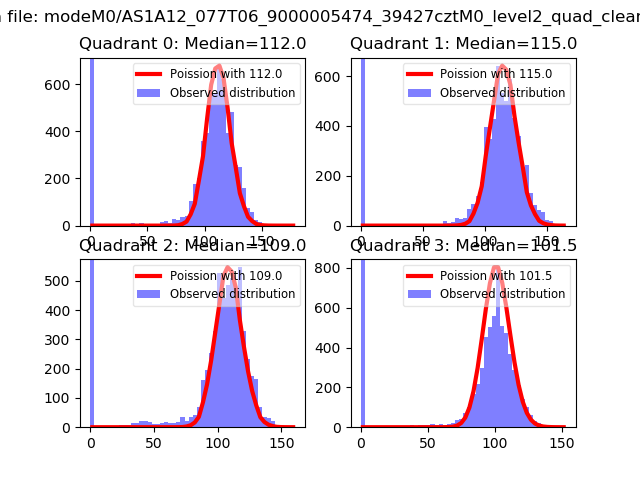 |
 |
| Quadrant-wise count rates Data is divided into 100 sec bins |
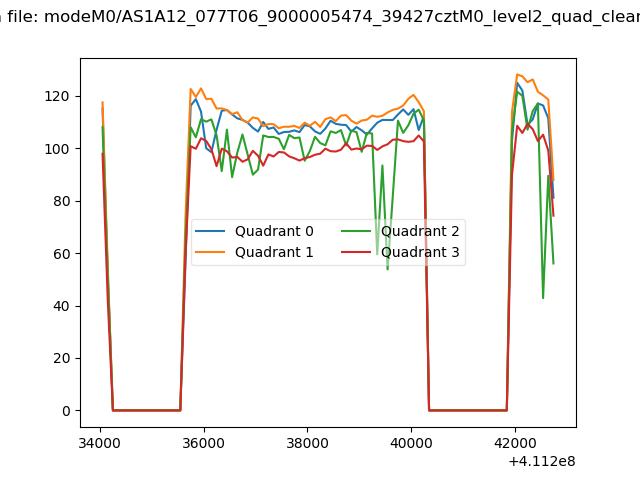 |
|
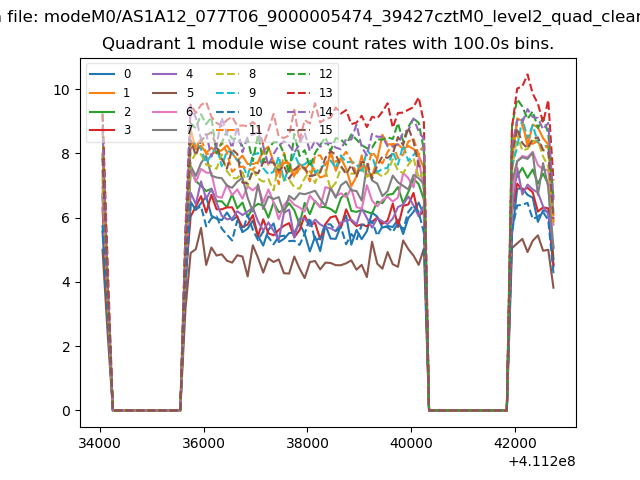
| Module-wise count rates for Quadrant A Data is divided into 100 sec bins |
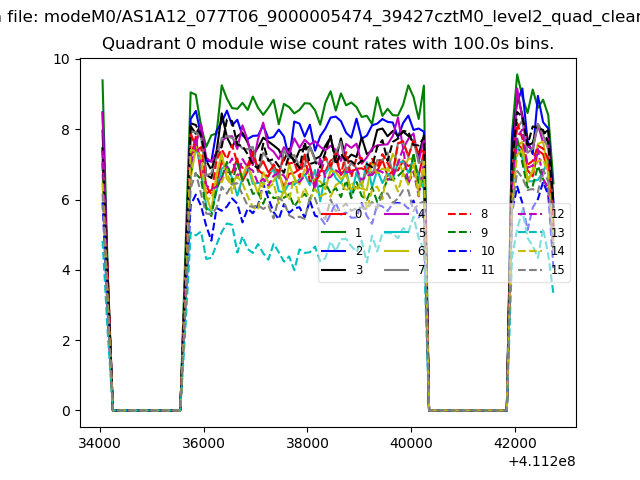 |
 |
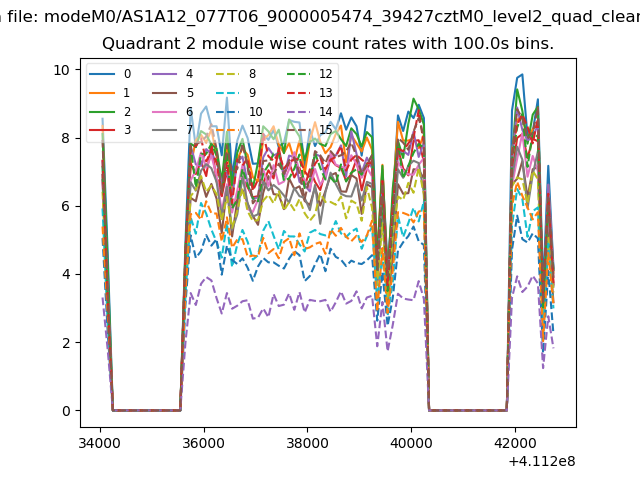
| Module-wise count rates for Quadrant B Data is divided into 100 sec bins |
 |
 |
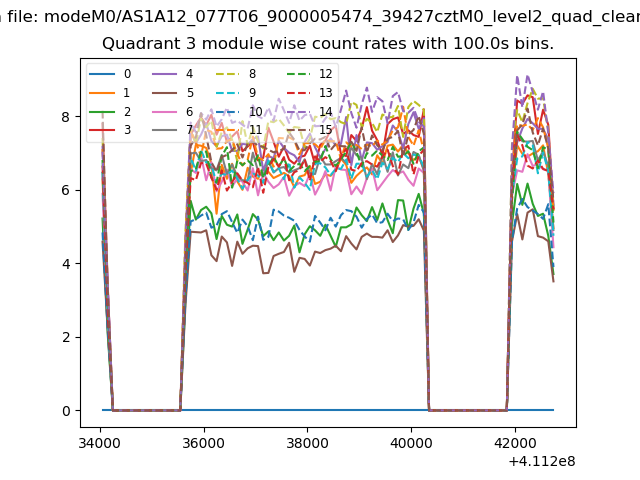
| Module-wise count rates for Quadrant C Data is divided into 100 sec bins |
 |
 |
| Module-wise count rates for Quadrant D Data is divided into 100 sec bins |
 |
 |
| Parameter | Plot |
|---|---|
| CZT HV Monitor |  |
| D_VDD | 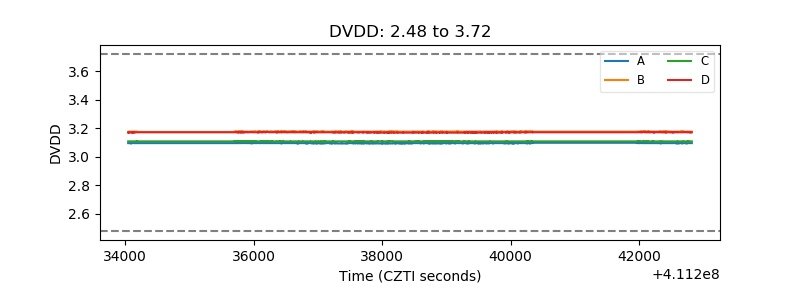 |
| Temperature 1 | 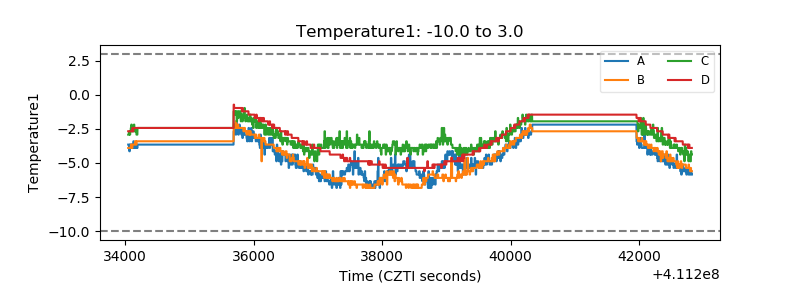 |
| Veto HV Monitor | 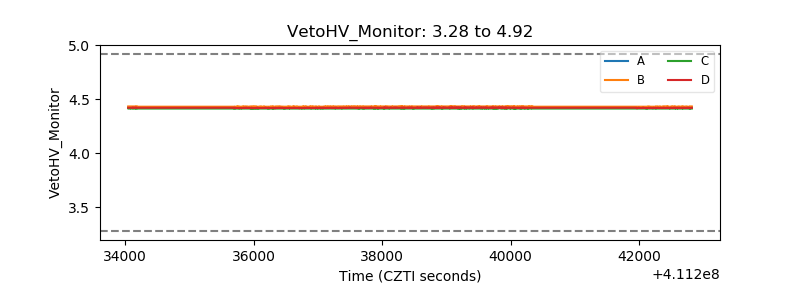 |
| Veto LLD | 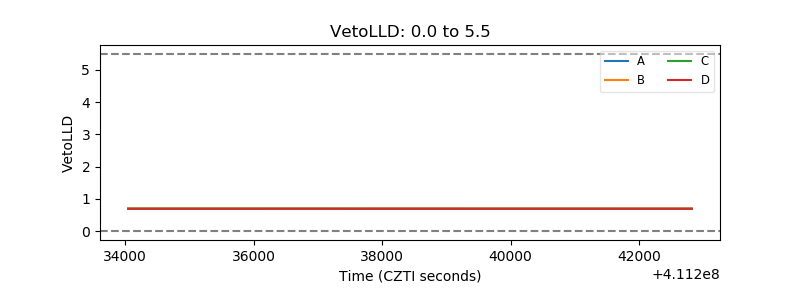 |
| Alpha Counter | 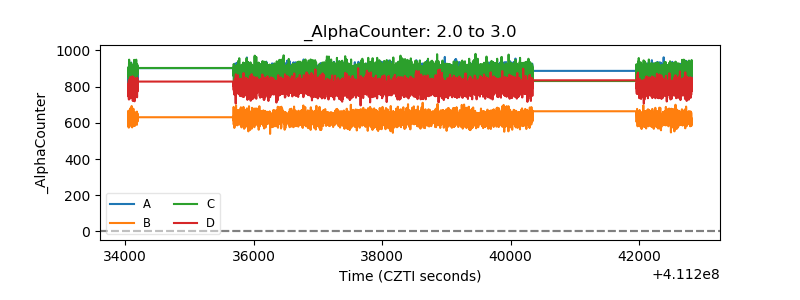 |
| _CPM_Rate | 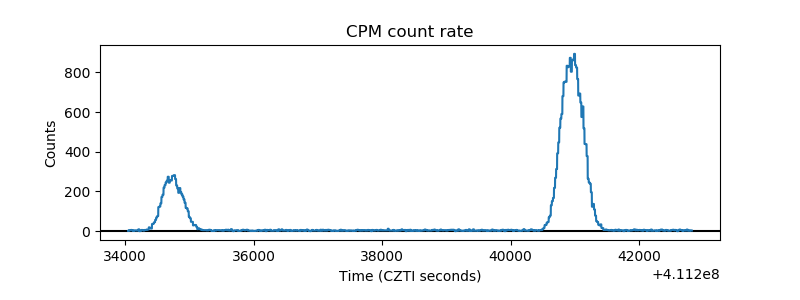 |
| CZT Counter | 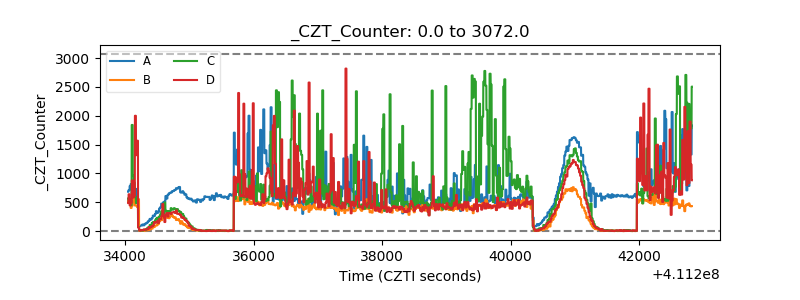 |
| +2.5 Volts monitor | 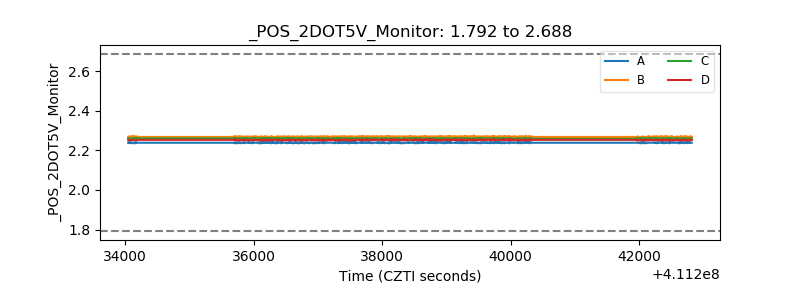 |
| +5 Volts monitor | 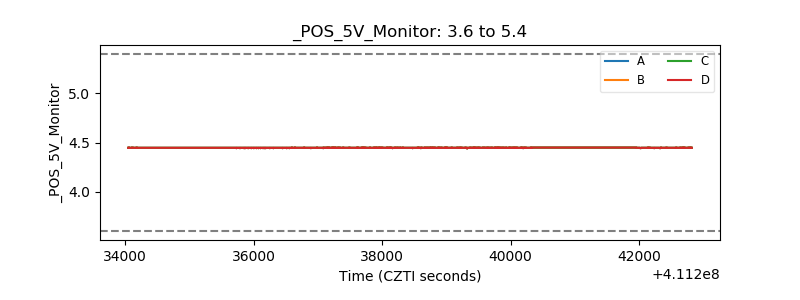 |
| _ROLL_ROT | 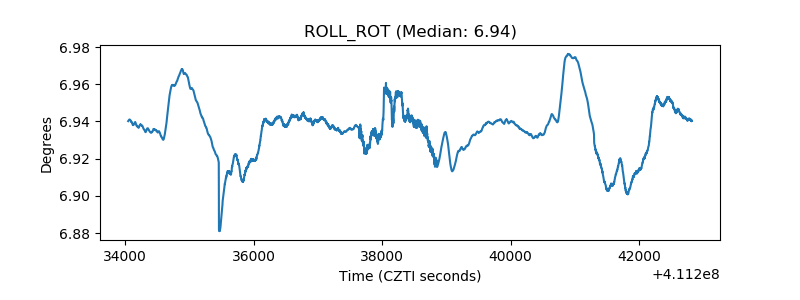 |
| _Roll_DEC | 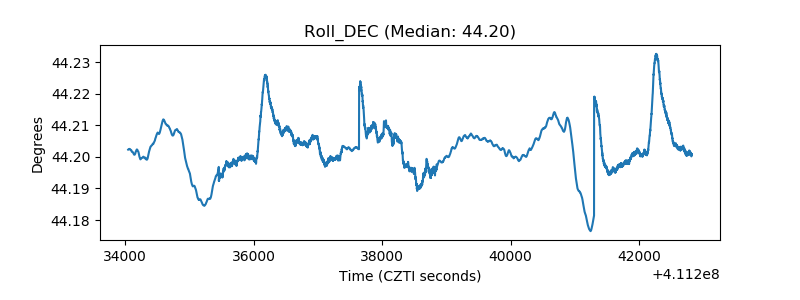 |
| _Roll_RA |  |
| Veto Counter | 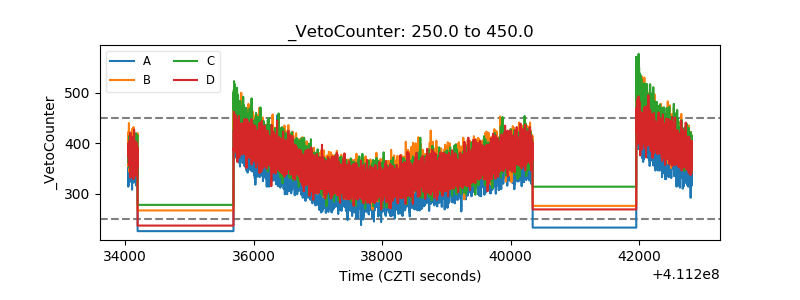 |