| Param | Original file | Final file |
|---|---|---|
| Filename | modeM0/AS1A12_077T06_9000005474_39430cztM0_level2.fits | modeM0/AS1A12_077T06_9000005474_39430cztM0_level2_quad_clean.evt |
| Size (bytes) | 439,076,160 | 89,072,640 |
| Size | 418.7 MB | 84.9 MB |
| Events in quadrant A | 4,619,123 | 607,189 |
| Events in quadrant B | 2,508,011 | 641,300 |
| Events in quadrant C | 4,400,021 | 571,784 |
| Events in quadrant D | 4,318,354 | 509,440 |
| Mode M0 | |||
|---|---|---|---|
| Quadrant | BADHDUFLAG | Total packets | Discarded packets |
| A | 0 | 17362 | 3 |
| B | 0 | 11088 | 2 |
| C | 0 | 16569 | 2 |
| D | 0 | 16552 | 2 |
| Mode SS | |||
|---|---|---|---|
| Quadrant | BADHDUFLAG | Total packets | Discarded packets |
| A | 0 | 106 | 0 |
| B | 0 | 106 | 0 |
| C | 0 | 106 | 0 |
| D | 0 | 106 | 0 |
| Mode M9 | |||
|---|---|---|---|
| Quadrant | BADHDUFLAG | Total packets | Discarded packets |
| A | 0 | 24 | 0 |
| B | 0 | 24 | 0 |
| C | 0 | 24 | 0 |
| D | 0 | 25 | 0 |
| Quadrant | Total seconds | Saturated seconds | Saturation percentage |
|---|---|---|---|
| A | 5247 | 215 | 4.097580% |
| B | 5247 | 44 | 0.838574% |
| C | 5247 | 444 | 8.461978% |
| D | 5247 | 541 | 10.310654% |
Noise dominated data is calculated using 1-second bins in cleaned event files. If a bin has >2000 counts, and if more than 50% of those come from <1% of pixels, then it is considered to be noise-dominated and hence unusable.
| Quadrant | # 1 sec bins | Bins with >0 counts | Bins with >2000 counts | High rate bins dominated by noise | Noise dominated (total time) | Noise dominated (detector-on time) | Marked lightcurve |
|---|---|---|---|---|---|---|---|
| A | 7130 | 5248 | 133 | 133 | 1.87% | 2.53% | 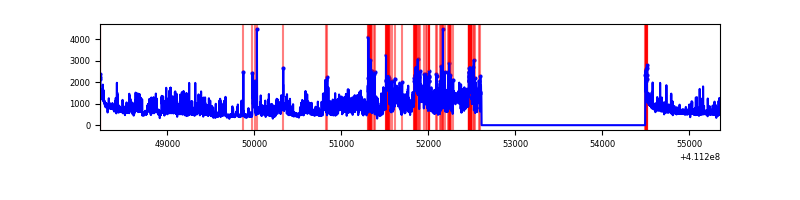 |
| B | 7130 | 5248 | 25 | 25 | 0.35% | 0.48% | 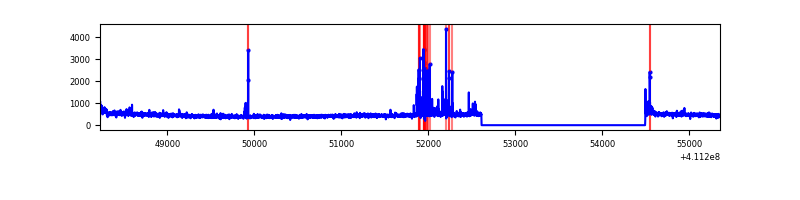 |
| C | 7130 | 5248 | 396 | 396 | 5.55% | 7.55% | 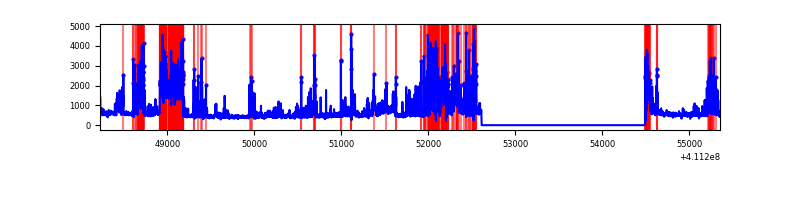 |
| D | 7130 | 5248 | 464 | 464 | 6.51% | 8.84% | 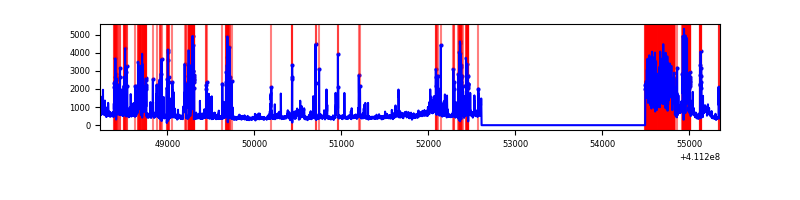 |
Top three noisy pixels from each quadrant. If the there are fewer than three noisy pixels in the level2.evt file, extra rows are filled as -1
| Pixel properties | Quadrant properties | ||||||
|---|---|---|---|---|---|---|---|
| Quadrant | DetID | PixID | Counts | Sigma | Mean | Median | Sigma |
| A | 15 | 222 | 1852266 | 15718.49 | 581 | 571 | 117.8 |
| A | 10 | 83 | 430158 | 3646.64 | 581 | 571 | 117.8 |
| A | 2 | 79 | 51887 | 435.61 | 581 | 571 | 117.8 |
| B | 8 | 3 | 112077 | 989.8 | 589 | 573 | 112.7 |
| B | 5 | 172 | 54117 | 475.3 | 589 | 573 | 112.7 |
| B | 5 | 255 | 17123 | 146.91 | 589 | 573 | 112.7 |
| C | 15 | 208 | 1782694 | 13615.7 | 560 | 565 | 130.9 |
| C | 15 | 214 | 215416 | 1641.49 | 560 | 565 | 130.9 |
| C | 9 | 187 | 122150 | 928.93 | 560 | 565 | 130.9 |
| D | 12 | 227 | 1046762 | 7892.99 | 546 | 529 | 132.6 |
| D | 13 | 249 | 581187 | 4380.6 | 546 | 529 | 132.6 |
| D | 2 | 153 | 314560 | 2369.11 | 546 | 529 | 132.6 |
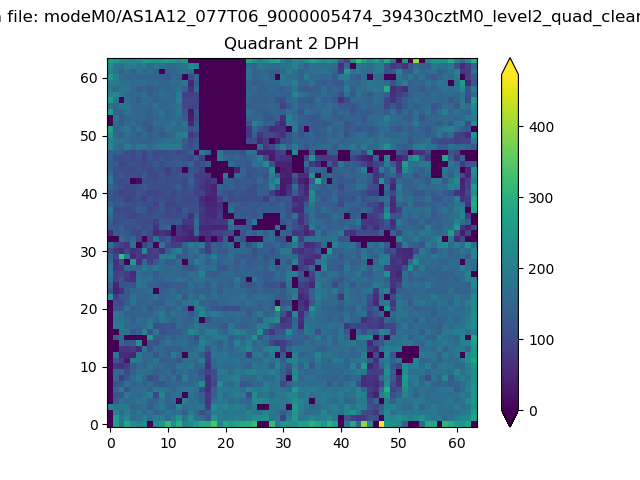
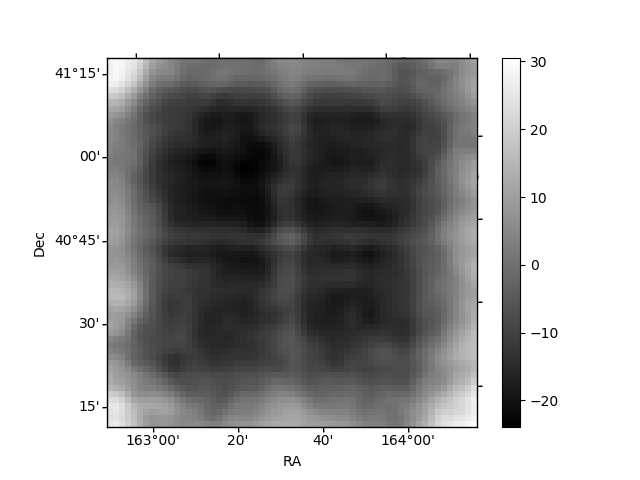
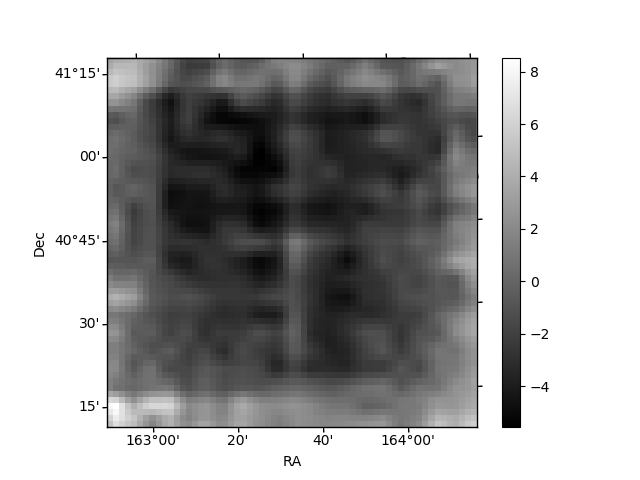
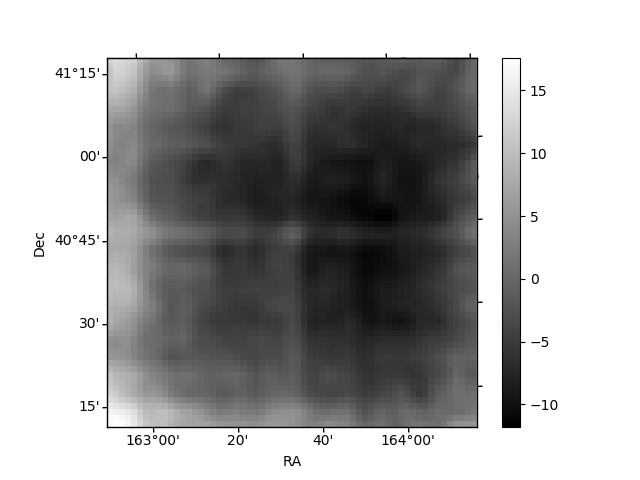
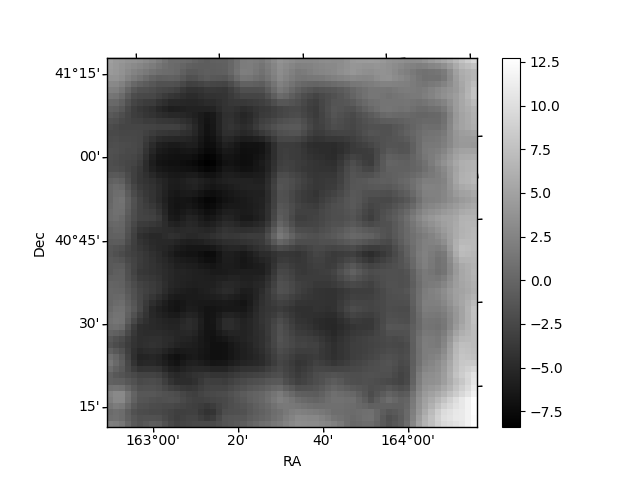
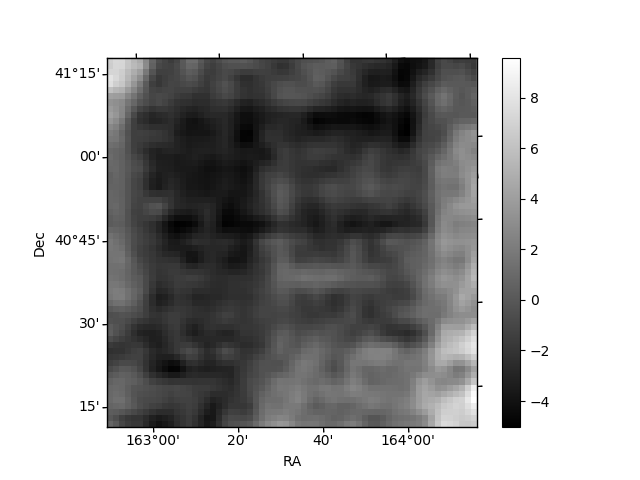
Histogram calculated using DETX and DETY for each event in the final _common_clean file
| Quadrant A | 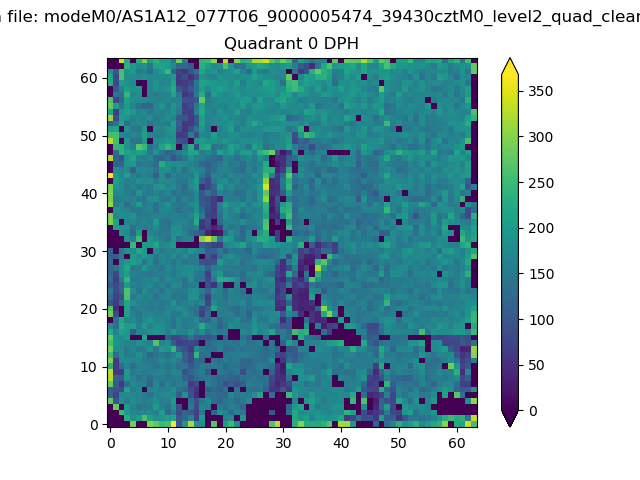 |
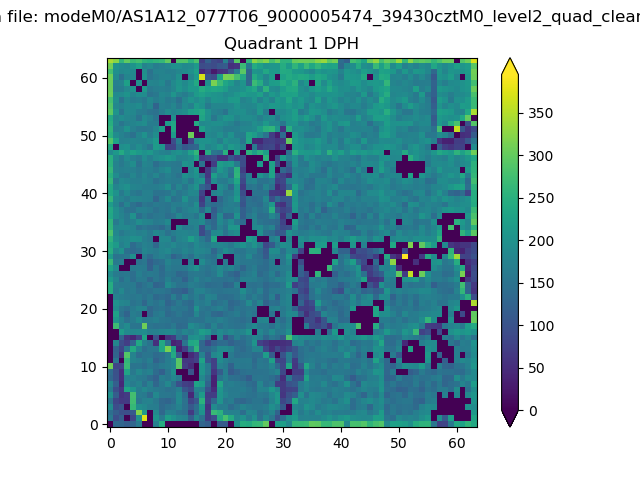 |
Quadrant B |
|---|---|---|---|
| Quadrant D | 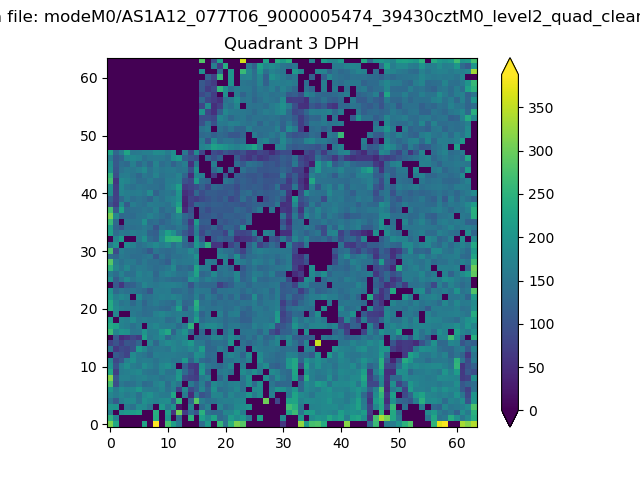 |
 |
Quadrant C |
| Plot type | Count rate plots | Images |
|---|---|---|
| Comparison with Poisson distribution Blue bars denote a histogram of data divided into 1 sec bins. Red curve is a Poisson curve with rate = median count rate of data. |
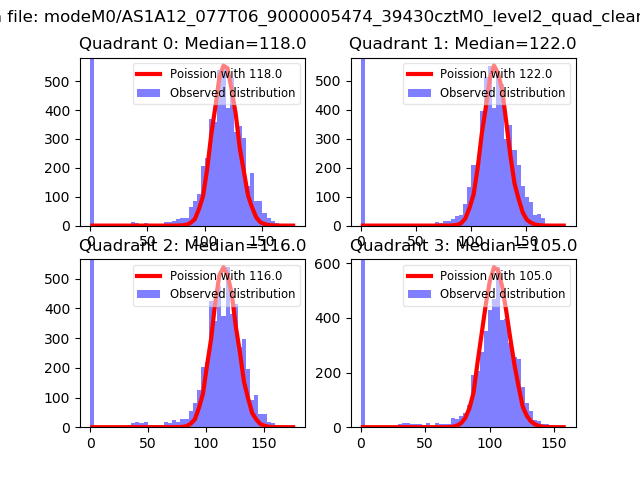 |
 |
| Quadrant-wise count rates Data is divided into 100 sec bins |
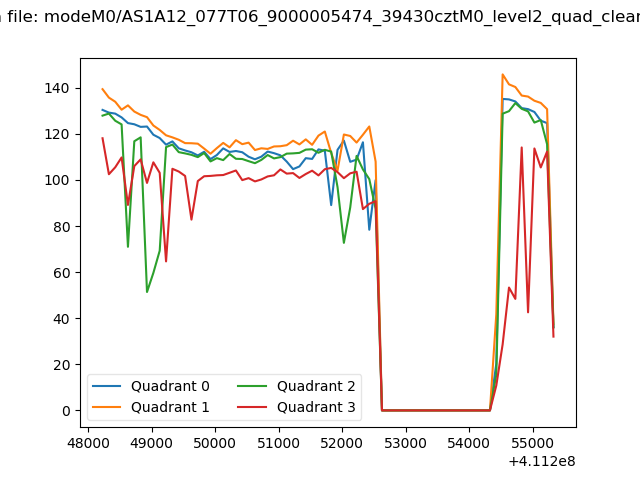 |
|
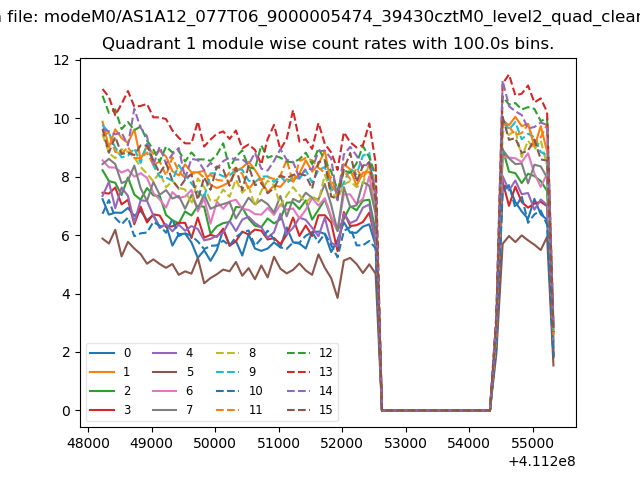
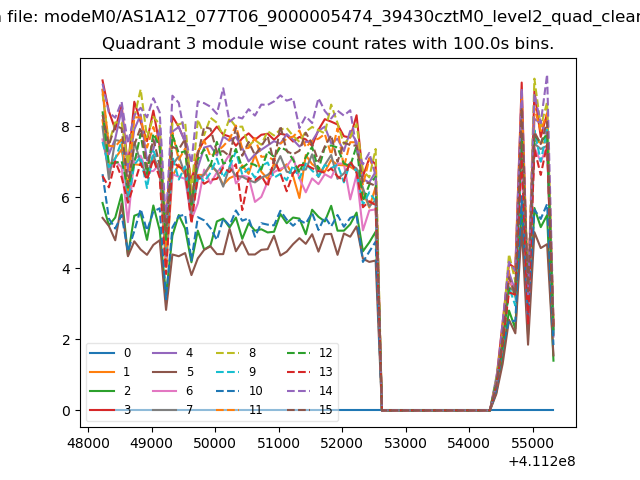
| Module-wise count rates for Quadrant A Data is divided into 100 sec bins |
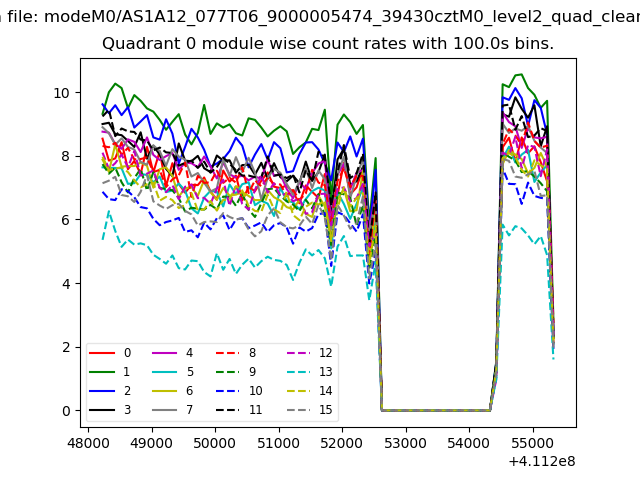 |
 |
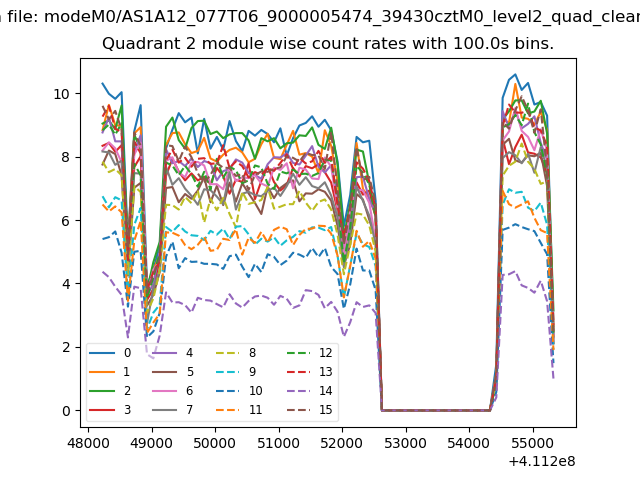
| Module-wise count rates for Quadrant B Data is divided into 100 sec bins |
 |
 |
| Module-wise count rates for Quadrant C Data is divided into 100 sec bins |
 |
 |
| Module-wise count rates for Quadrant D Data is divided into 100 sec bins |
 |
 |
| Parameter | Plot |
|---|---|
| CZT HV Monitor | 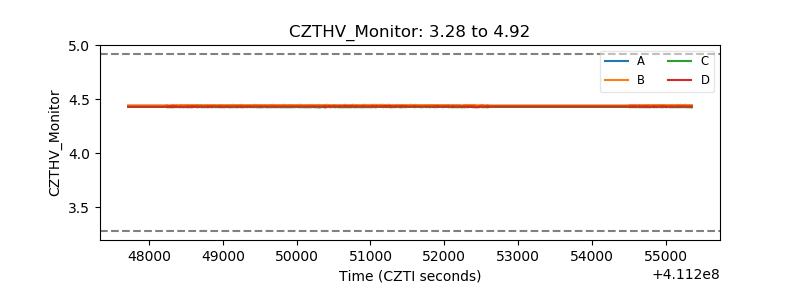 |
| D_VDD | 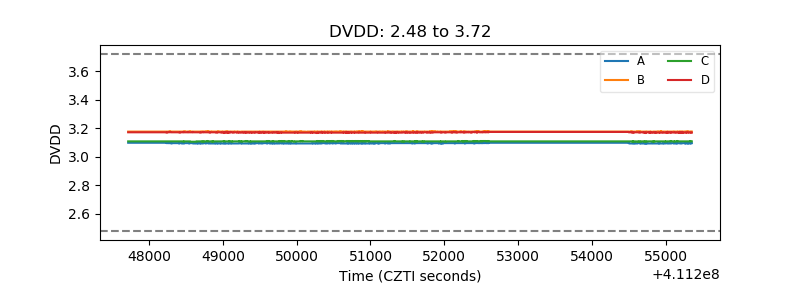 |
| Temperature 1 | 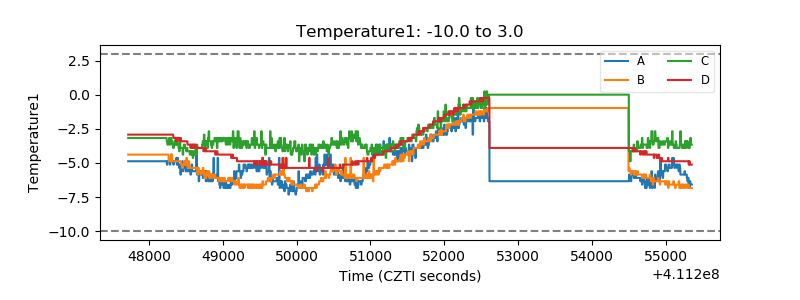 |
| Veto HV Monitor |  |
| Veto LLD |  |
| Alpha Counter | 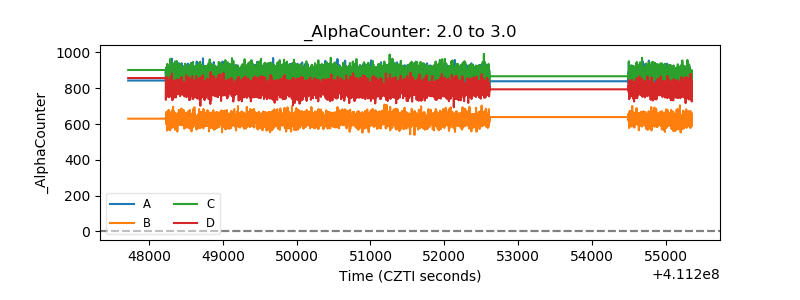 |
| _CPM_Rate | 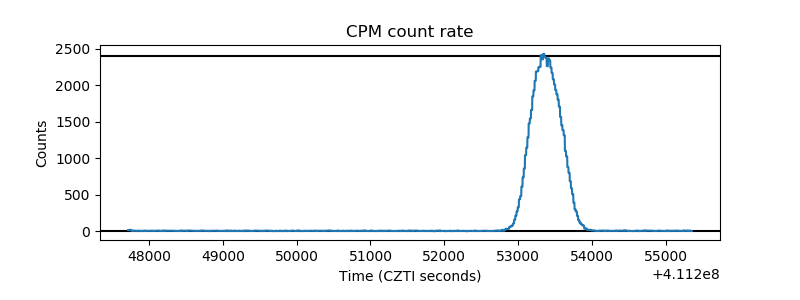 |
| CZT Counter | 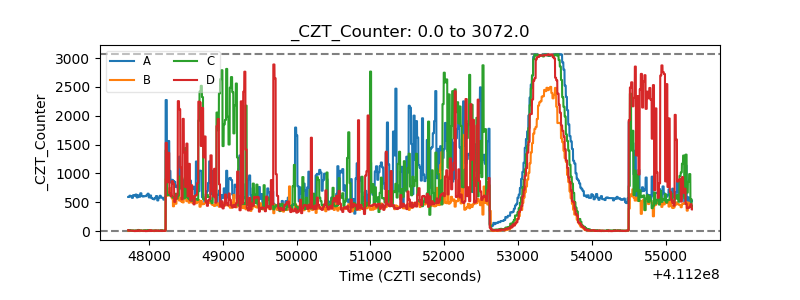 |
| +2.5 Volts monitor | 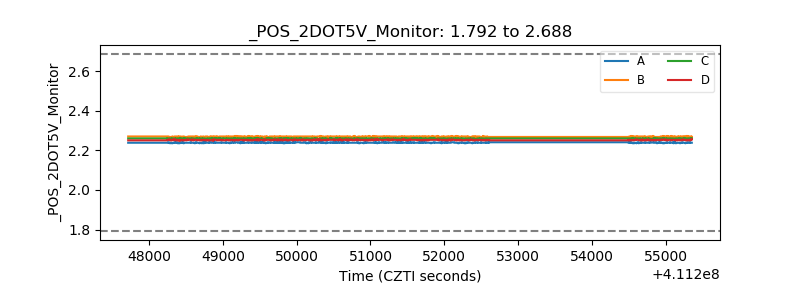 |
| +5 Volts monitor | 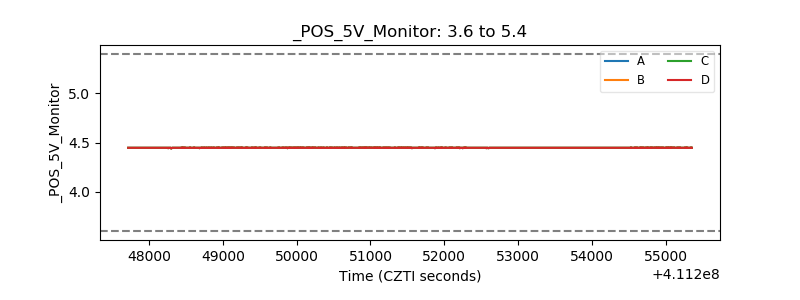 |
| _ROLL_ROT | 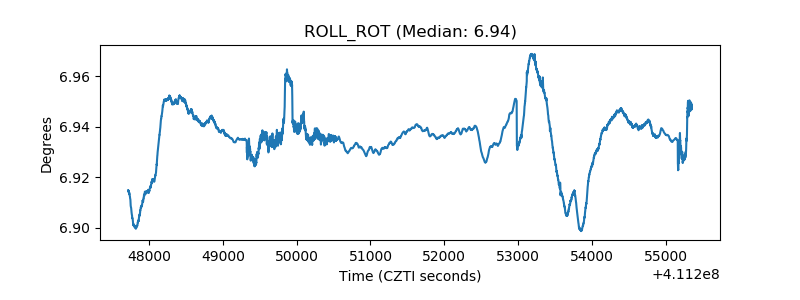 |
| _Roll_DEC | 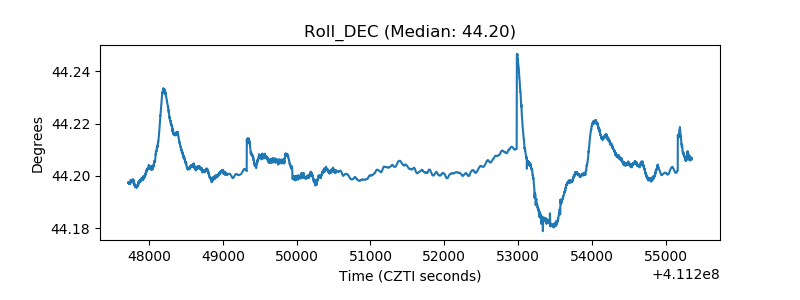 |
| _Roll_RA | 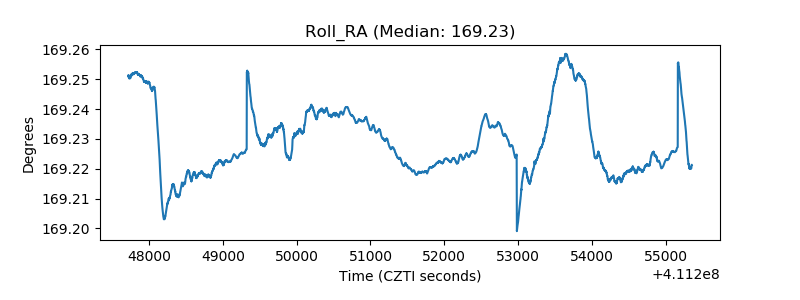 |
| Veto Counter | 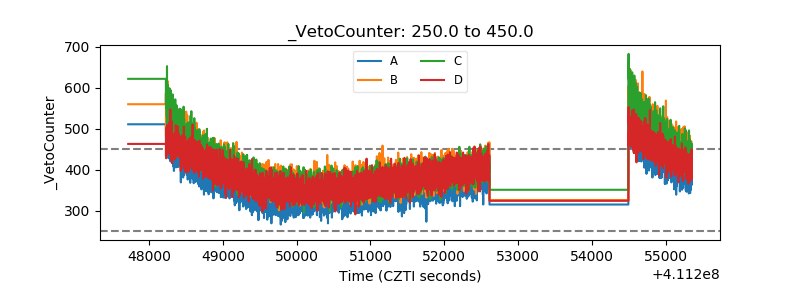 |