| Param | Original file | Final file |
|---|---|---|
| Filename | modeM0/AS1A12_077T06_9000005474_39431cztM0_level2.fits | modeM0/AS1A12_077T06_9000005474_39431cztM0_level2_quad_clean.evt |
| Size (bytes) | 425,816,640 | 89,352,000 |
| Size | 406.1 MB | 85.2 MB |
| Events in quadrant A | 4,773,914 | 595,867 |
| Events in quadrant B | 2,532,425 | 648,333 |
| Events in quadrant C | 4,065,378 | 591,308 |
| Events in quadrant D | 3,993,658 | 512,010 |
| Mode M0 | |||
|---|---|---|---|
| Quadrant | BADHDUFLAG | Total packets | Discarded packets |
| A | 0 | 17699 | 3 |
| B | 0 | 10923 | 2 |
| C | 0 | 15539 | 2 |
| D | 0 | 15383 | 2 |
| Mode SS | |||
|---|---|---|---|
| Quadrant | BADHDUFLAG | Total packets | Discarded packets |
| A | 0 | 104 | 0 |
| B | 0 | 104 | 0 |
| C | 0 | 104 | 0 |
| D | 0 | 104 | 0 |
| Mode M9 | |||
|---|---|---|---|
| Quadrant | BADHDUFLAG | Total packets | Discarded packets |
| A | 0 | 27 | 0 |
| B | 0 | 27 | 0 |
| C | 0 | 27 | 0 |
| D | 0 | 28 | 0 |
| Quadrant | Total seconds | Saturated seconds | Saturation percentage |
|---|---|---|---|
| A | 5113 | 286 | 5.593585% |
| B | 5113 | 28 | 0.547624% |
| C | 5113 | 276 | 5.398005% |
| D | 5113 | 474 | 9.270487% |
Noise dominated data is calculated using 1-second bins in cleaned event files. If a bin has >2000 counts, and if more than 50% of those come from <1% of pixels, then it is considered to be noise-dominated and hence unusable.
| Quadrant | # 1 sec bins | Bins with >0 counts | Bins with >2000 counts | High rate bins dominated by noise | Noise dominated (total time) | Noise dominated (detector-on time) | Marked lightcurve |
|---|---|---|---|---|---|---|---|
| A | 7086 | 5114 | 231 | 231 | 3.26% | 4.52% | 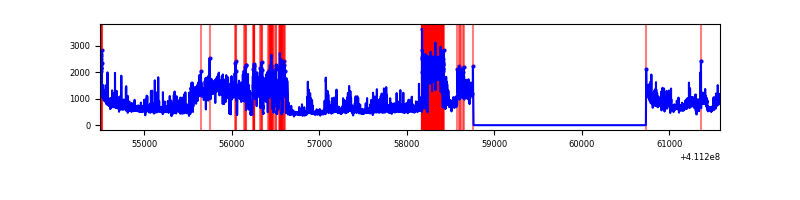 |
| B | 7086 | 5114 | 14 | 14 | 0.20% | 0.27% | 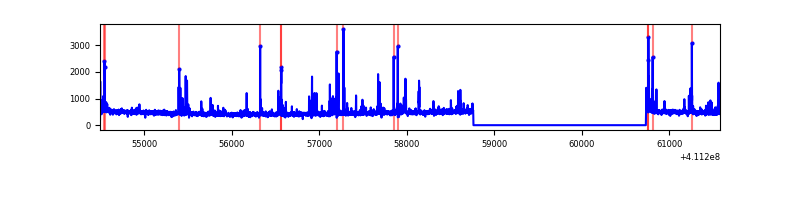 |
| C | 7086 | 5114 | 239 | 239 | 3.37% | 4.67% | 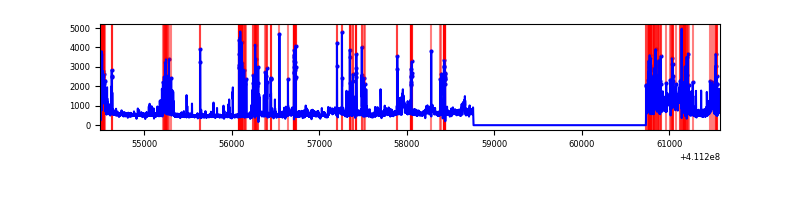 |
| D | 7086 | 5114 | 426 | 426 | 6.01% | 8.33% | 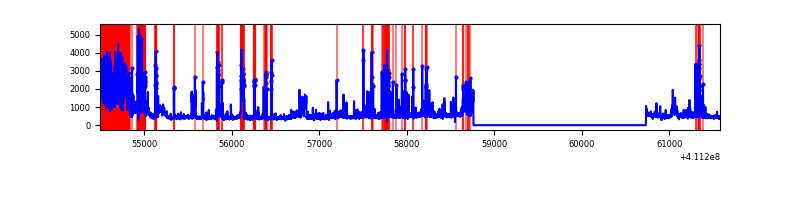 |
Top three noisy pixels from each quadrant. If the there are fewer than three noisy pixels in the level2.evt file, extra rows are filled as -1
| Pixel properties | Quadrant properties | ||||||
|---|---|---|---|---|---|---|---|
| Quadrant | DetID | PixID | Counts | Sigma | Mean | Median | Sigma |
| A | 15 | 222 | 2088626 | 18107.13 | 572 | 562 | 115.3 |
| A | 10 | 83 | 418497 | 3624.22 | 572 | 562 | 115.3 |
| A | 2 | 79 | 26935 | 228.7 | 572 | 562 | 115.3 |
| B | 8 | 3 | 188370 | 1678.06 | 583 | 567 | 111.9 |
| B | 5 | 255 | 29857 | 261.71 | 583 | 567 | 111.9 |
| B | 5 | 172 | 17750 | 153.53 | 583 | 567 | 111.9 |
| C | 15 | 208 | 1508716 | 11712.81 | 555 | 560 | 128.8 |
| C | 15 | 214 | 210392 | 1629.62 | 555 | 560 | 128.8 |
| C | 9 | 187 | 106466 | 822.5 | 555 | 560 | 128.8 |
| D | 12 | 227 | 1193052 | 9112.73 | 538 | 521 | 130.9 |
| D | 13 | 249 | 363703 | 2775.26 | 538 | 521 | 130.9 |
| D | 15 | 0 | 136431 | 1038.56 | 538 | 521 | 130.9 |
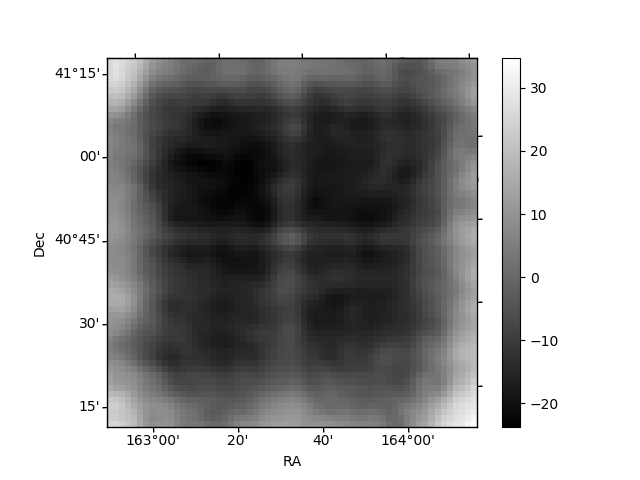
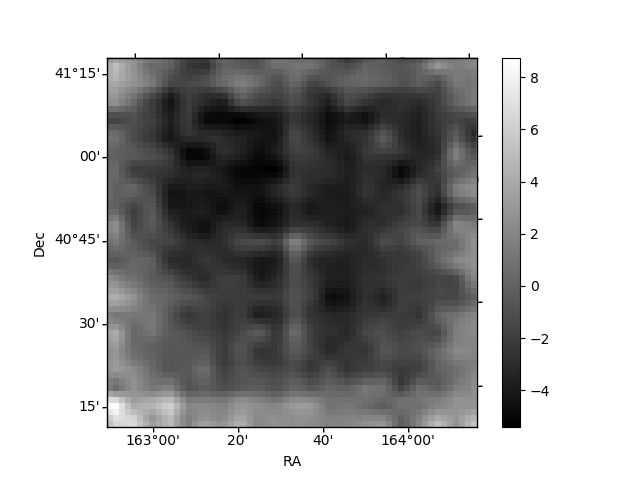
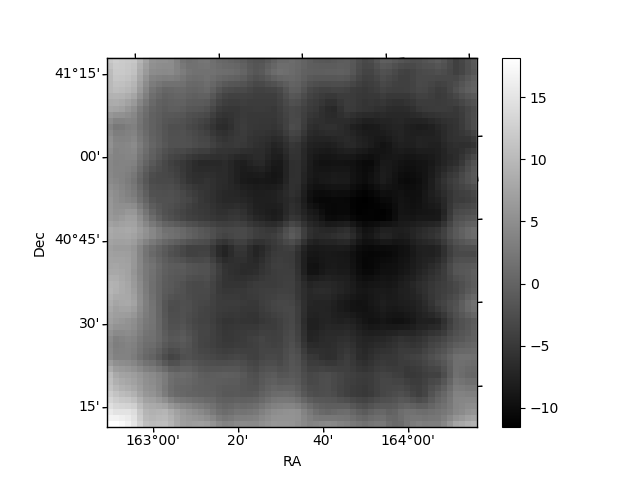
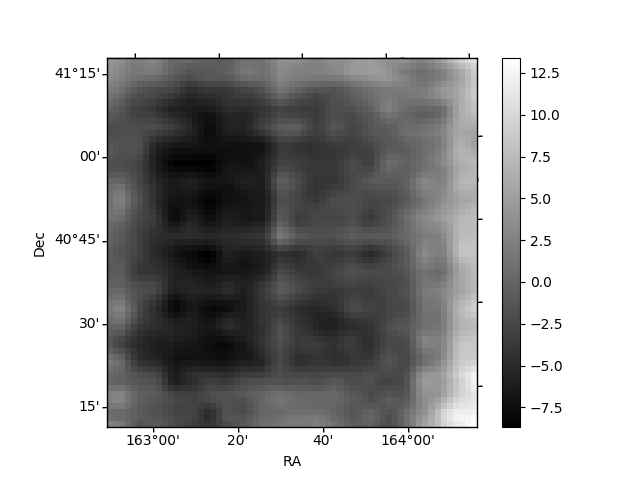
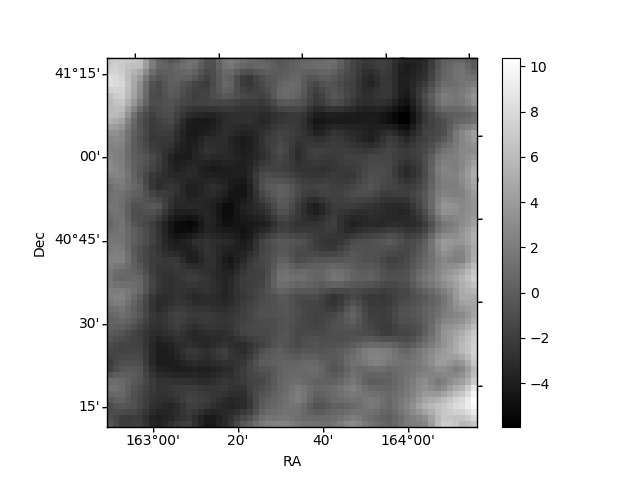
Histogram calculated using DETX and DETY for each event in the final _common_clean file
| Quadrant A | 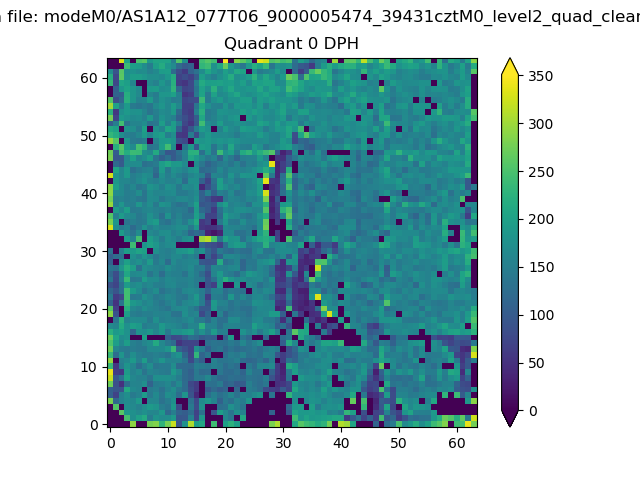 |
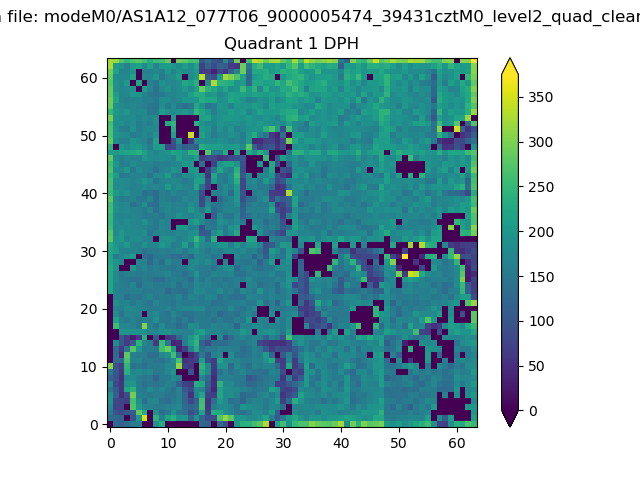 |
Quadrant B |
|---|---|---|---|
| Quadrant D | 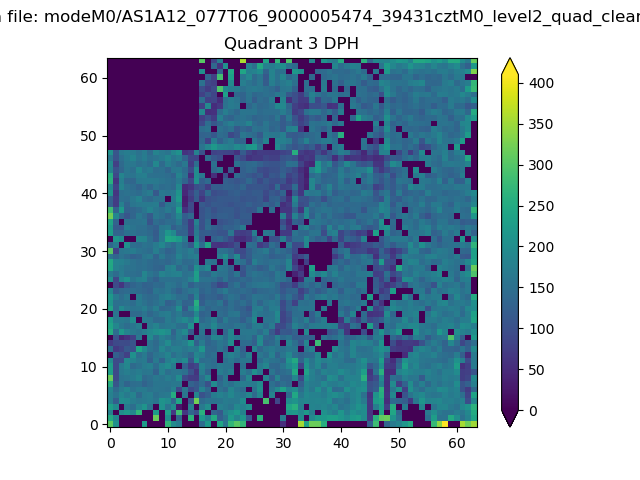 |
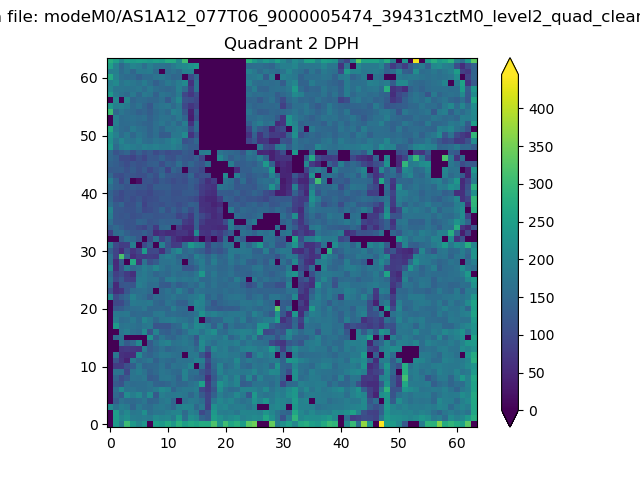 |
Quadrant C |
| Plot type | Count rate plots | Images |
|---|---|---|
| Comparison with Poisson distribution Blue bars denote a histogram of data divided into 1 sec bins. Red curve is a Poisson curve with rate = median count rate of data. |
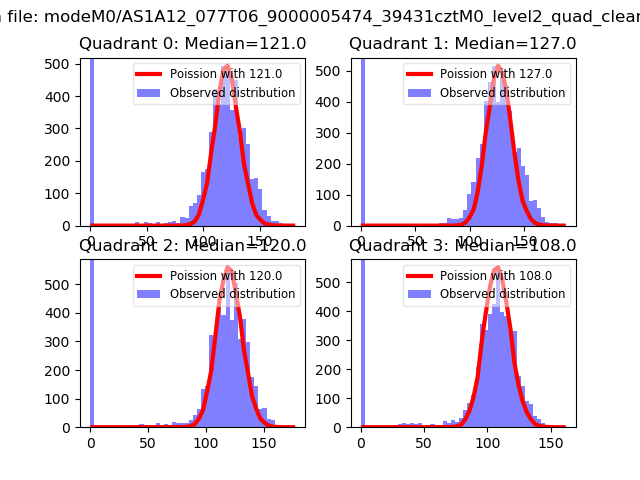 |
 |
| Quadrant-wise count rates Data is divided into 100 sec bins |
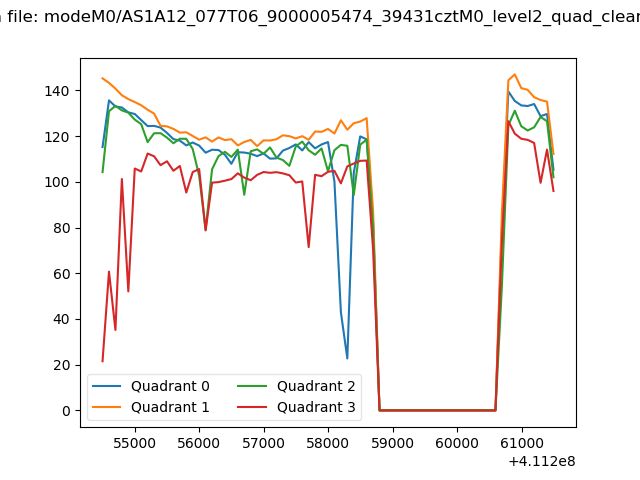 |
|
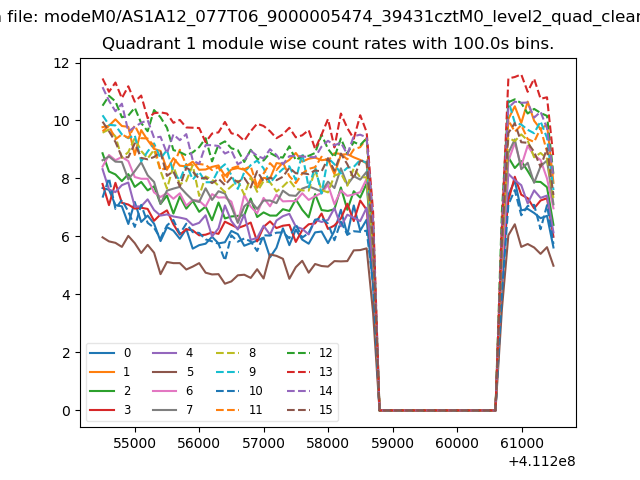
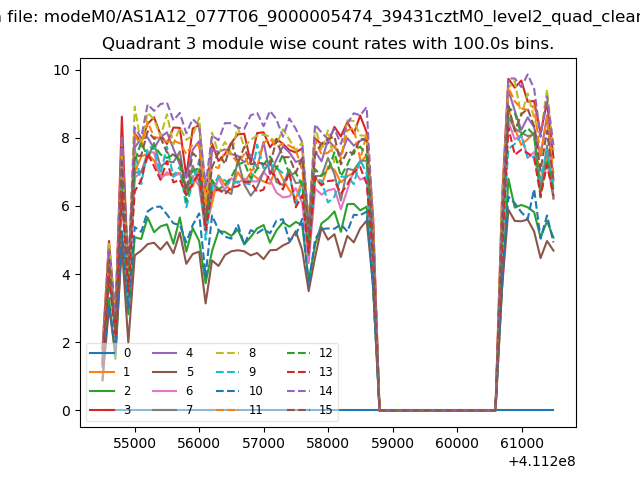
| Module-wise count rates for Quadrant A Data is divided into 100 sec bins |
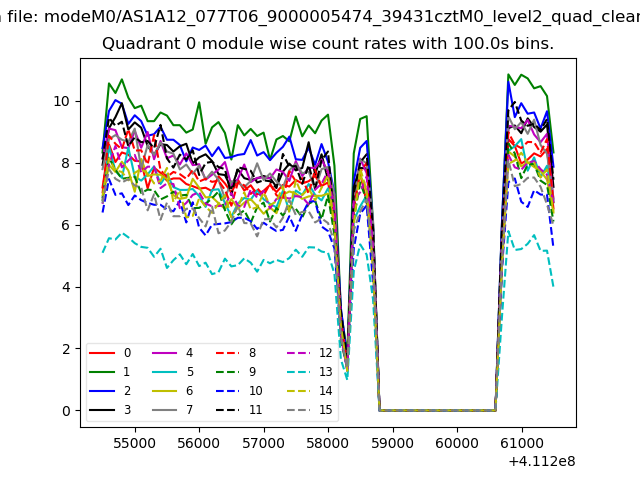 |
 |
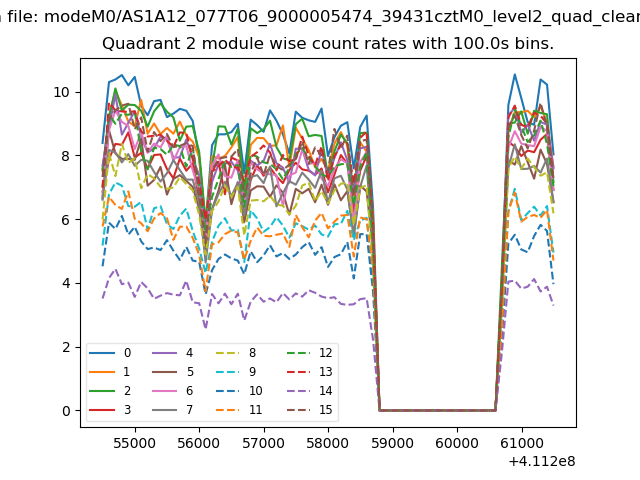
| Module-wise count rates for Quadrant B Data is divided into 100 sec bins |
 |
 |
| Module-wise count rates for Quadrant C Data is divided into 100 sec bins |
 |
 |
| Module-wise count rates for Quadrant D Data is divided into 100 sec bins |
 |
 |
| Parameter | Plot |
|---|---|
| CZT HV Monitor | 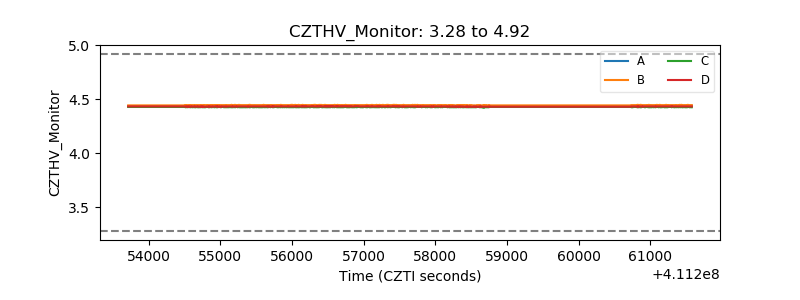 |
| D_VDD | 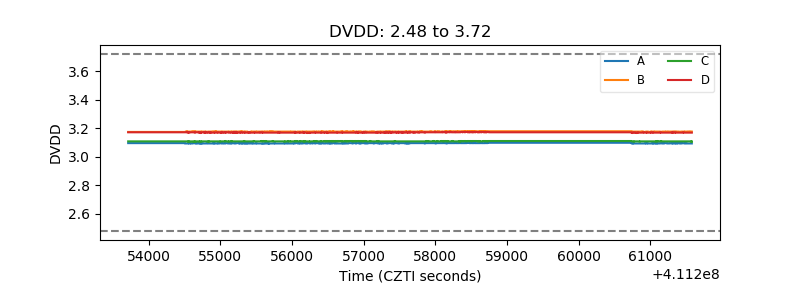 |
| Temperature 1 | 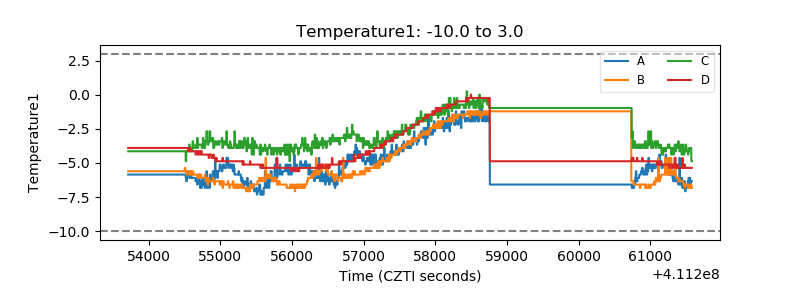 |
| Veto HV Monitor | 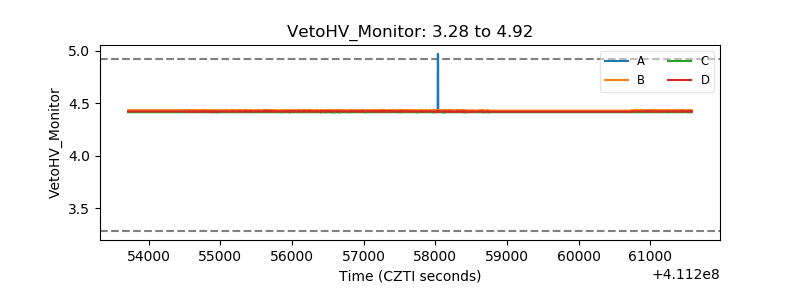 |
| Veto LLD |  |
| Alpha Counter | 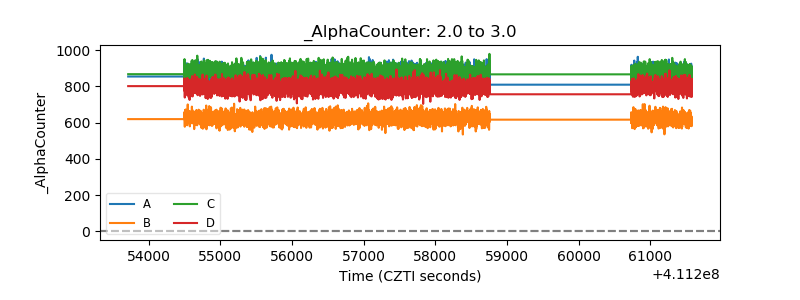 |
| _CPM_Rate | 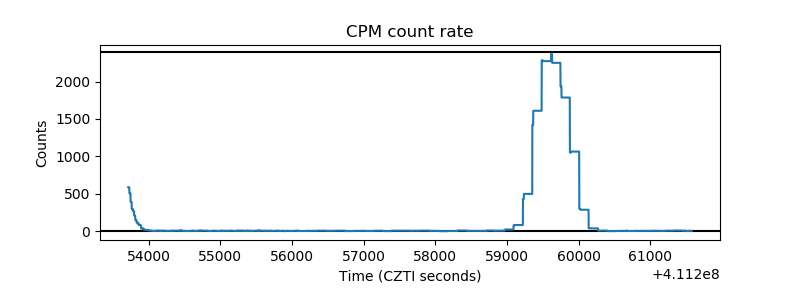 |
| CZT Counter | 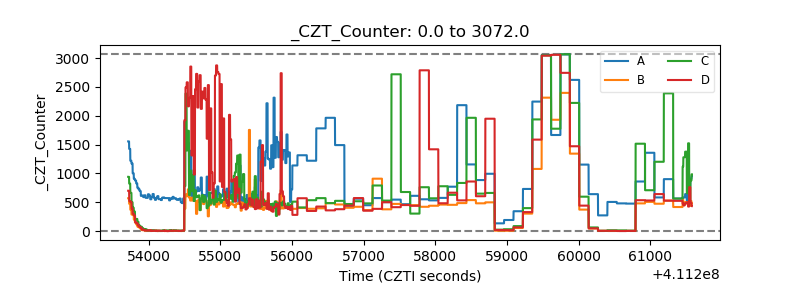 |
| +2.5 Volts monitor | 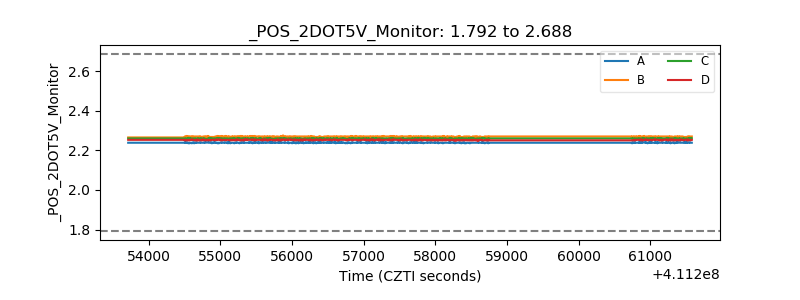 |
| +5 Volts monitor |  |
| _ROLL_ROT | 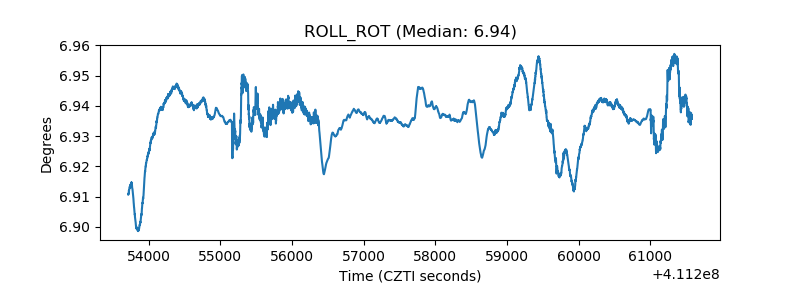 |
| _Roll_DEC | 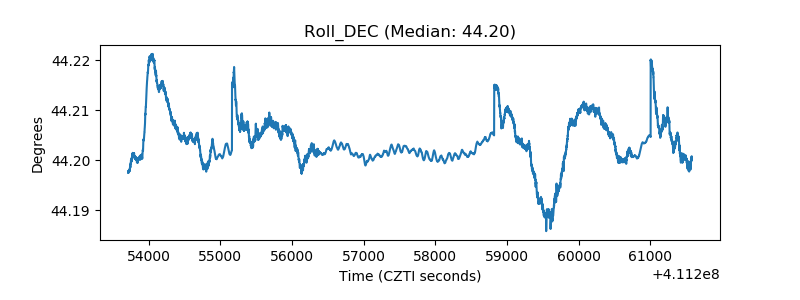 |
| _Roll_RA | 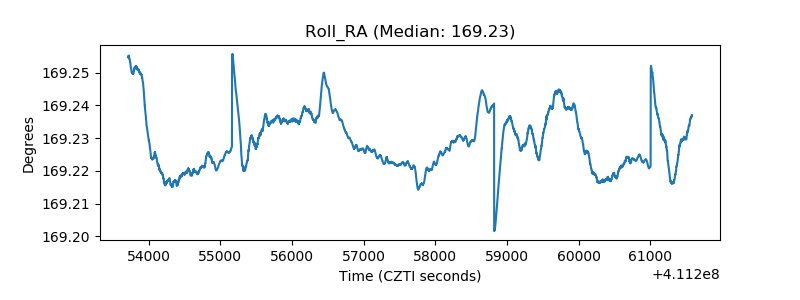 |
| Veto Counter | 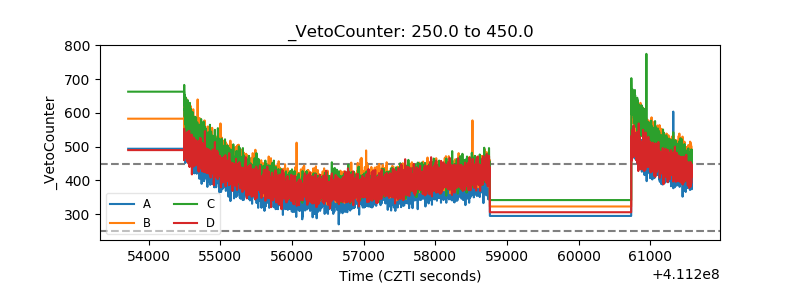 |