| Param | Original file | Final file |
|---|---|---|
| Filename | modeM0/AS1A12_077T06_9000005474_39432cztM0_level2.fits | modeM0/AS1A12_077T06_9000005474_39432cztM0_level2_quad_clean.evt |
| Size (bytes) | 424,681,920 | 96,024,960 |
| Size | 405.0 MB | 91.6 MB |
| Events in quadrant A | 5,230,197 | 623,142 |
| Events in quadrant B | 3,003,936 | 686,817 |
| Events in quadrant C | 4,170,534 | 628,460 |
| Events in quadrant D | 2,895,632 | 590,755 |
| Mode M0 | |||
|---|---|---|---|
| Quadrant | BADHDUFLAG | Total packets | Discarded packets |
| A | 0 | 19256 | 3 |
| B | 0 | 12530 | 2 |
| C | 0 | 15842 | 2 |
| D | 0 | 12416 | 2 |
| Mode SS | |||
|---|---|---|---|
| Quadrant | BADHDUFLAG | Total packets | Discarded packets |
| A | 0 | 110 | 0 |
| B | 0 | 110 | 0 |
| C | 0 | 110 | 0 |
| D | 0 | 110 | 0 |
| Mode M9 | |||
|---|---|---|---|
| Quadrant | BADHDUFLAG | Total packets | Discarded packets |
| A | 0 | 31 | 0 |
| B | 0 | 31 | 0 |
| C | 0 | 31 | 0 |
| D | 0 | 32 | 0 |
| Quadrant | Total seconds | Saturated seconds | Saturation percentage |
|---|---|---|---|
| A | 5407 | 437 | 8.082116% |
| B | 5407 | 88 | 1.627520% |
| C | 5407 | 306 | 5.659330% |
| D | 5407 | 58 | 1.072684% |
Noise dominated data is calculated using 1-second bins in cleaned event files. If a bin has >2000 counts, and if more than 50% of those come from <1% of pixels, then it is considered to be noise-dominated and hence unusable.
| Quadrant | # 1 sec bins | Bins with >0 counts | Bins with >2000 counts | High rate bins dominated by noise | Noise dominated (total time) | Noise dominated (detector-on time) | Marked lightcurve |
|---|---|---|---|---|---|---|---|
| A | 7468 | 5408 | 434 | 434 | 5.81% | 8.03% | 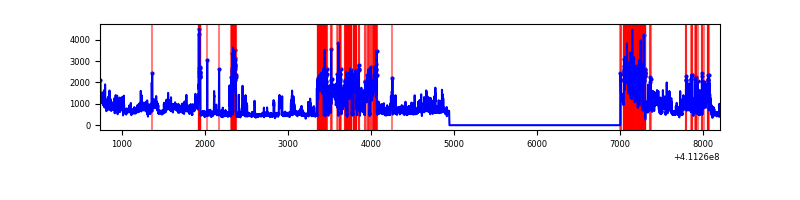 |
| B | 7468 | 5408 | 62 | 62 | 0.83% | 1.15% | 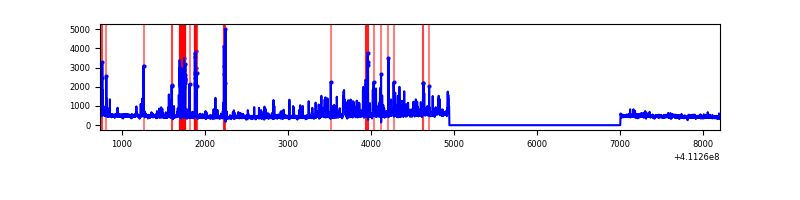 |
| C | 7468 | 5408 | 280 | 280 | 3.75% | 5.18% | 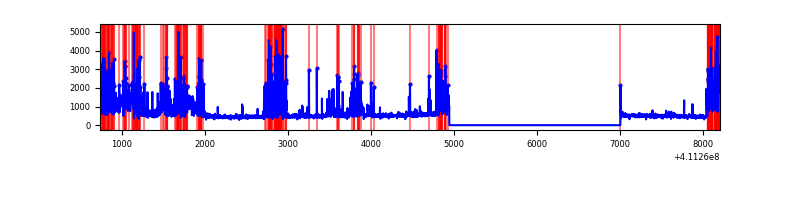 |
| D | 7468 | 5408 | 40 | 40 | 0.54% | 0.74% | 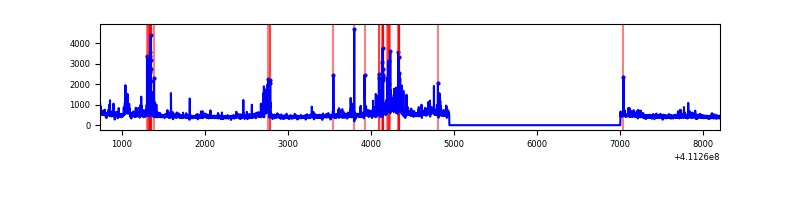 |
Top three noisy pixels from each quadrant. If the there are fewer than three noisy pixels in the level2.evt file, extra rows are filled as -1
| Pixel properties | Quadrant properties | ||||||
|---|---|---|---|---|---|---|---|
| Quadrant | DetID | PixID | Counts | Sigma | Mean | Median | Sigma |
| A | 15 | 222 | 2456641 | 20231.87 | 596 | 585 | 121.4 |
| A | 10 | 83 | 425837 | 3503.03 | 596 | 585 | 121.4 |
| A | 15 | 174 | 16608 | 131.99 | 596 | 585 | 121.4 |
| B | 8 | 3 | 360542 | 3068.96 | 616 | 600 | 117.3 |
| B | 5 | 172 | 200397 | 1703.52 | 616 | 600 | 117.3 |
| B | 5 | 255 | 17421 | 143.42 | 616 | 600 | 117.3 |
| C | 15 | 208 | 1544652 | 11316.14 | 588 | 592 | 136.4 |
| C | 15 | 214 | 224544 | 1641.3 | 588 | 592 | 136.4 |
| C | 14 | 254 | 63934 | 464.22 | 588 | 592 | 136.4 |
| D | 12 | 227 | 215413 | 1498.58 | 589 | 574 | 143.4 |
| D | 2 | 249 | 144913 | 1006.82 | 589 | 574 | 143.4 |
| D | 2 | 250 | 100010 | 693.6 | 589 | 574 | 143.4 |
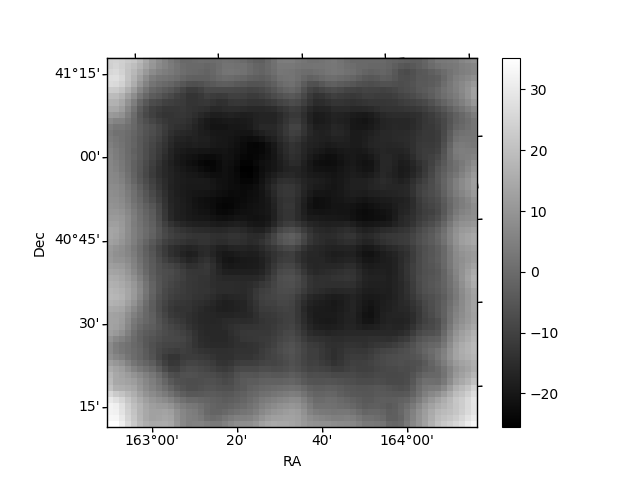
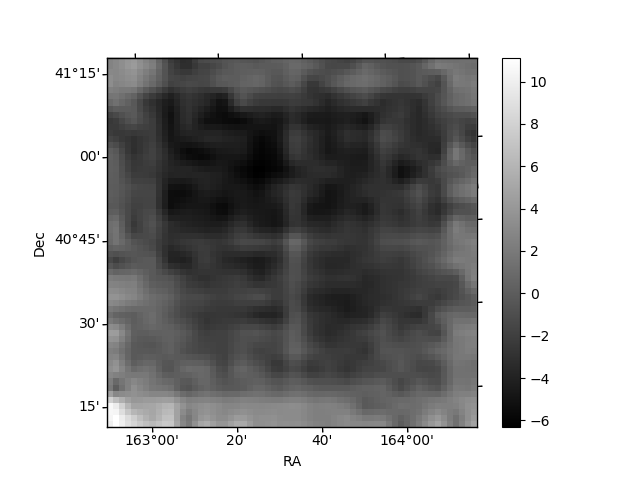
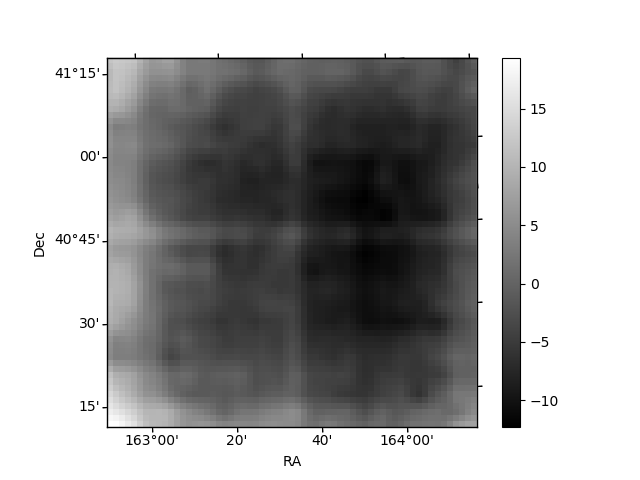
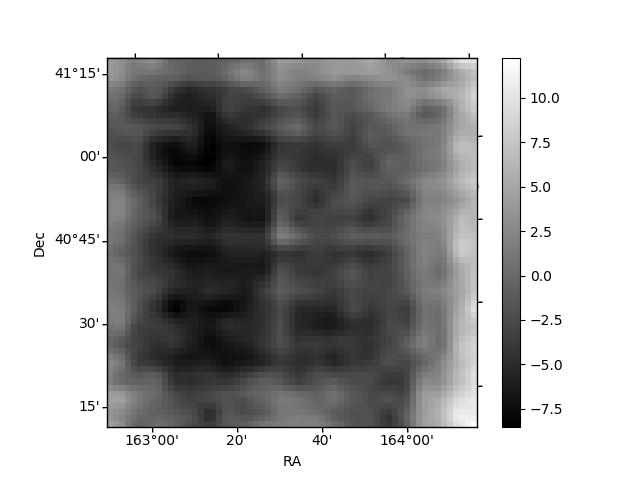
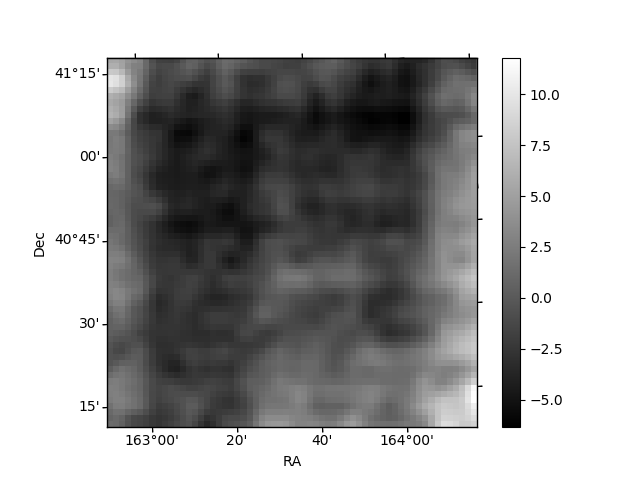
Histogram calculated using DETX and DETY for each event in the final _common_clean file
| Quadrant A | 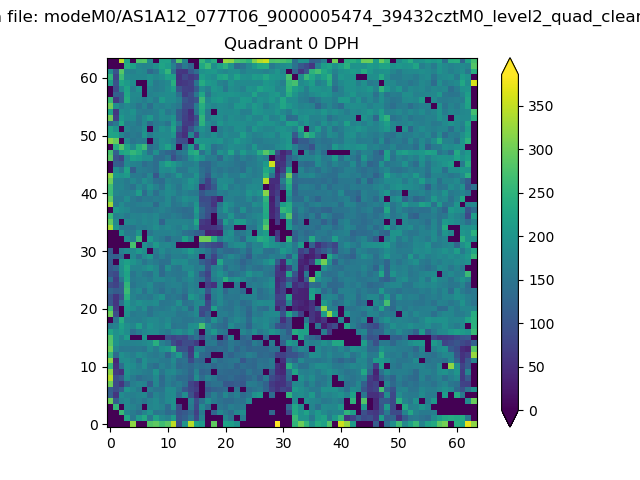 |
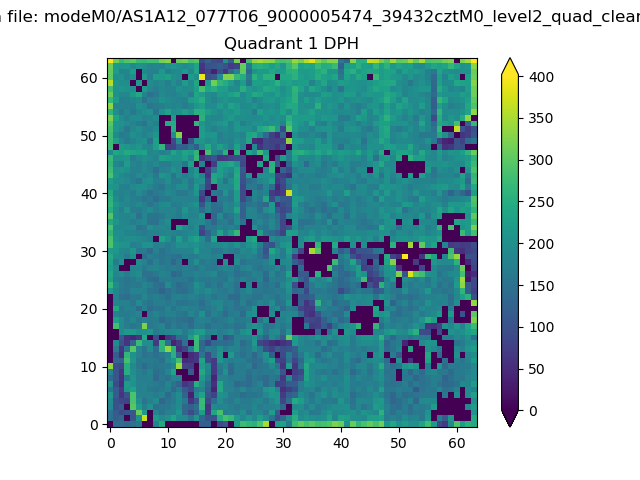 |
Quadrant B |
|---|---|---|---|
| Quadrant D | 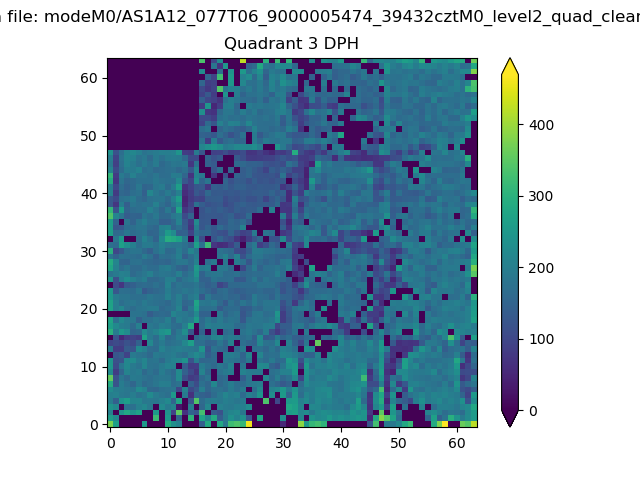 |
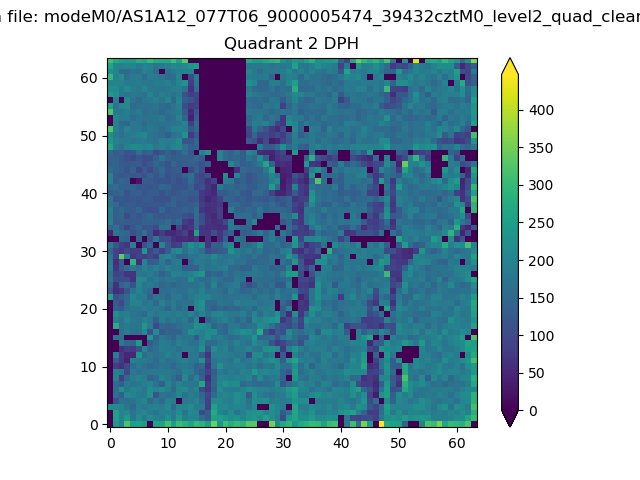 |
Quadrant C |
| Plot type | Count rate plots | Images |
|---|---|---|
| Comparison with Poisson distribution Blue bars denote a histogram of data divided into 1 sec bins. Red curve is a Poisson curve with rate = median count rate of data. |
 |
 |
| Quadrant-wise count rates Data is divided into 100 sec bins |
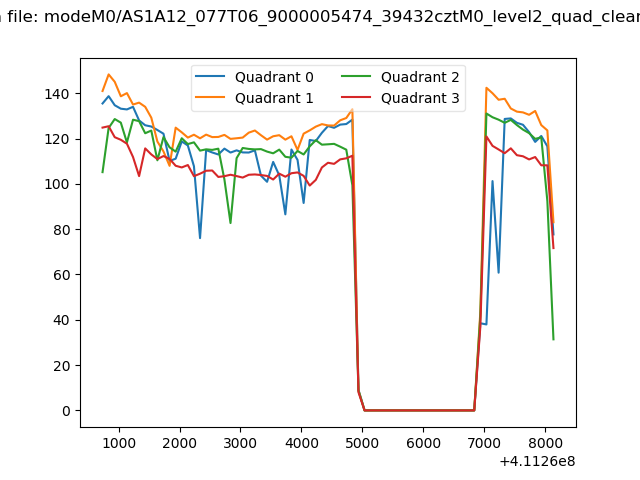 |
|
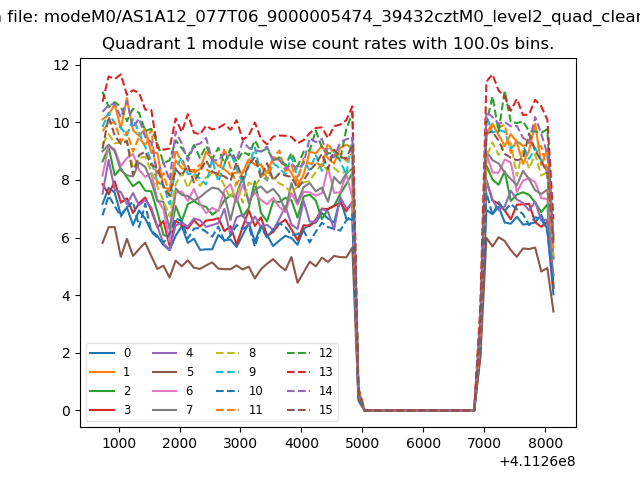
| Module-wise count rates for Quadrant A Data is divided into 100 sec bins |
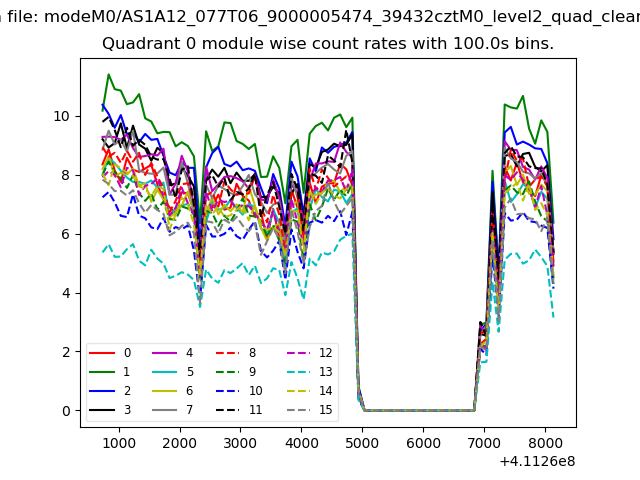 |
 |
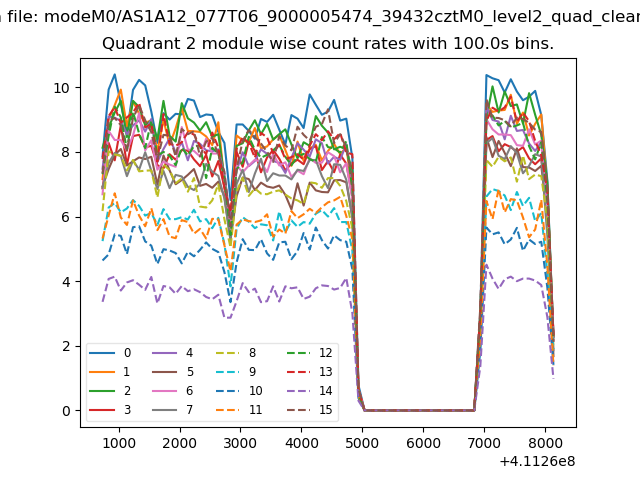
| Module-wise count rates for Quadrant B Data is divided into 100 sec bins |
 |
 |
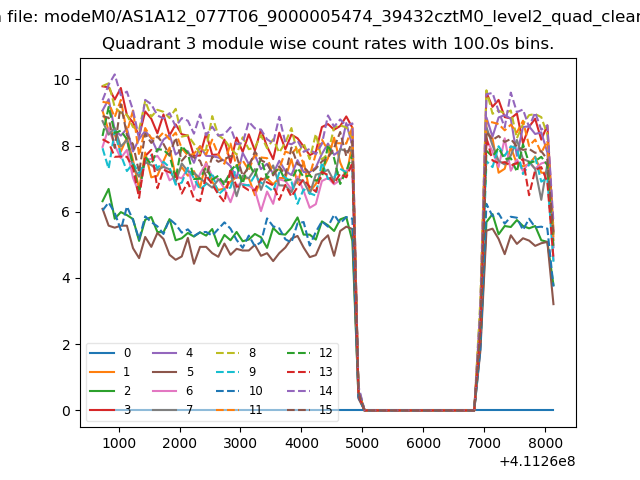
| Module-wise count rates for Quadrant C Data is divided into 100 sec bins |
 |
 |
| Module-wise count rates for Quadrant D Data is divided into 100 sec bins |
 |
 |
| Parameter | Plot |
|---|---|
| CZT HV Monitor | 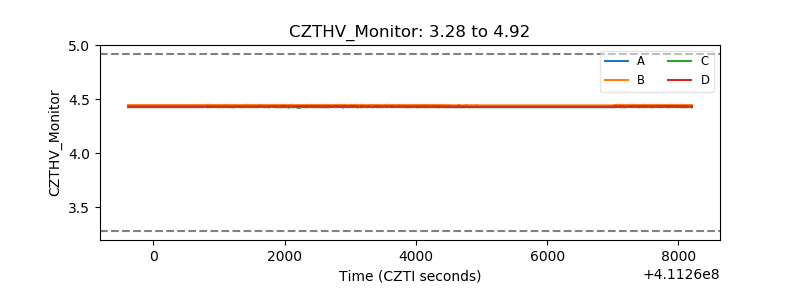 |
| D_VDD | 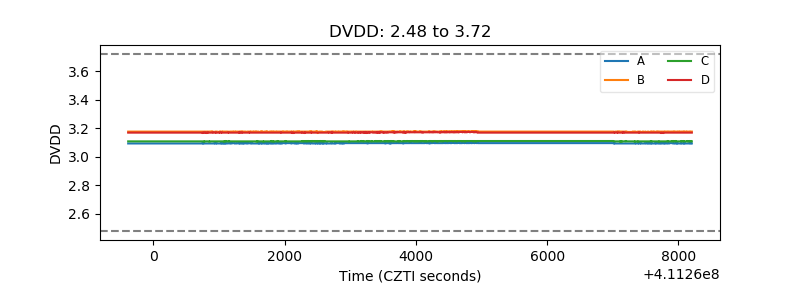 |
| Temperature 1 | 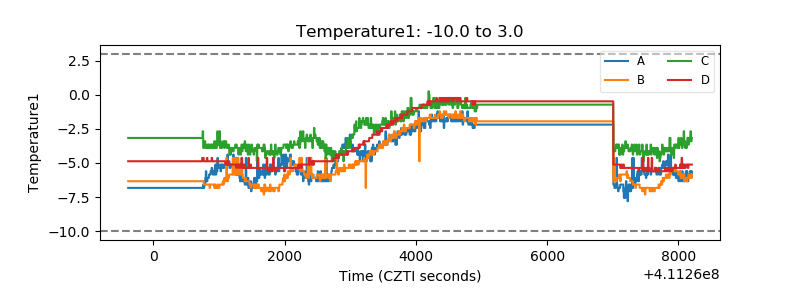 |
| Veto HV Monitor | 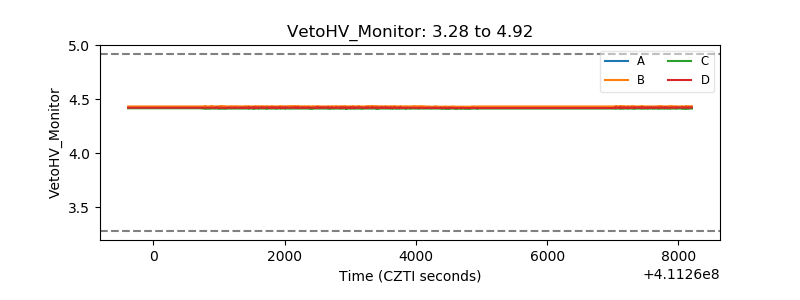 |
| Veto LLD |  |
| Alpha Counter | 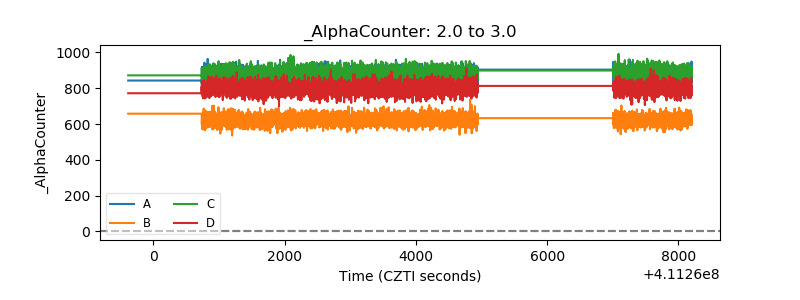 |
| _CPM_Rate | 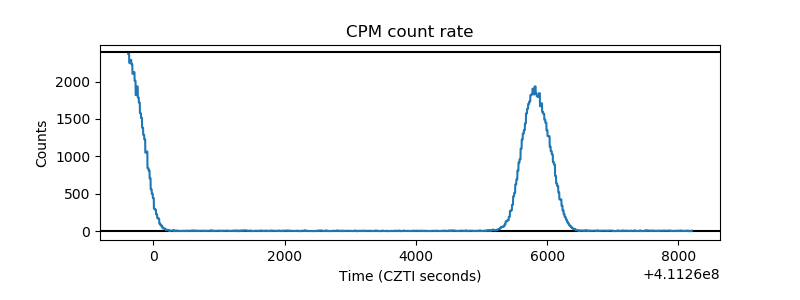 |
| CZT Counter | 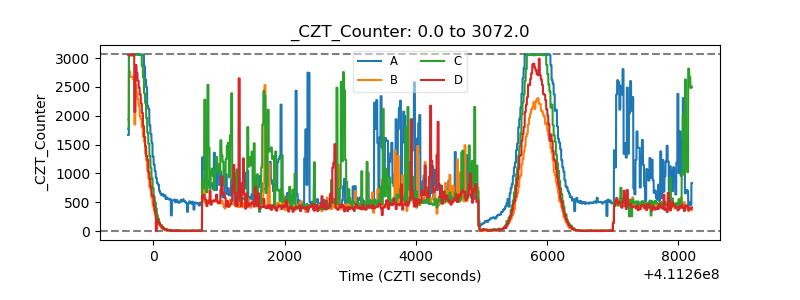 |
| +2.5 Volts monitor | 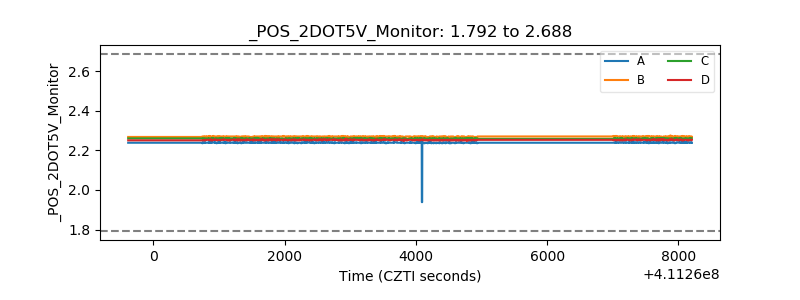 |
| +5 Volts monitor |  |
| _ROLL_ROT | 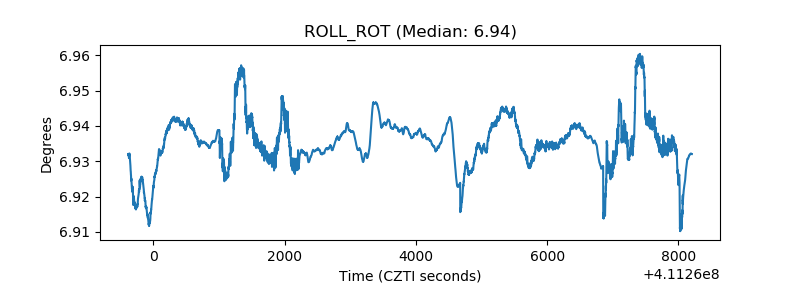 |
| _Roll_DEC | 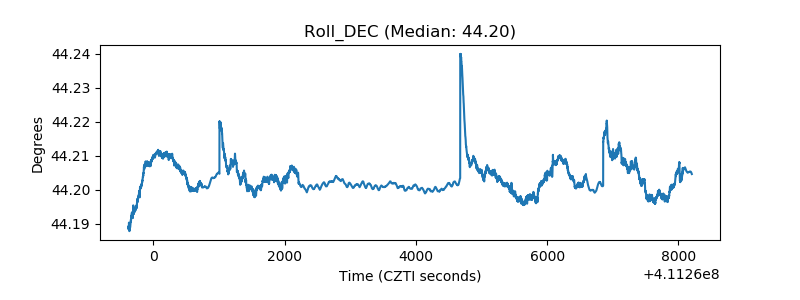 |
| _Roll_RA | 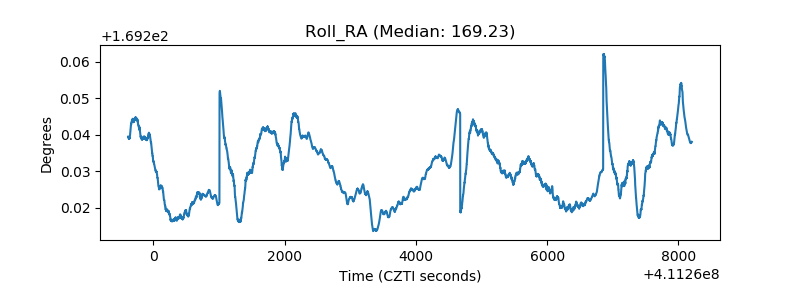 |
| Veto Counter | 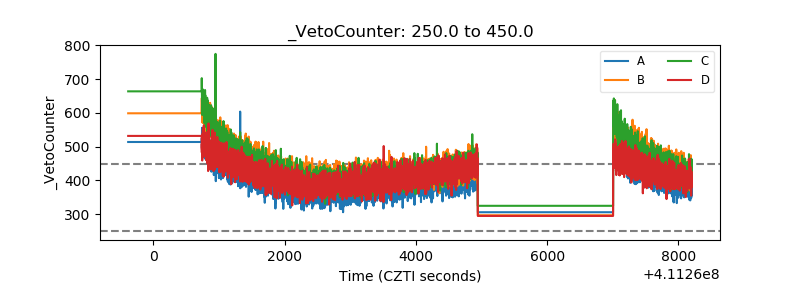 |