| Param | Original file | Final file |
|---|---|---|
| Filename | modeM0/AS1A12_077T06_9000005474_39433cztM0_level2.fits | modeM0/AS1A12_077T06_9000005474_39433cztM0_level2_quad_clean.evt |
| Size (bytes) | 421,107,840 | 91,650,240 |
| Size | 401.6 MB | 87.4 MB |
| Events in quadrant A | 5,802,885 | 584,160 |
| Events in quadrant B | 2,434,010 | 667,004 |
| Events in quadrant C | 4,289,444 | 585,073 |
| Events in quadrant D | 2,648,607 | 566,483 |
| Mode M0 | |||
|---|---|---|---|
| Quadrant | BADHDUFLAG | Total packets | Discarded packets |
| A | 0 | 20957 | 3 |
| B | 0 | 10811 | 2 |
| C | 0 | 15997 | 2 |
| D | 0 | 11733 | 2 |
| Mode SS | |||
|---|---|---|---|
| Quadrant | BADHDUFLAG | Total packets | Discarded packets |
| A | 0 | 110 | 0 |
| B | 0 | 110 | 0 |
| C | 0 | 110 | 0 |
| D | 0 | 110 | 0 |
| Mode M9 | |||
|---|---|---|---|
| Quadrant | BADHDUFLAG | Total packets | Discarded packets |
| A | 0 | 21 | 0 |
| B | 0 | 21 | 0 |
| C | 0 | 21 | 0 |
| D | 0 | 22 | 0 |
| Quadrant | Total seconds | Saturated seconds | Saturation percentage |
|---|---|---|---|
| A | 5314 | 629 | 11.836658% |
| B | 5314 | 8 | 0.150546% |
| C | 5314 | 427 | 8.035378% |
| D | 5314 | 61 | 1.147911% |
Noise dominated data is calculated using 1-second bins in cleaned event files. If a bin has >2000 counts, and if more than 50% of those come from <1% of pixels, then it is considered to be noise-dominated and hence unusable.
| Quadrant | # 1 sec bins | Bins with >0 counts | Bins with >2000 counts | High rate bins dominated by noise | Noise dominated (total time) | Noise dominated (detector-on time) | Marked lightcurve |
|---|---|---|---|---|---|---|---|
| A | 7436 | 5315 | 551 | 551 | 7.41% | 10.37% | 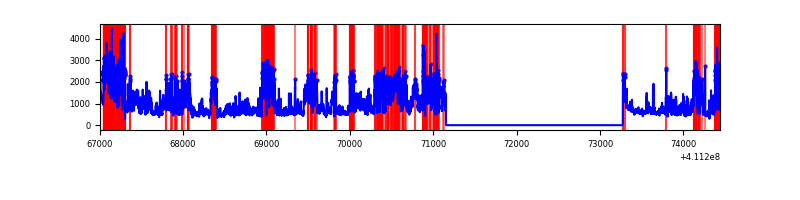 |
| B | 7436 | 5315 | 0 | 0 | 0.00% | 0.00% | 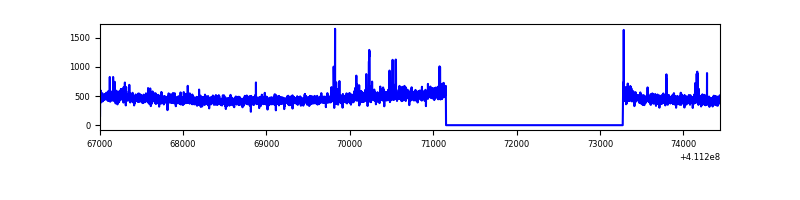 |
| C | 7436 | 5315 | 464 | 464 | 6.24% | 8.73% | 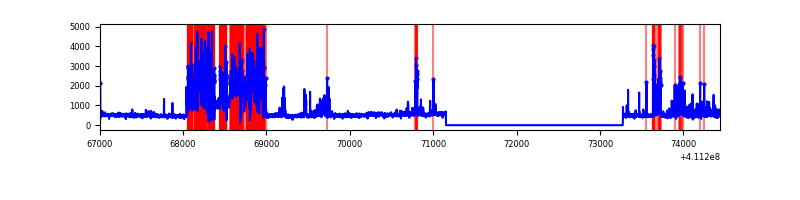 |
| D | 7436 | 5315 | 39 | 39 | 0.52% | 0.73% | 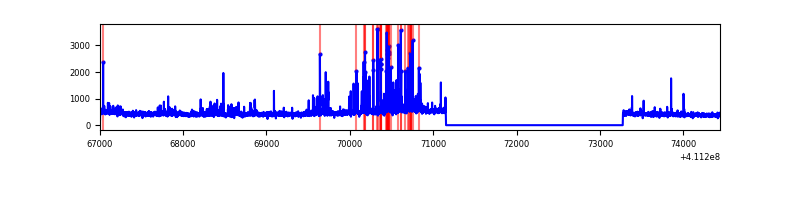 |
Top three noisy pixels from each quadrant. If the there are fewer than three noisy pixels in the level2.evt file, extra rows are filled as -1
| Pixel properties | Quadrant properties | ||||||
|---|---|---|---|---|---|---|---|
| Quadrant | DetID | PixID | Counts | Sigma | Mean | Median | Sigma |
| A | 15 | 222 | 3121302 | 26875.63 | 576 | 566 | 116.1 |
| A | 10 | 83 | 421113 | 3621.73 | 576 | 566 | 116.1 |
| A | 9 | 143 | 14564 | 120.55 | 576 | 566 | 116.1 |
| B | 5 | 172 | 28662 | 245.27 | 599 | 583 | 114.5 |
| B | 8 | 3 | 20578 | 174.65 | 599 | 583 | 114.5 |
| B | 5 | 255 | 17704 | 149.55 | 599 | 583 | 114.5 |
| C | 15 | 208 | 1723144 | 13170.09 | 564 | 569 | 130.8 |
| C | 15 | 214 | 218398 | 1665.43 | 564 | 569 | 130.8 |
| C | 9 | 187 | 118330 | 900.35 | 564 | 569 | 130.8 |
| D | 2 | 249 | 249491 | 1764.13 | 574 | 558 | 141.1 |
| D | 6 | 239 | 42771 | 299.15 | 574 | 558 | 141.1 |
| D | 12 | 0 | 42254 | 295.49 | 574 | 558 | 141.1 |
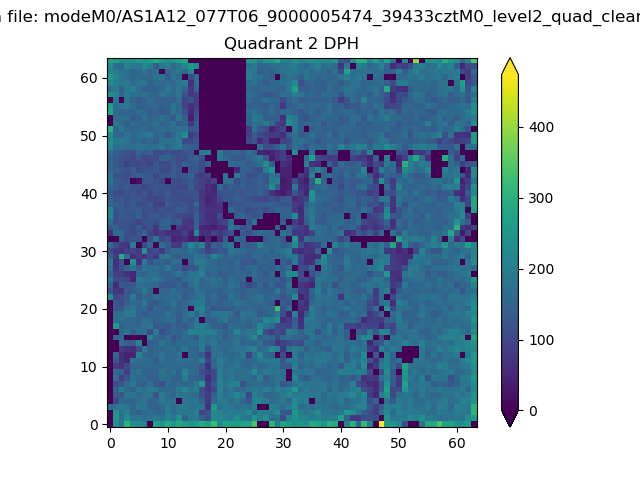
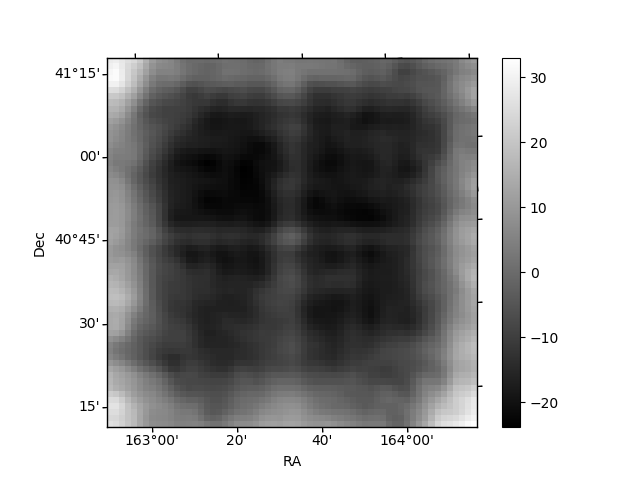
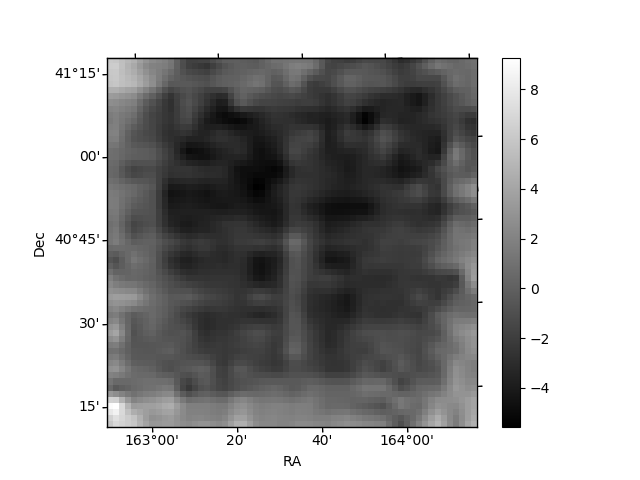
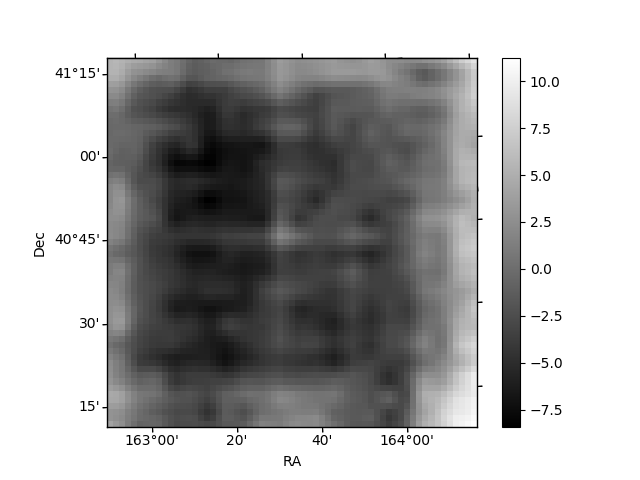
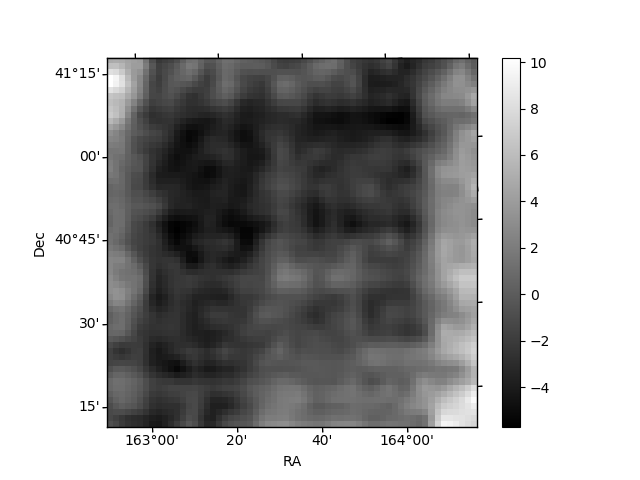
Histogram calculated using DETX and DETY for each event in the final _common_clean file
| Quadrant A | 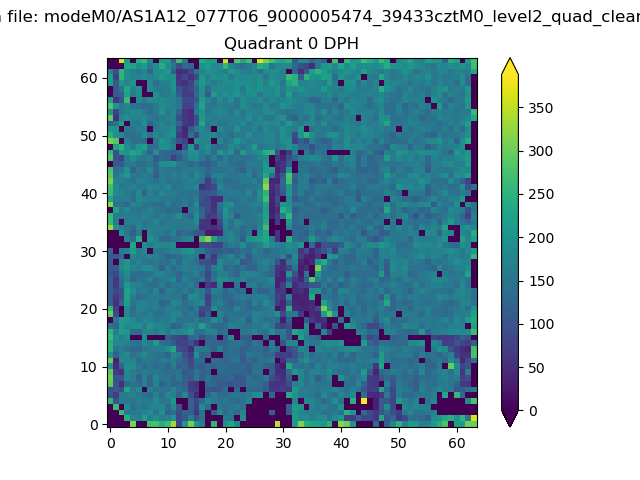 |
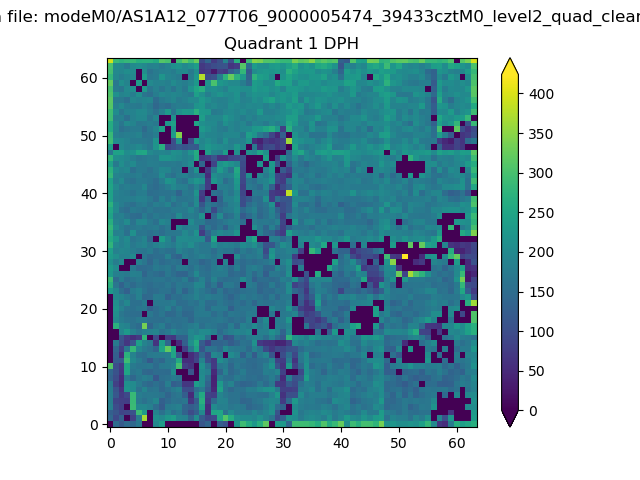 |
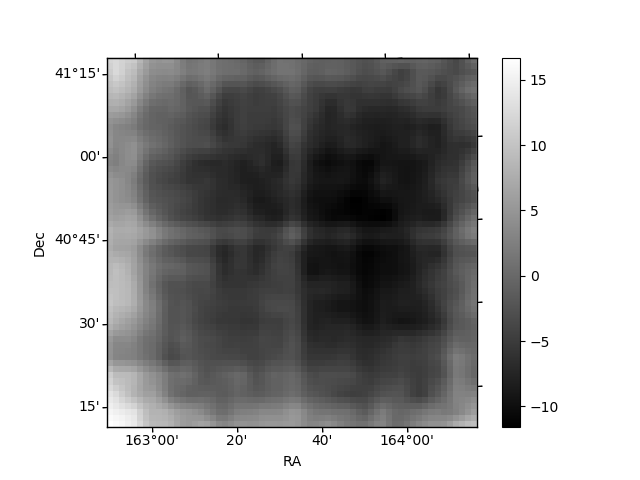
Quadrant B |
|---|---|---|---|
| Quadrant D | 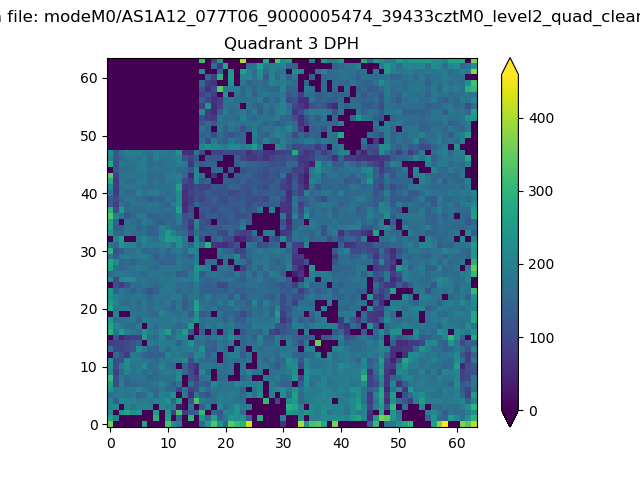 |
 |
Quadrant C |
| Plot type | Count rate plots | Images |
|---|---|---|
| Comparison with Poisson distribution Blue bars denote a histogram of data divided into 1 sec bins. Red curve is a Poisson curve with rate = median count rate of data. |
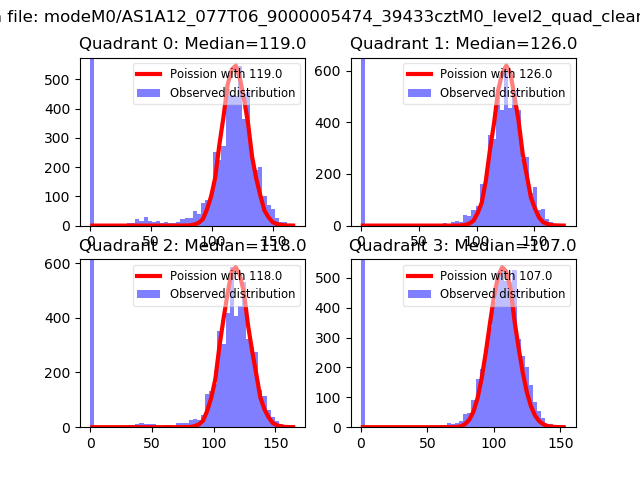 |
 |
| Quadrant-wise count rates Data is divided into 100 sec bins |
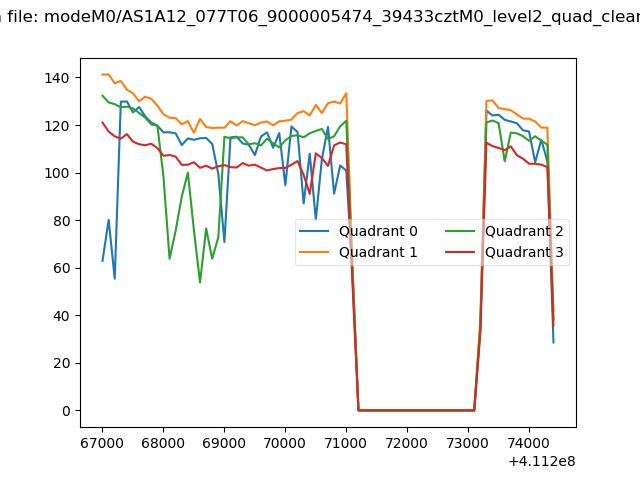 |
|
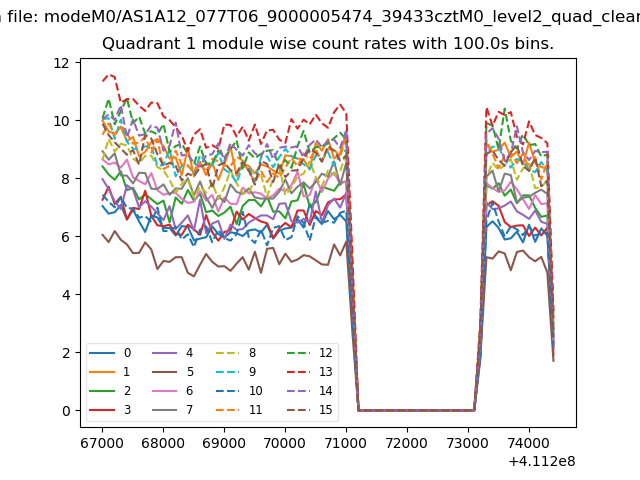
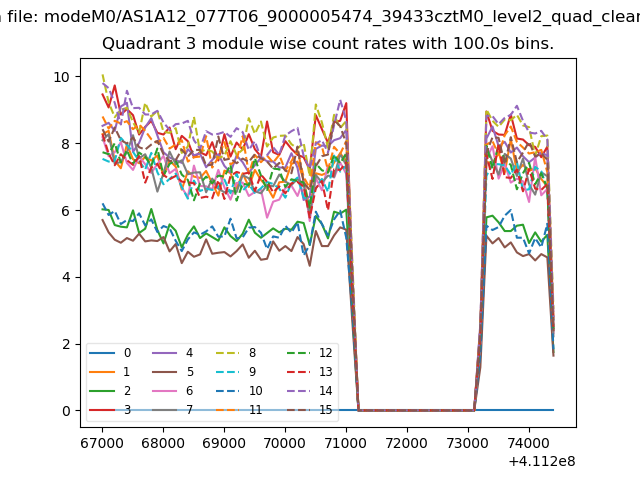
| Module-wise count rates for Quadrant A Data is divided into 100 sec bins |
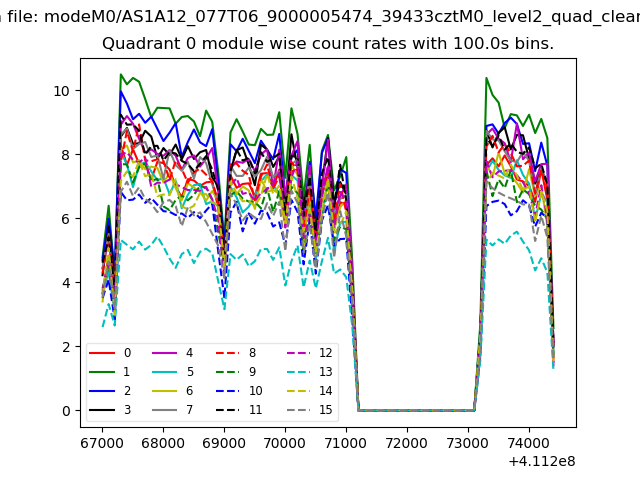 |
 |
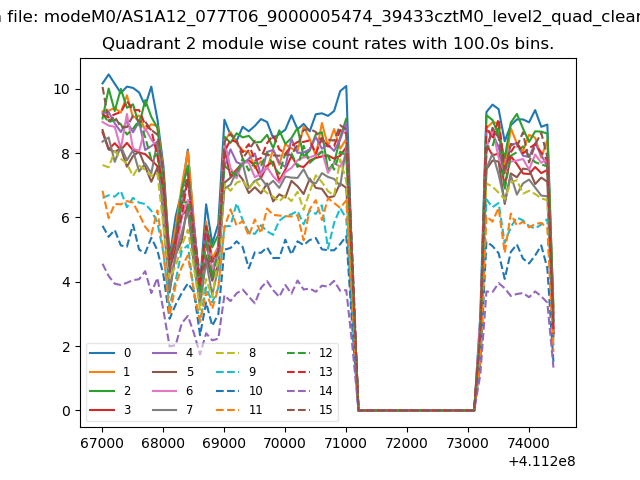
| Module-wise count rates for Quadrant B Data is divided into 100 sec bins |
 |
 |
| Module-wise count rates for Quadrant C Data is divided into 100 sec bins |
 |
 |
| Module-wise count rates for Quadrant D Data is divided into 100 sec bins |
 |
 |
| Parameter | Plot |
|---|---|
| CZT HV Monitor | 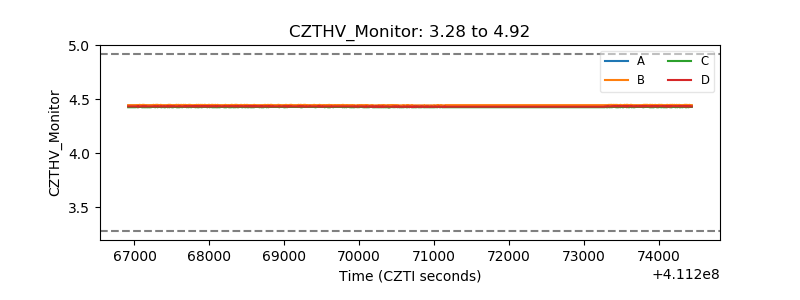 |
| D_VDD | 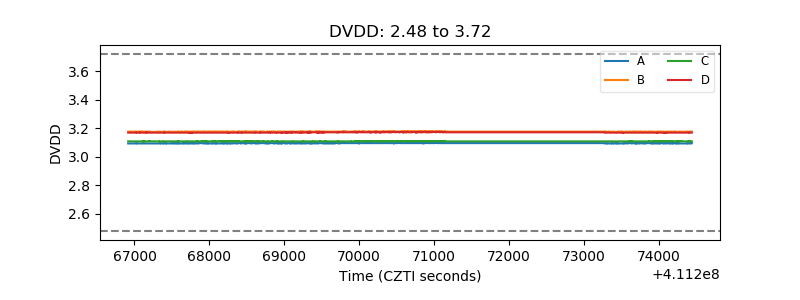 |
| Temperature 1 | 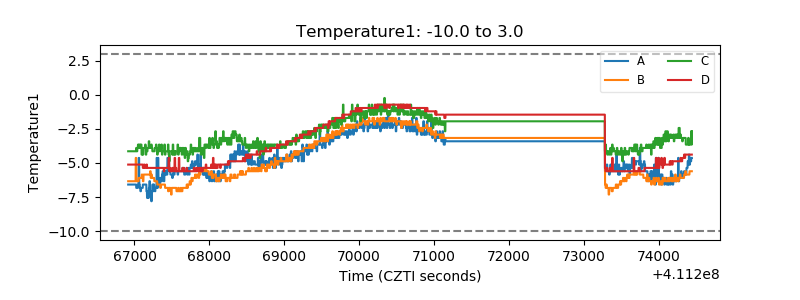 |
| Veto HV Monitor | 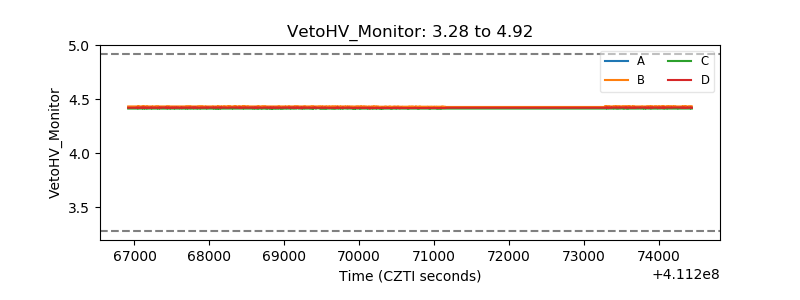 |
| Veto LLD | 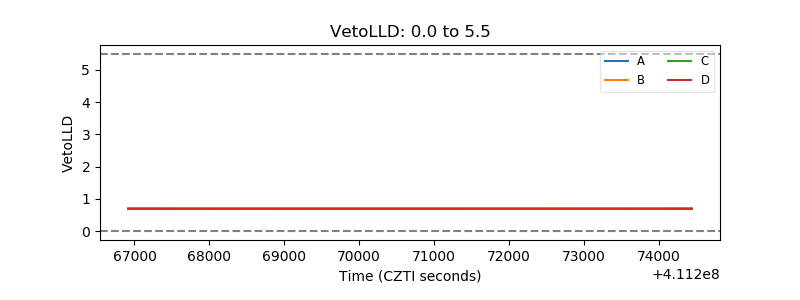 |
| Alpha Counter | 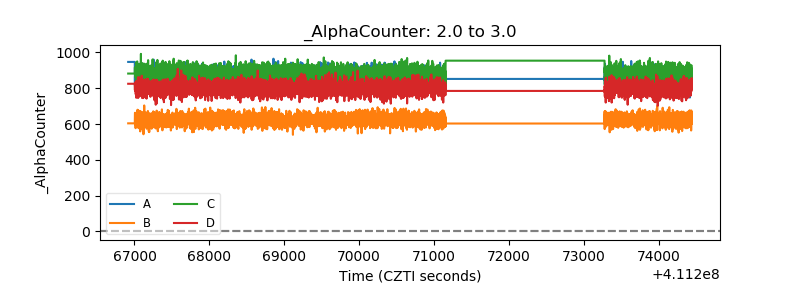 |
| _CPM_Rate | 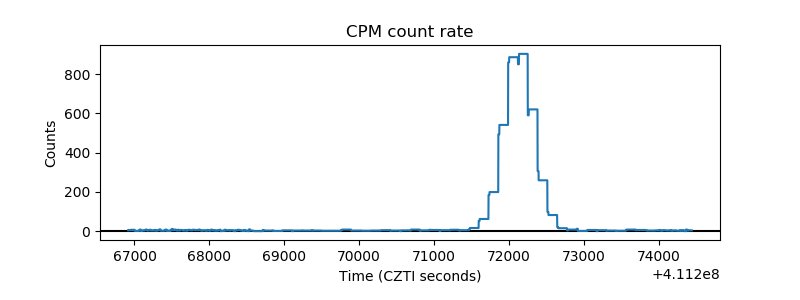 |
| CZT Counter | 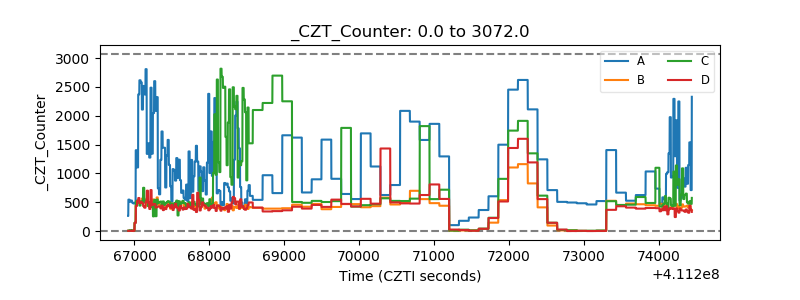 |
| +2.5 Volts monitor | 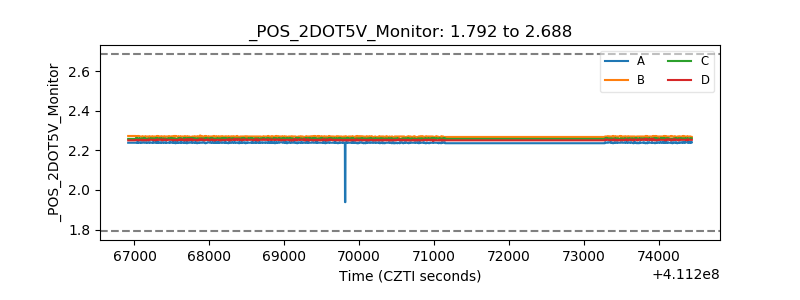 |
| +5 Volts monitor | 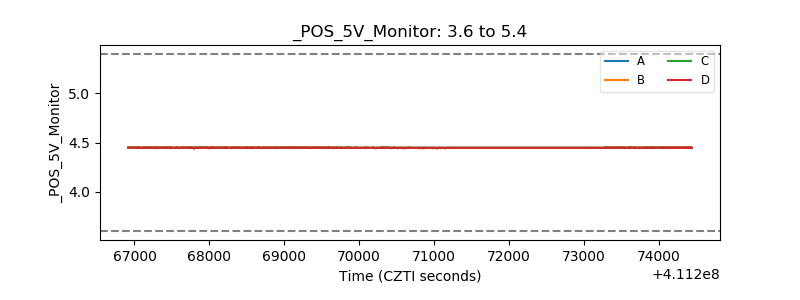 |
| _ROLL_ROT | 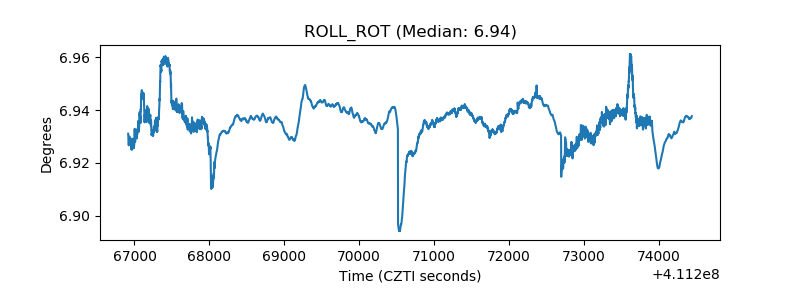 |
| _Roll_DEC | 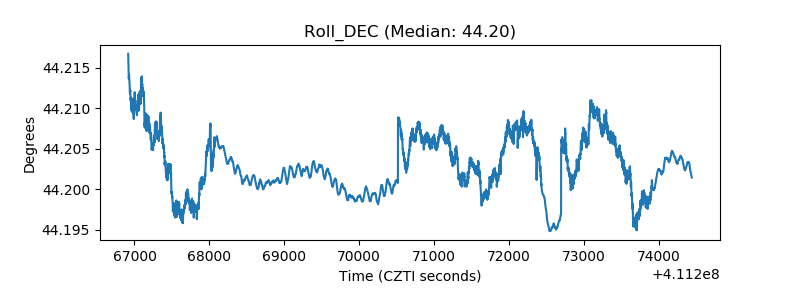 |
| _Roll_RA | 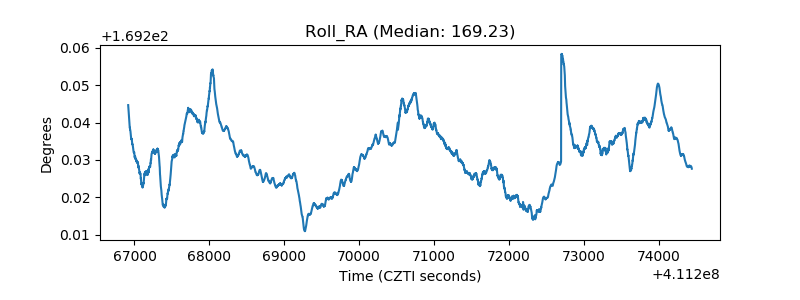 |
| Veto Counter | 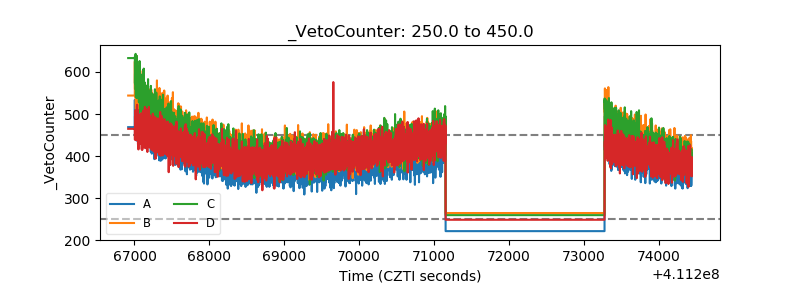 |