| Param | Original file | Final file |
|---|---|---|
| Filename | modeM0/AS1A12_077T06_9000005474_39434cztM0_level2.fits | modeM0/AS1A12_077T06_9000005474_39434cztM0_level2_quad_clean.evt |
| Size (bytes) | 462,363,840 | 86,088,960 |
| Size | 440.9 MB | 82.1 MB |
| Events in quadrant A | 7,354,671 | 499,067 |
| Events in quadrant B | 3,055,201 | 616,998 |
| Events in quadrant C | 3,829,493 | 577,665 |
| Events in quadrant D | 2,465,811 | 543,201 |
| Mode M0 | |||
|---|---|---|---|
| Quadrant | BADHDUFLAG | Total packets | Discarded packets |
| A | 0 | 25537 | 3 |
| B | 0 | 12718 | 2 |
| C | 0 | 14862 | 2 |
| D | 0 | 11353 | 2 |
| Mode SS | |||
|---|---|---|---|
| Quadrant | BADHDUFLAG | Total packets | Discarded packets |
| A | 0 | 108 | 0 |
| B | 0 | 108 | 0 |
| C | 0 | 108 | 0 |
| D | 0 | 108 | 0 |
| Mode M9 | |||
|---|---|---|---|
| Quadrant | BADHDUFLAG | Total packets | Discarded packets |
| A | 0 | 29 | 0 |
| B | 0 | 29 | 0 |
| C | 0 | 29 | 0 |
| D | 0 | 30 | 0 |
| Quadrant | Total seconds | Saturated seconds | Saturation percentage |
|---|---|---|---|
| A | 5277 | 1275 | 24.161455% |
| B | 5277 | 191 | 3.619481% |
| C | 5277 | 212 | 4.017434% |
| D | 5277 | 37 | 0.701156% |
Noise dominated data is calculated using 1-second bins in cleaned event files. If a bin has >2000 counts, and if more than 50% of those come from <1% of pixels, then it is considered to be noise-dominated and hence unusable.
| Quadrant | # 1 sec bins | Bins with >0 counts | Bins with >2000 counts | High rate bins dominated by noise | Noise dominated (total time) | Noise dominated (detector-on time) | Marked lightcurve |
|---|---|---|---|---|---|---|---|
| A | 7370 | 5278 | 1230 | 1230 | 16.69% | 23.30% | 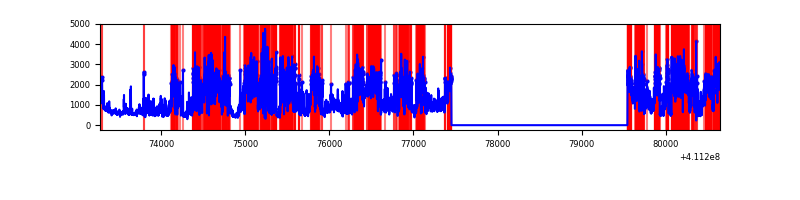 |
| B | 7370 | 5278 | 139 | 139 | 1.89% | 2.63% | 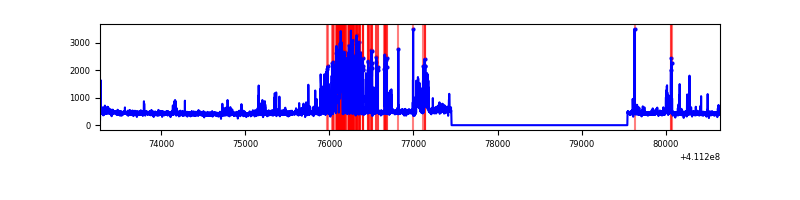 |
| C | 7370 | 5278 | 224 | 224 | 3.04% | 4.24% | 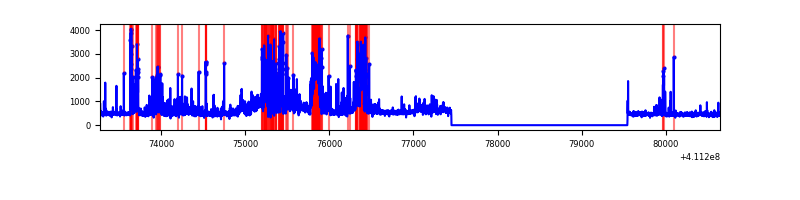 |
| D | 7370 | 5278 | 23 | 23 | 0.31% | 0.44% | 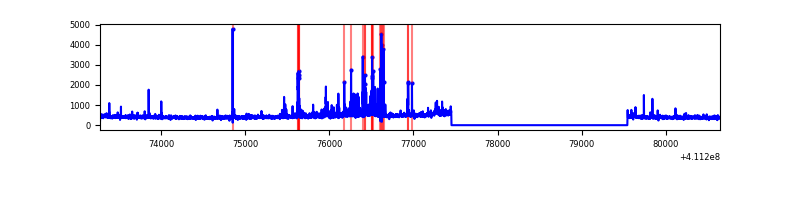 |
Top three noisy pixels from each quadrant. If the there are fewer than three noisy pixels in the level2.evt file, extra rows are filled as -1
| Pixel properties | Quadrant properties | ||||||
|---|---|---|---|---|---|---|---|
| Quadrant | DetID | PixID | Counts | Sigma | Mean | Median | Sigma |
| A | 15 | 222 | 4767566 | 43146.5 | 547 | 538 | 110.5 |
| A | 10 | 83 | 425396 | 3845.4 | 547 | 538 | 110.5 |
| A | 15 | 174 | 20707 | 182.55 | 547 | 538 | 110.5 |
| B | 5 | 172 | 586502 | 5272.58 | 580 | 566 | 111.1 |
| B | 8 | 3 | 176224 | 1580.67 | 580 | 566 | 111.1 |
| B | 12 | 111 | 13635 | 117.6 | 580 | 566 | 111.1 |
| C | 15 | 208 | 1186144 | 9161.3 | 558 | 561 | 129.4 |
| C | 15 | 214 | 220423 | 1698.93 | 558 | 561 | 129.4 |
| C | 9 | 187 | 201647 | 1553.84 | 558 | 561 | 129.4 |
| D | 2 | 249 | 85675 | 628.36 | 564 | 548 | 135.5 |
| D | 12 | 227 | 79226 | 580.75 | 564 | 548 | 135.5 |
| D | 13 | 249 | 45531 | 332.04 | 564 | 548 | 135.5 |
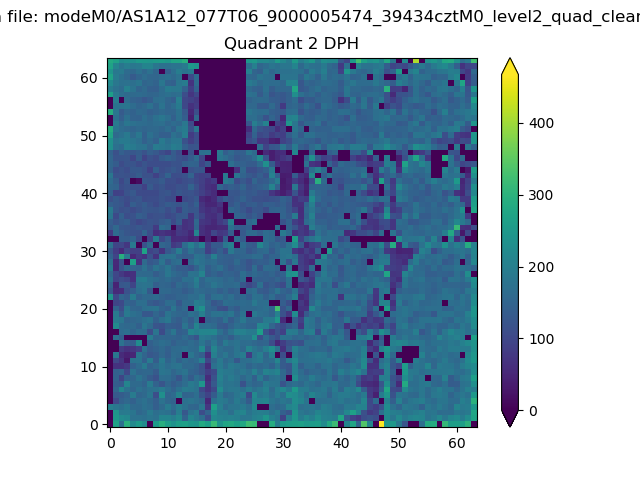
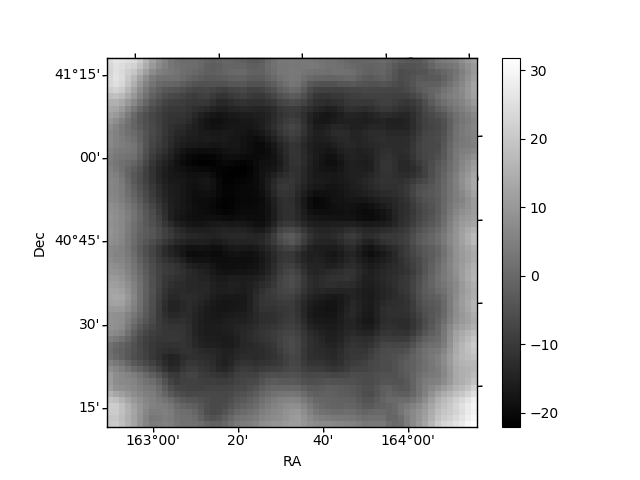
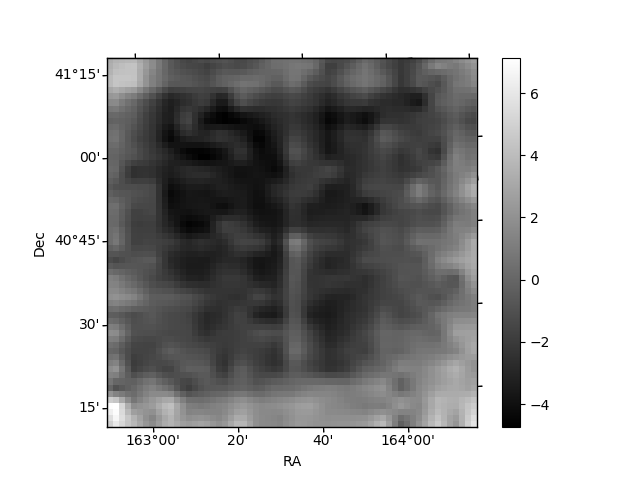
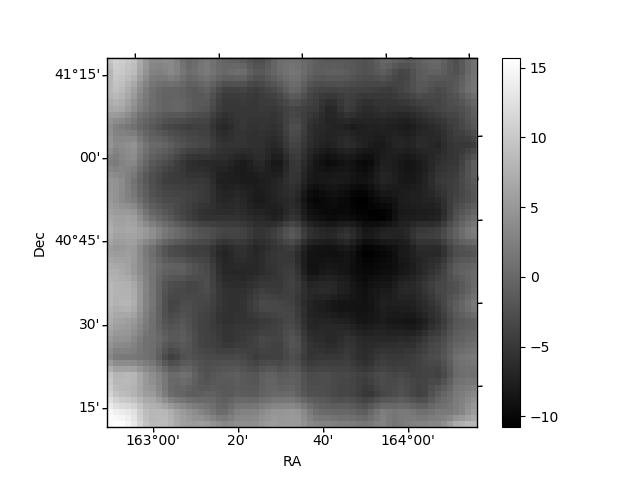
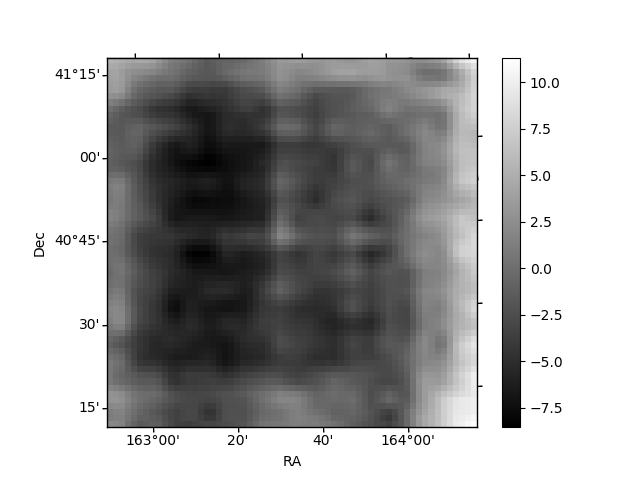
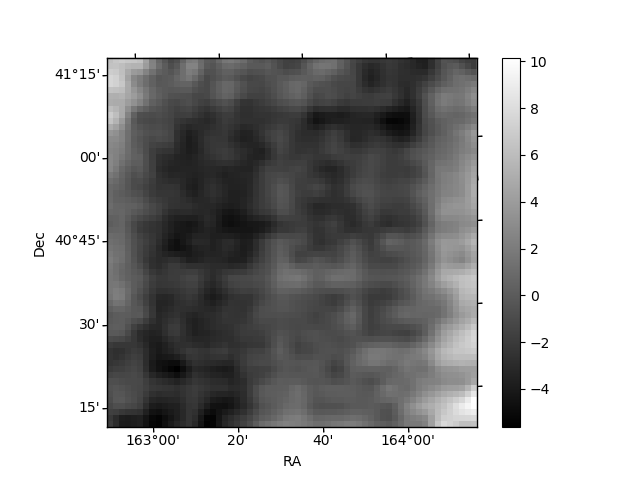
Histogram calculated using DETX and DETY for each event in the final _common_clean file
| Quadrant A | 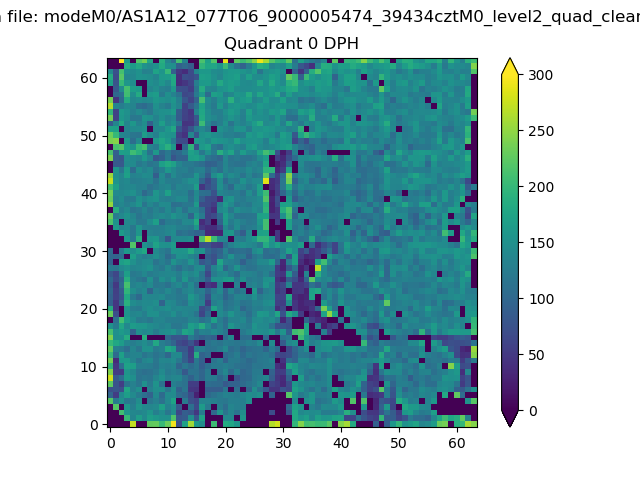 |
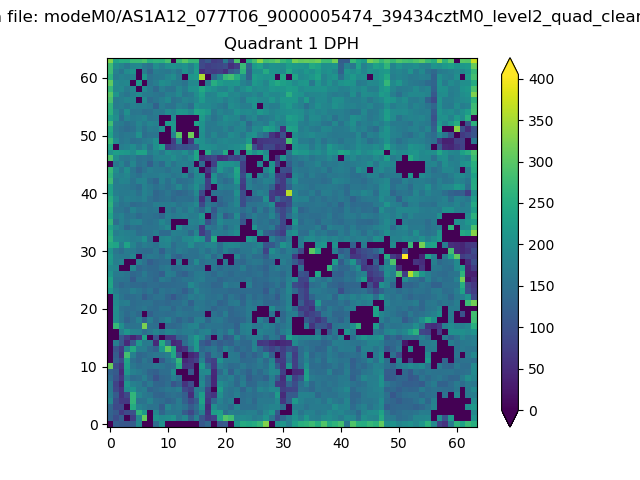 |
Quadrant B |
|---|---|---|---|
| Quadrant D | 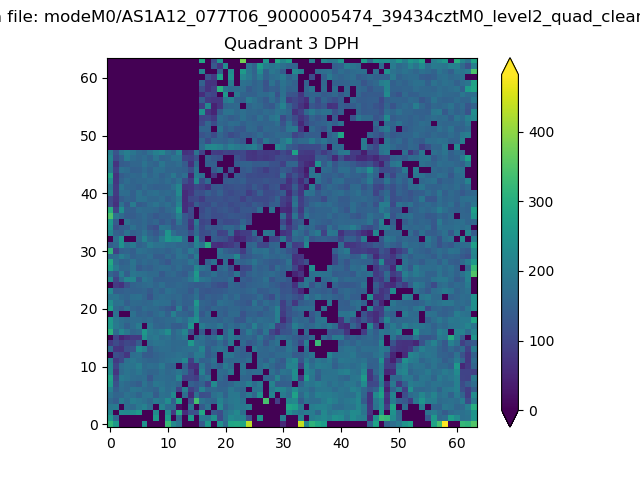 |
 |
Quadrant C |
| Plot type | Count rate plots | Images |
|---|---|---|
| Comparison with Poisson distribution Blue bars denote a histogram of data divided into 1 sec bins. Red curve is a Poisson curve with rate = median count rate of data. |
 |
 |
| Quadrant-wise count rates Data is divided into 100 sec bins |
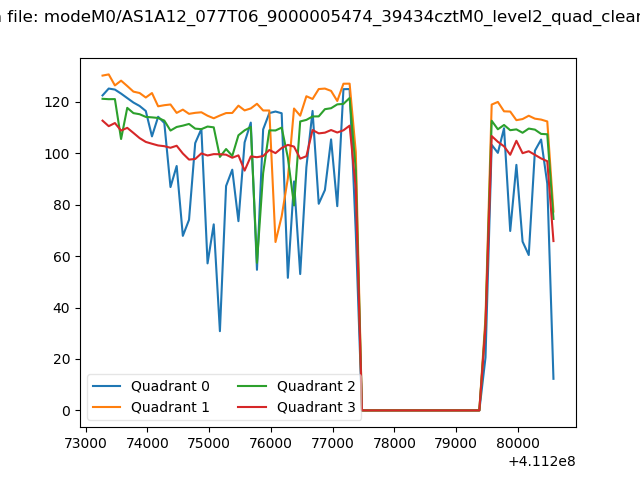 |
|
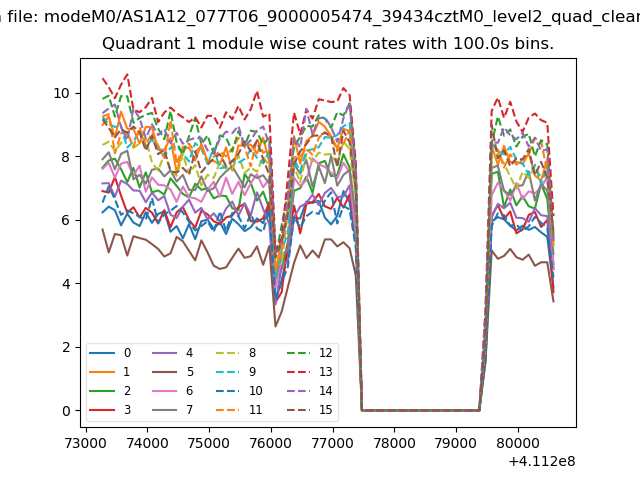
| Module-wise count rates for Quadrant A Data is divided into 100 sec bins |
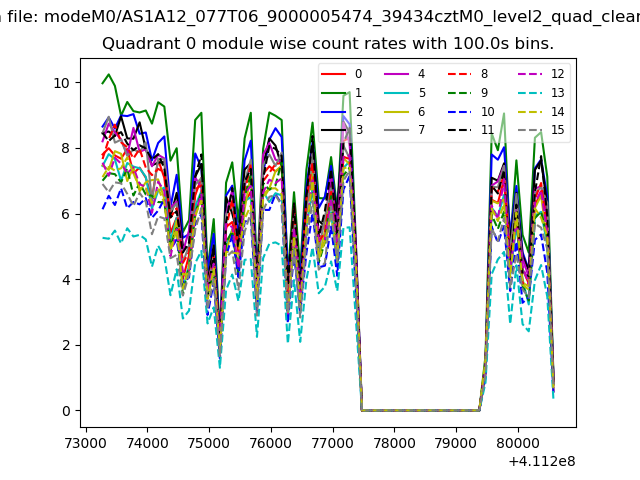 |
 |
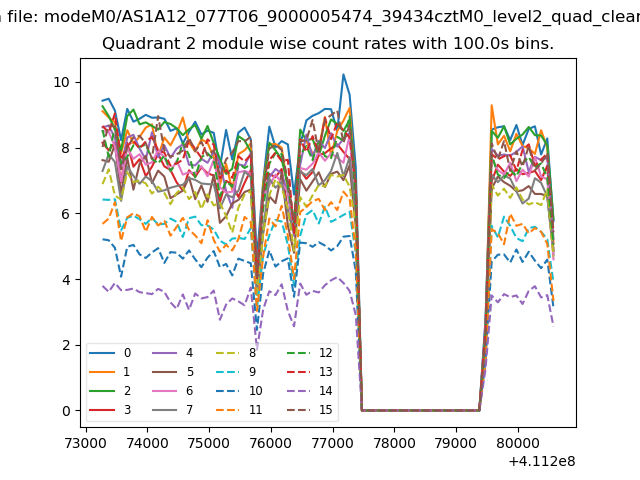
| Module-wise count rates for Quadrant B Data is divided into 100 sec bins |
 |
 |
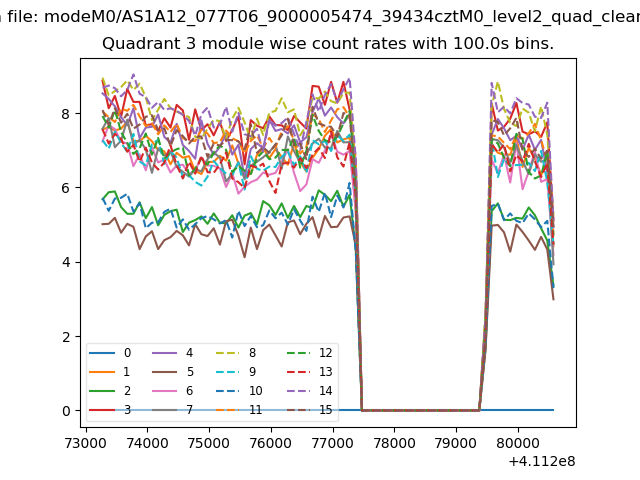
| Module-wise count rates for Quadrant C Data is divided into 100 sec bins |
 |
 |
| Module-wise count rates for Quadrant D Data is divided into 100 sec bins |
 |
 |
| Parameter | Plot |
|---|---|
| CZT HV Monitor | 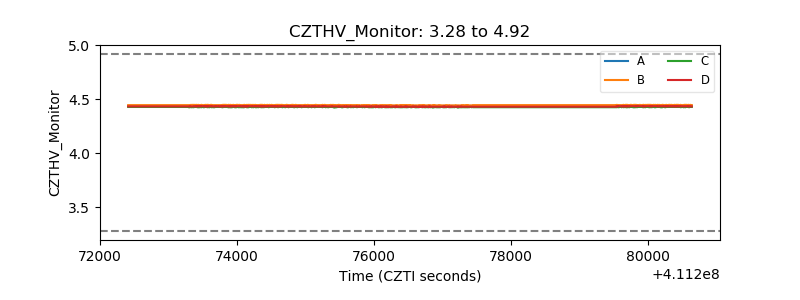 |
| D_VDD | 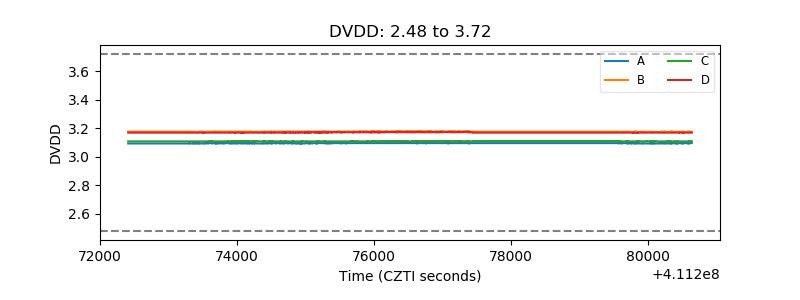 |
| Temperature 1 | 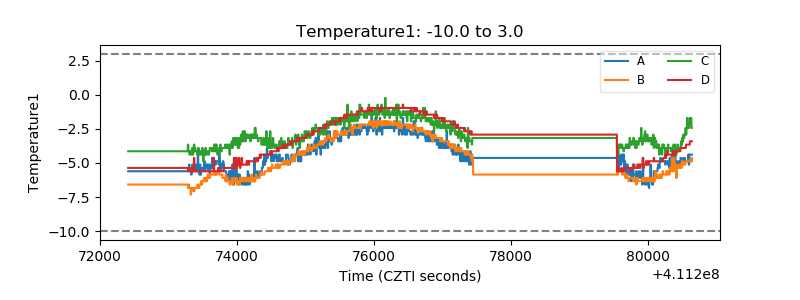 |
| Veto HV Monitor |  |
| Veto LLD | 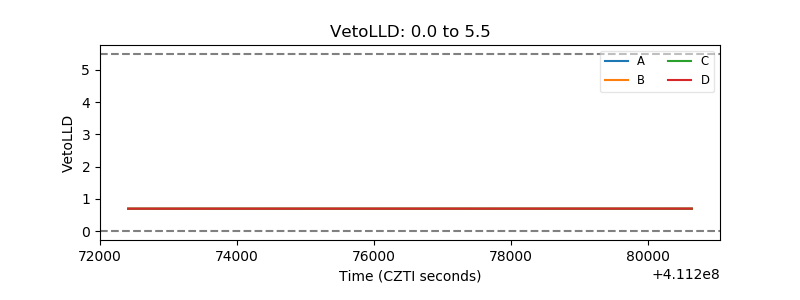 |
| Alpha Counter | 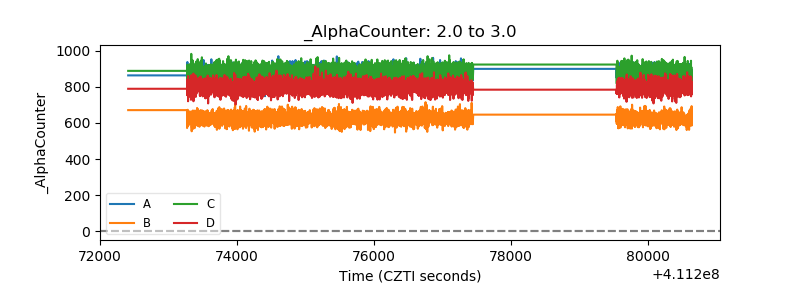 |
| _CPM_Rate | 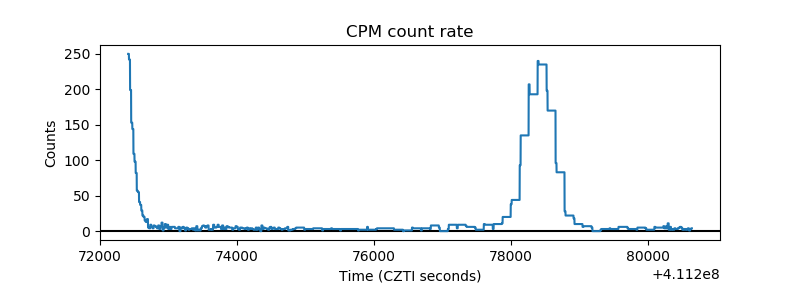 |
| CZT Counter | 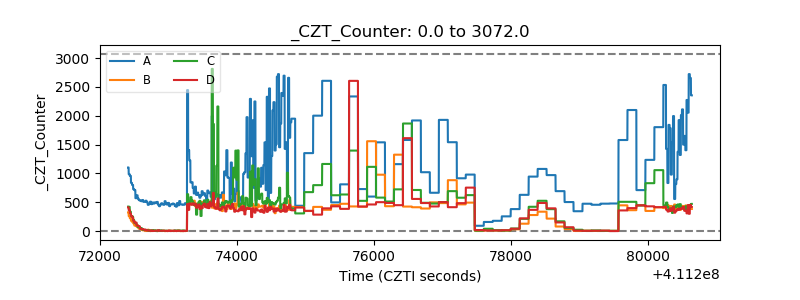 |
| +2.5 Volts monitor | 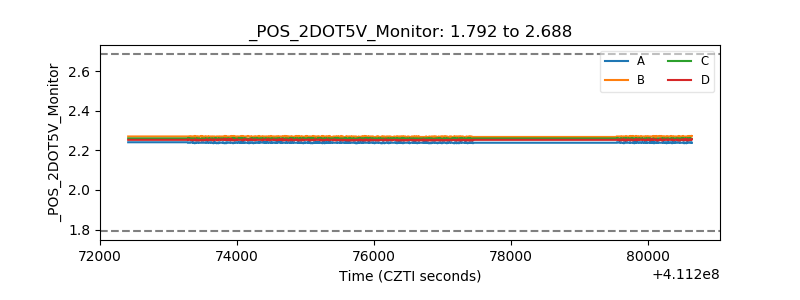 |
| +5 Volts monitor | 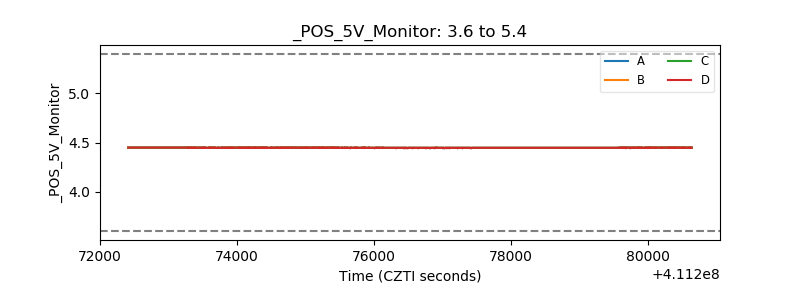 |
| _ROLL_ROT | 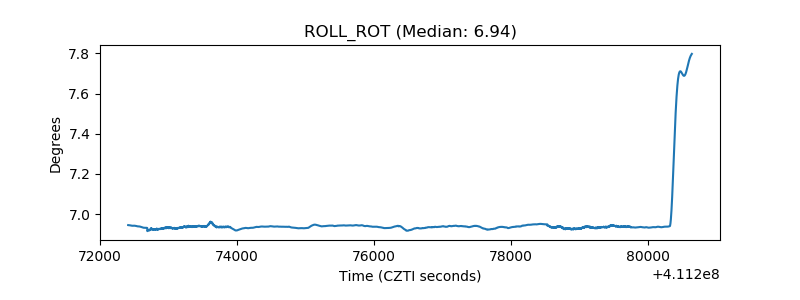 |
| _Roll_DEC | 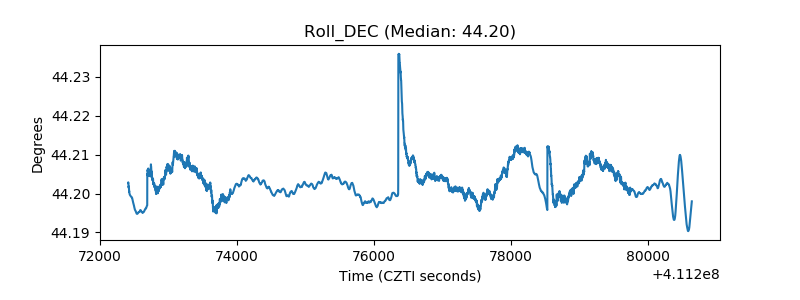 |
| _Roll_RA | 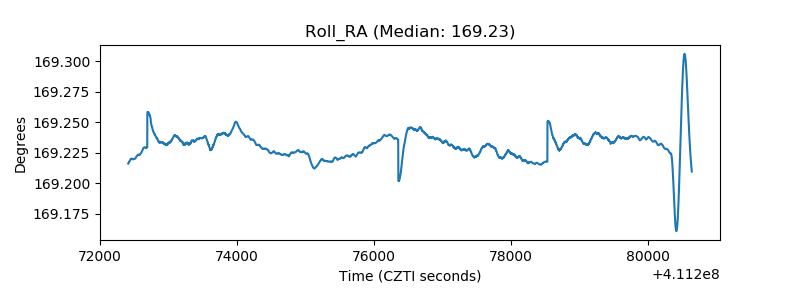 |
| Veto Counter | 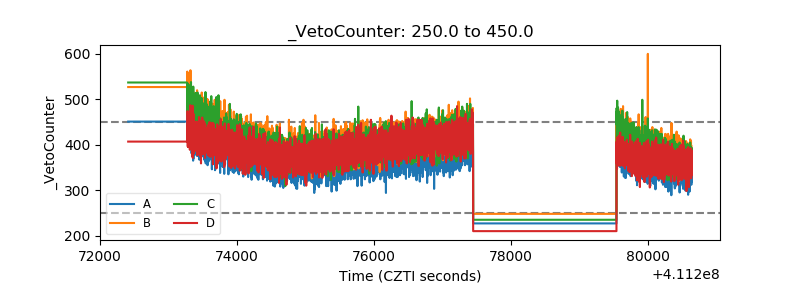 |