| Param | Original file | Final file |
|---|---|---|
| Filename | modeM0/AS1A12_077T06_9000005474_39435cztM0_level2.fits | modeM0/AS1A12_077T06_9000005474_39435cztM0_level2_quad_clean.evt |
| Size (bytes) | 479,393,280 | 84,931,200 |
| Size | 457.2 MB | 81.0 MB |
| Events in quadrant A | 8,071,213 | 479,857 |
| Events in quadrant B | 2,486,482 | 620,529 |
| Events in quadrant C | 2,968,468 | 580,160 |
| Events in quadrant D | 3,802,171 | 515,225 |
| Mode M0 | |||
|---|---|---|---|
| Quadrant | BADHDUFLAG | Total packets | Discarded packets |
| A | 0 | 27685 | 3 |
| B | 0 | 11125 | 2 |
| C | 0 | 12332 | 2 |
| D | 0 | 15187 | 2 |
| Mode SS | |||
|---|---|---|---|
| Quadrant | BADHDUFLAG | Total packets | Discarded packets |
| A | 0 | 108 | 0 |
| B | 0 | 108 | 0 |
| C | 0 | 108 | 0 |
| D | 0 | 108 | 0 |
| Mode M9 | |||
|---|---|---|---|
| Quadrant | BADHDUFLAG | Total packets | Discarded packets |
| A | 0 | 31 | 0 |
| B | 0 | 31 | 0 |
| C | 0 | 31 | 0 |
| D | 0 | 32 | 0 |
| Quadrant | Total seconds | Saturated seconds | Saturation percentage |
|---|---|---|---|
| A | 5372 | 1454 | 27.066270% |
| B | 5372 | 15 | 0.279226% |
| C | 5372 | 42 | 0.781832% |
| D | 5372 | 317 | 5.900968% |
Noise dominated data is calculated using 1-second bins in cleaned event files. If a bin has >2000 counts, and if more than 50% of those come from <1% of pixels, then it is considered to be noise-dominated and hence unusable.
| Quadrant | # 1 sec bins | Bins with >0 counts | Bins with >2000 counts | High rate bins dominated by noise | Noise dominated (total time) | Noise dominated (detector-on time) | Marked lightcurve |
|---|---|---|---|---|---|---|---|
| A | 7256 | 5373 | 1344 | 1344 | 18.52% | 25.01% | 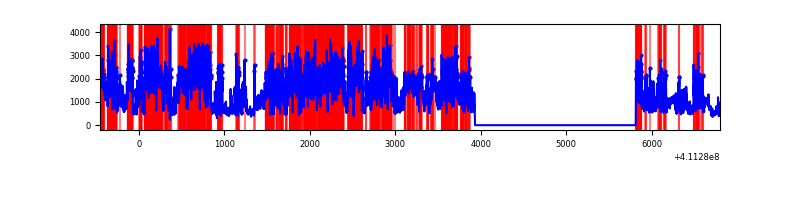 |
| B | 7256 | 5373 | 6 | 6 | 0.08% | 0.11% | 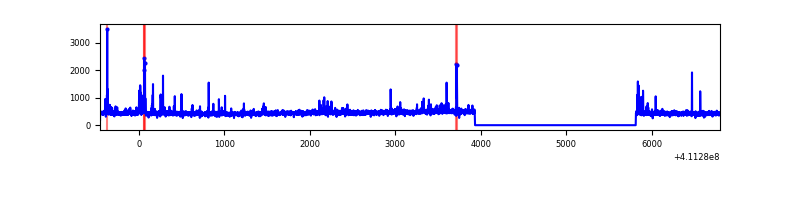 |
| C | 7256 | 5373 | 28 | 28 | 0.39% | 0.52% | 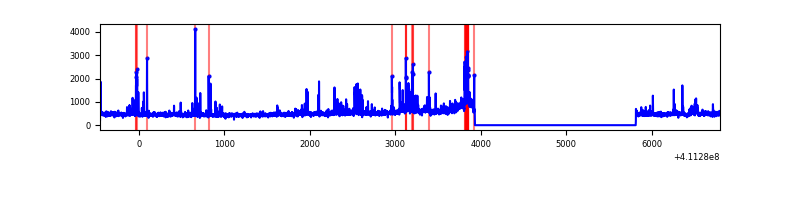 |
| D | 7256 | 5373 | 270 | 270 | 3.72% | 5.03% | 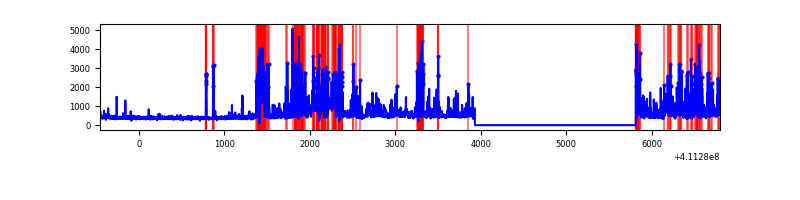 |
Top three noisy pixels from each quadrant. If the there are fewer than three noisy pixels in the level2.evt file, extra rows are filled as -1
| Pixel properties | Quadrant properties | ||||||
|---|---|---|---|---|---|---|---|
| Quadrant | DetID | PixID | Counts | Sigma | Mean | Median | Sigma |
| A | 15 | 222 | 5482011 | 48743.87 | 553 | 543 | 112.5 |
| A | 10 | 83 | 433150 | 3846.95 | 553 | 543 | 112.5 |
| A | 15 | 174 | 11637 | 98.65 | 553 | 543 | 112.5 |
| B | 5 | 172 | 72035 | 636.11 | 589 | 574 | 112.3 |
| B | 8 | 3 | 70027 | 618.23 | 589 | 574 | 112.3 |
| B | 5 | 255 | 34294 | 300.16 | 589 | 574 | 112.3 |
| C | 15 | 208 | 284563 | 2117.09 | 572 | 576 | 134.1 |
| C | 15 | 214 | 229443 | 1706.17 | 572 | 576 | 134.1 |
| C | 9 | 187 | 104611 | 775.57 | 572 | 576 | 134.1 |
| D | 12 | 227 | 712304 | 5273.44 | 558 | 541 | 135.0 |
| D | 12 | 0 | 407829 | 3017.59 | 558 | 541 | 135.0 |
| D | 2 | 249 | 299815 | 2217.32 | 558 | 541 | 135.0 |
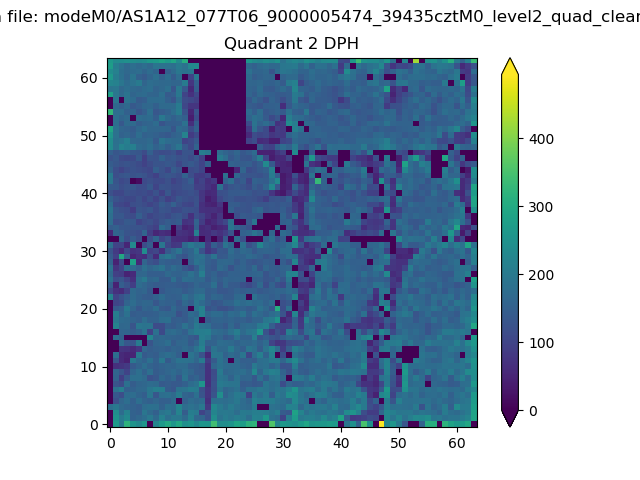
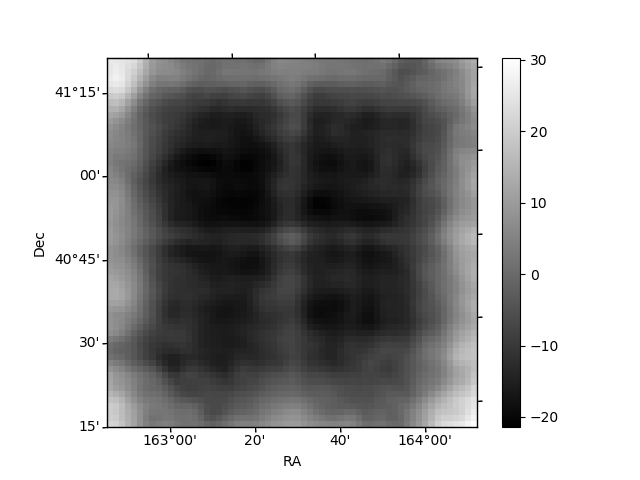
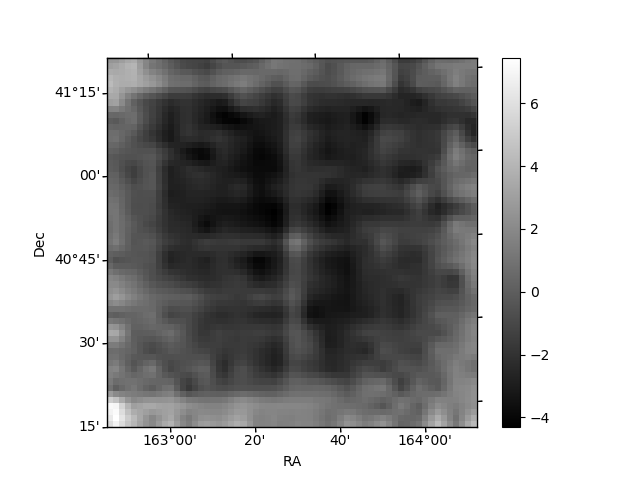
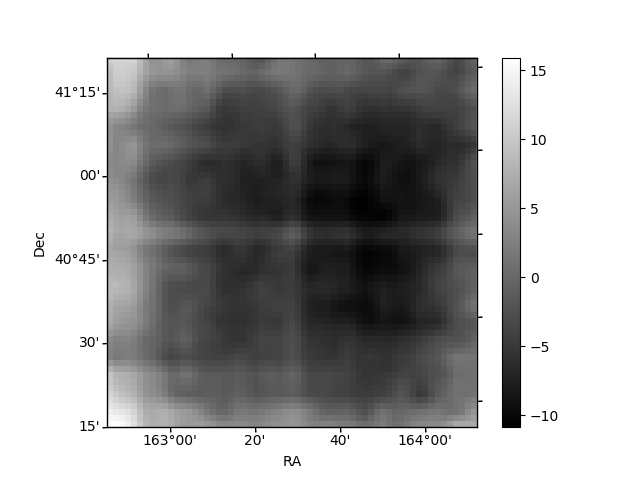
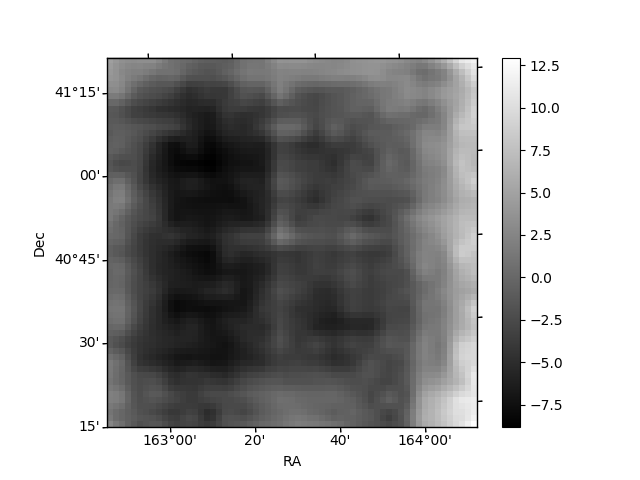
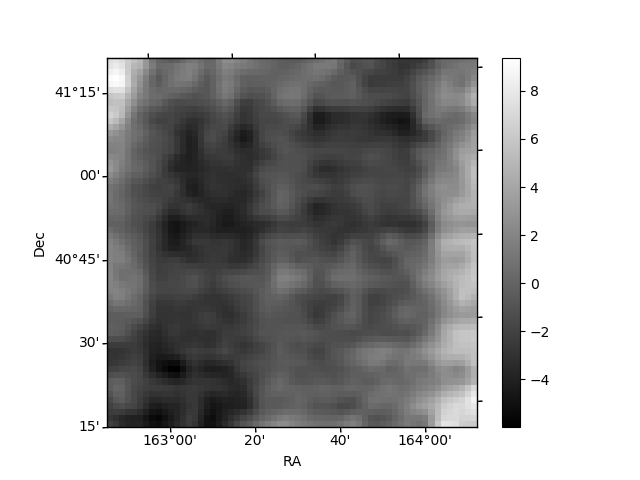
Histogram calculated using DETX and DETY for each event in the final _common_clean file
| Quadrant A | 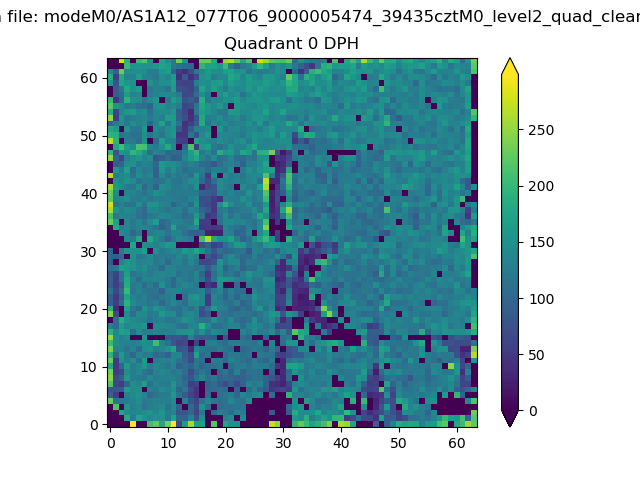 |
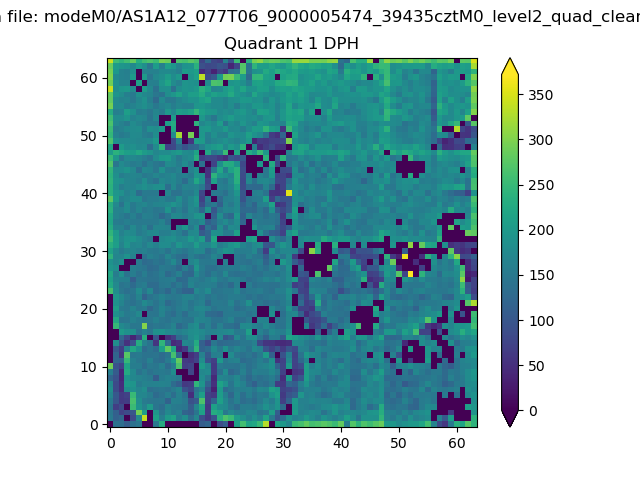 |
Quadrant B |
|---|---|---|---|
| Quadrant D | 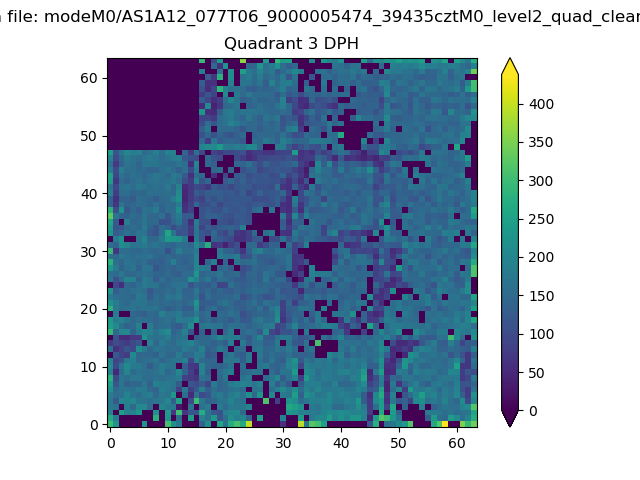 |
 |
Quadrant C |
| Plot type | Count rate plots | Images |
|---|---|---|
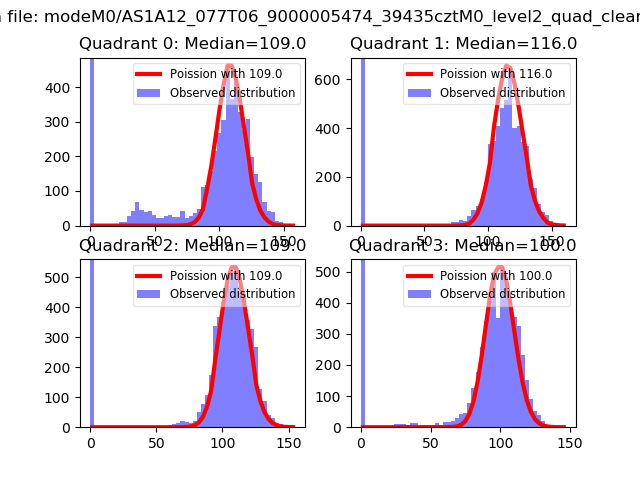
| Comparison with Poisson distribution Blue bars denote a histogram of data divided into 1 sec bins. Red curve is a Poisson curve with rate = median count rate of data. |
 |
 |
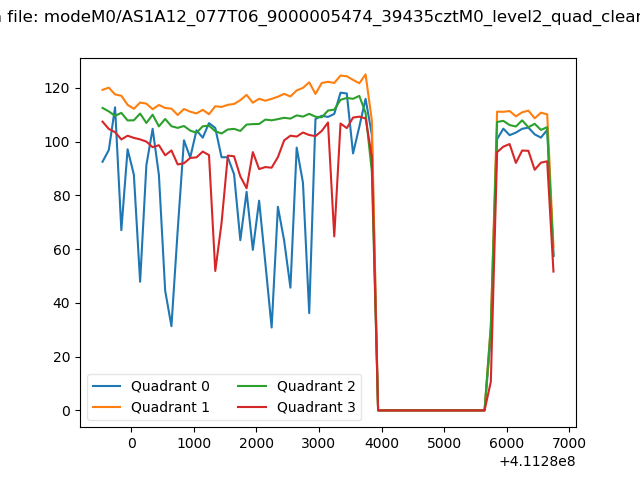
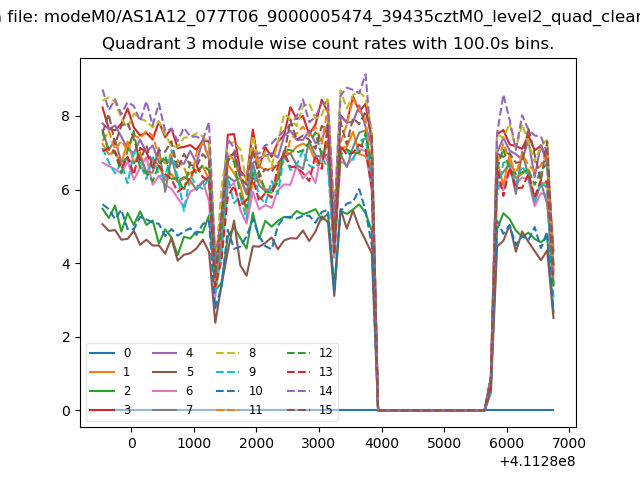
| Quadrant-wise count rates Data is divided into 100 sec bins |
 |
|
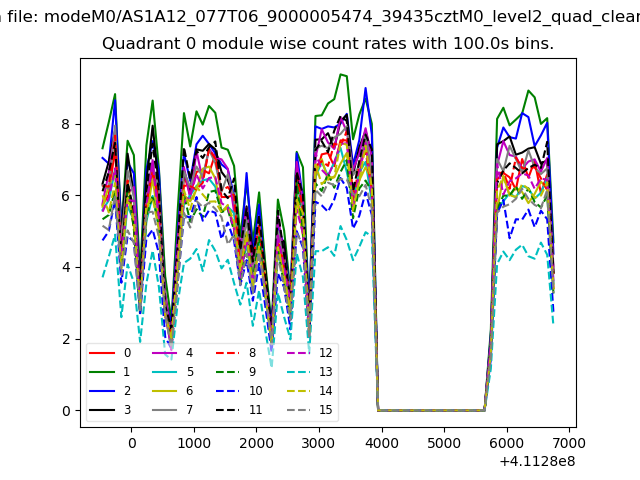
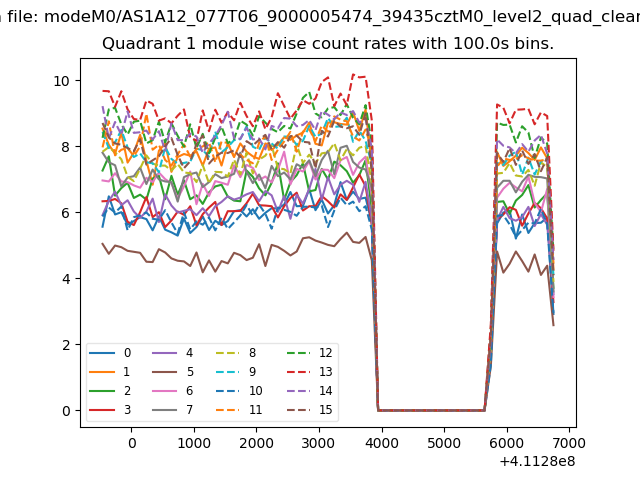
| Module-wise count rates for Quadrant A Data is divided into 100 sec bins |
 |
 |
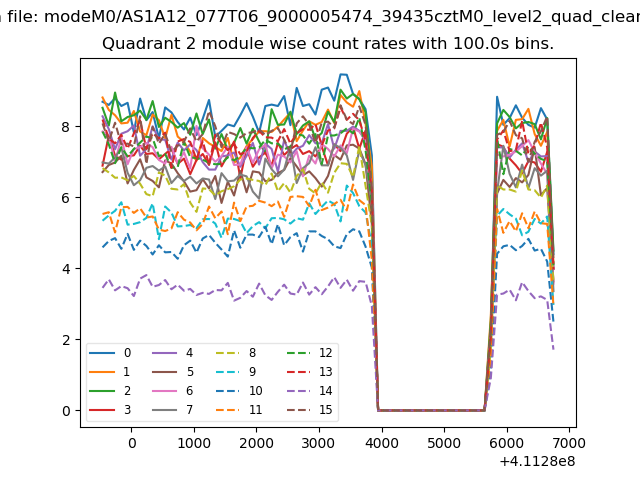
| Module-wise count rates for Quadrant B Data is divided into 100 sec bins |
 |
 |
| Module-wise count rates for Quadrant C Data is divided into 100 sec bins |
 |
 |
| Module-wise count rates for Quadrant D Data is divided into 100 sec bins |
 |
 |
| Parameter | Plot |
|---|---|
| CZT HV Monitor | 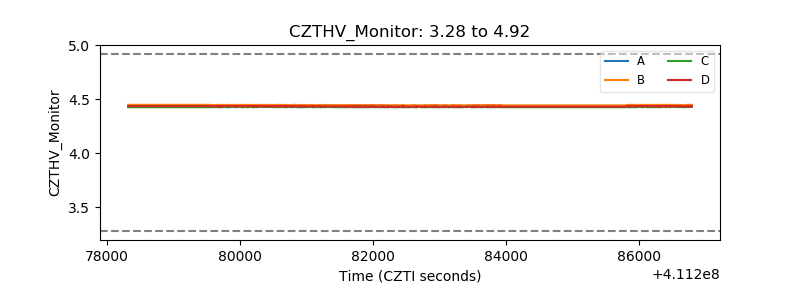 |
| D_VDD | 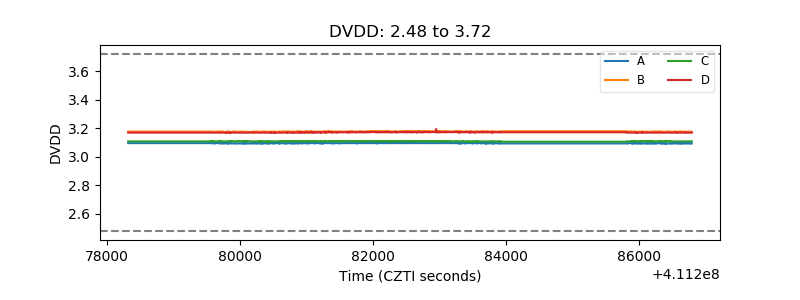 |
| Temperature 1 | 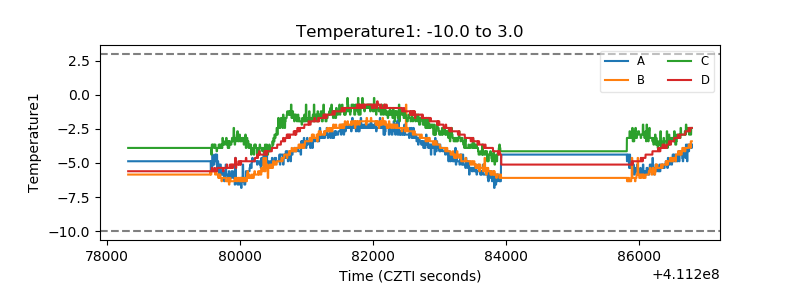 |
| Veto HV Monitor |  |
| Veto LLD | 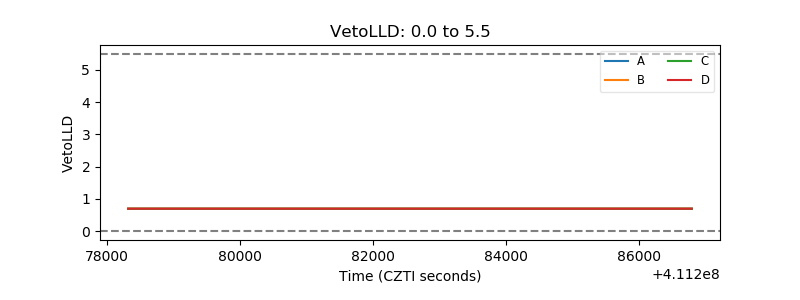 |
| Alpha Counter | 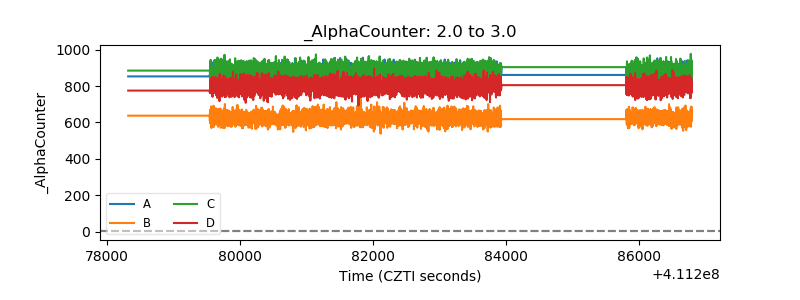 |
| _CPM_Rate | 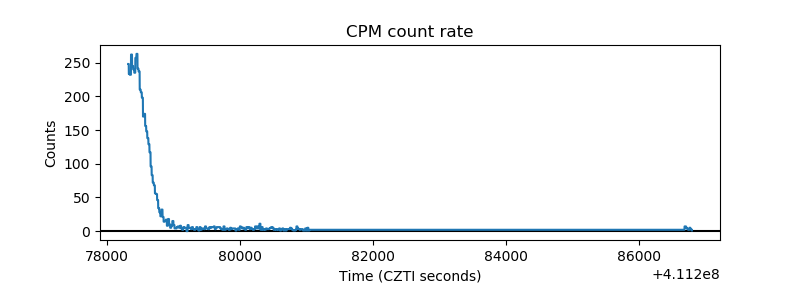 |
| CZT Counter | 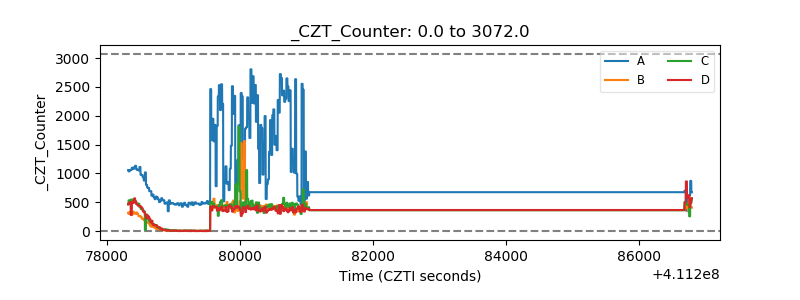 |
| +2.5 Volts monitor | 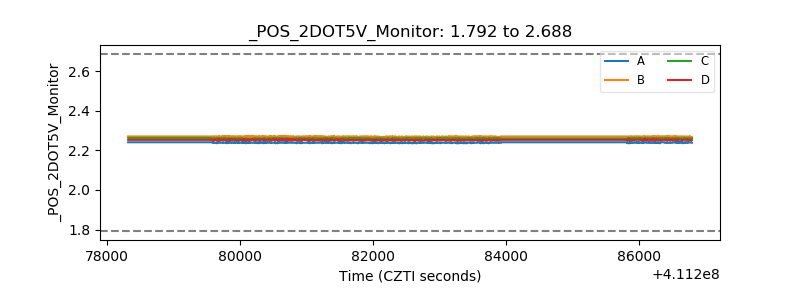 |
| +5 Volts monitor | 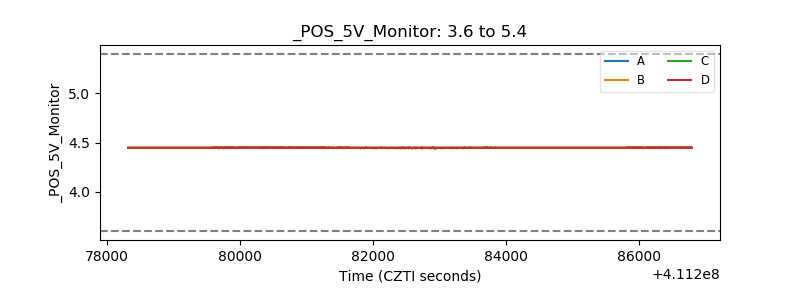 |
| _ROLL_ROT | 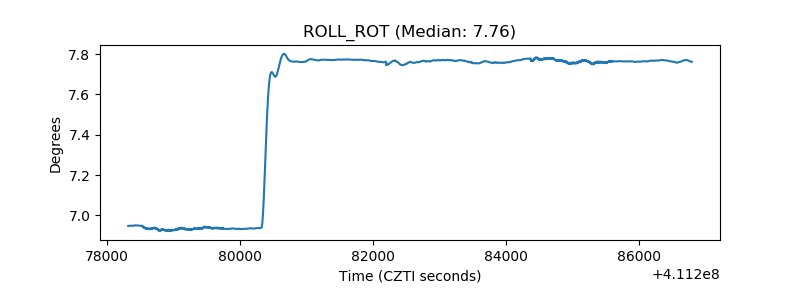 |
| _Roll_DEC | 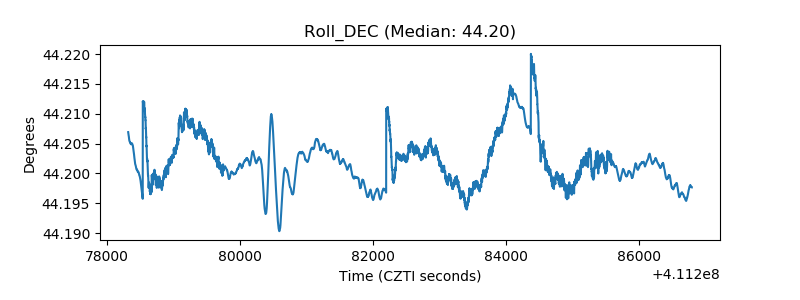 |
| _Roll_RA | 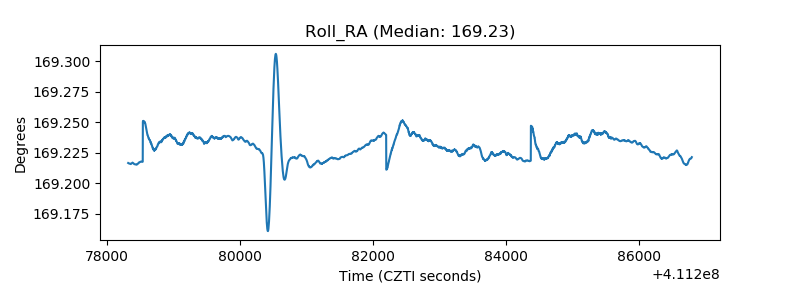 |
| Veto Counter | 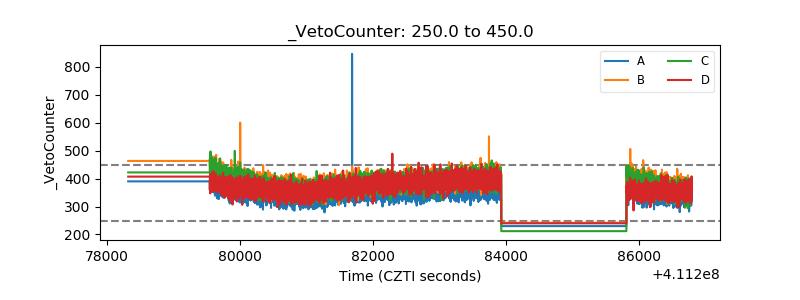 |