| Param | Original file | Final file |
|---|---|---|
| Filename | modeM0/AS1A12_077T06_9000005474_39436cztM0_level2.fits | modeM0/AS1A12_077T06_9000005474_39436cztM0_level2_quad_clean.evt |
| Size (bytes) | 548,910,720 | 81,063,360 |
| Size | 523.5 MB | 77.3 MB |
| Events in quadrant A | 7,201,534 | 508,838 |
| Events in quadrant B | 2,919,060 | 604,771 |
| Events in quadrant C | 2,860,802 | 573,827 |
| Events in quadrant D | 6,921,504 | 391,336 |
| Mode M0 | |||
|---|---|---|---|
| Quadrant | BADHDUFLAG | Total packets | Discarded packets |
| A | 0 | 25058 | 2 |
| B | 0 | 12400 | 1 |
| C | 0 | 11745 | 1 |
| D | 0 | 24235 | 1 |
| Mode SS | |||
|---|---|---|---|
| Quadrant | BADHDUFLAG | Total packets | Discarded packets |
| A | 0 | 110 | 0 |
| B | 0 | 110 | 0 |
| C | 0 | 110 | 0 |
| D | 0 | 110 | 0 |
| Mode M9 | |||
|---|---|---|---|
| Quadrant | BADHDUFLAG | Total packets | Discarded packets |
| A | 0 | 15 | 0 |
| B | 0 | 15 | 0 |
| C | 0 | 15 | 0 |
| D | 0 | 15 | 0 |
| Quadrant | Total seconds | Saturated seconds | Saturation percentage |
|---|---|---|---|
| A | 5359 | 1102 | 20.563538% |
| B | 5359 | 101 | 1.884680% |
| C | 5359 | 29 | 0.541146% |
| D | 5359 | 1557 | 29.053928% |
Noise dominated data is calculated using 1-second bins in cleaned event files. If a bin has >2000 counts, and if more than 50% of those come from <1% of pixels, then it is considered to be noise-dominated and hence unusable.
| Quadrant | # 1 sec bins | Bins with >0 counts | Bins with >2000 counts | High rate bins dominated by noise | Noise dominated (total time) | Noise dominated (detector-on time) | Marked lightcurve |
|---|---|---|---|---|---|---|---|
| A | 6882 | 5360 | 1012 | 1012 | 14.71% | 18.88% | 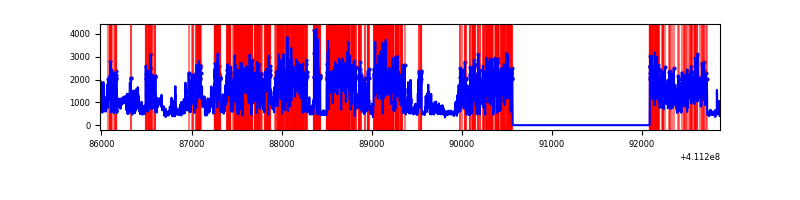 |
| B | 6882 | 5360 | 55 | 55 | 0.80% | 1.03% | 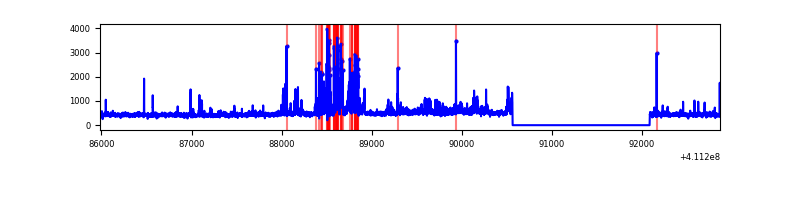 |
| C | 6882 | 5360 | 21 | 21 | 0.31% | 0.39% | 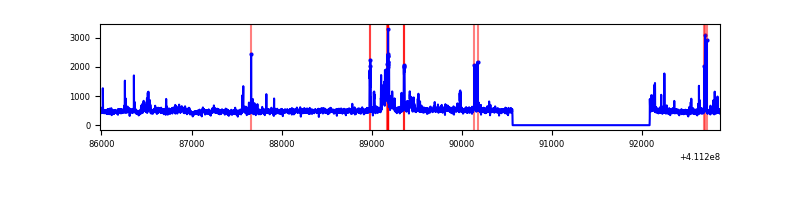 |
| D | 6882 | 5360 | 1226 | 1226 | 17.81% | 22.87% | 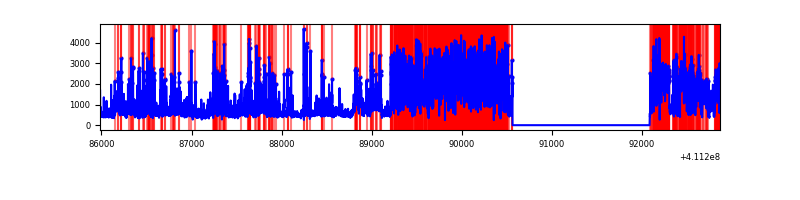 |
Top three noisy pixels from each quadrant. If the there are fewer than three noisy pixels in the level2.evt file, extra rows are filled as -1
| Pixel properties | Quadrant properties | ||||||
|---|---|---|---|---|---|---|---|
| Quadrant | DetID | PixID | Counts | Sigma | Mean | Median | Sigma |
| A | 15 | 222 | 4604616 | 39601.74 | 566 | 554 | 116.3 |
| A | 10 | 83 | 378457 | 3250.52 | 566 | 554 | 116.3 |
| A | 9 | 143 | 18215 | 151.91 | 566 | 554 | 116.3 |
| B | 8 | 3 | 566010 | 4915.76 | 587 | 570 | 115.0 |
| B | 5 | 255 | 24173 | 205.19 | 587 | 570 | 115.0 |
| B | 5 | 172 | 21495 | 181.91 | 587 | 570 | 115.0 |
| C | 9 | 187 | 229005 | 1687.59 | 576 | 578 | 135.4 |
| C | 15 | 214 | 222700 | 1641.01 | 576 | 578 | 135.4 |
| C | 15 | 208 | 84851 | 622.6 | 576 | 578 | 135.4 |
| D | 12 | 0 | 3703424 | 30206.0 | 493 | 477 | 122.6 |
| D | 12 | 227 | 999527 | 8149.54 | 493 | 477 | 122.6 |
| D | 2 | 249 | 209708 | 1706.76 | 493 | 477 | 122.6 |
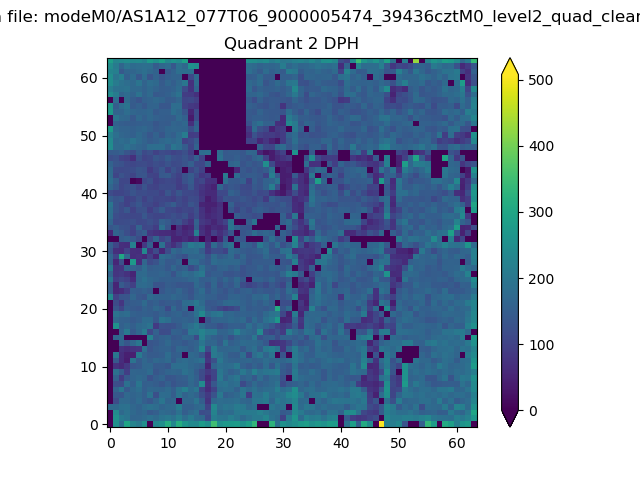
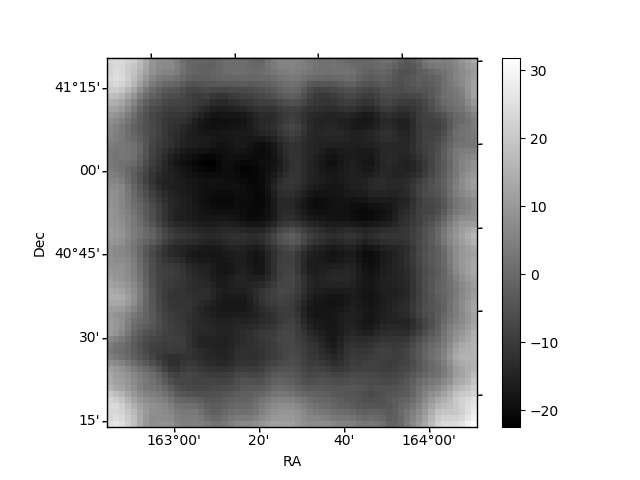
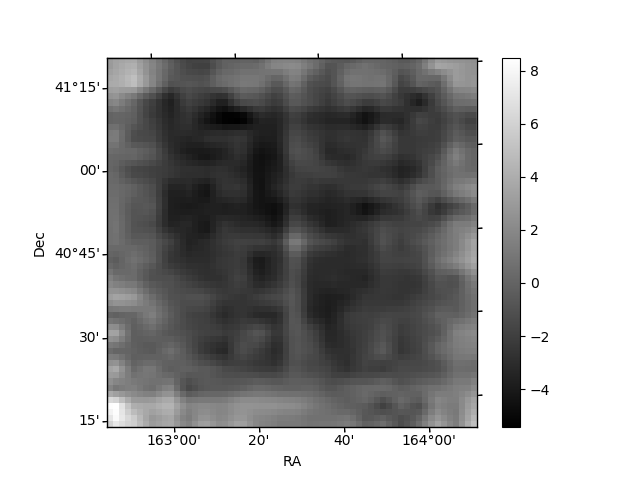
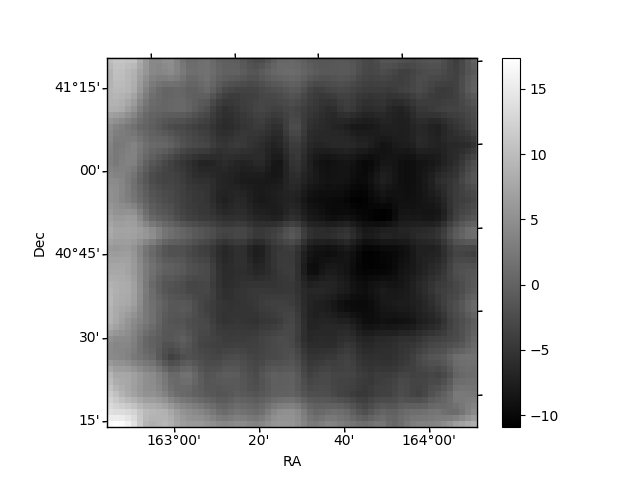
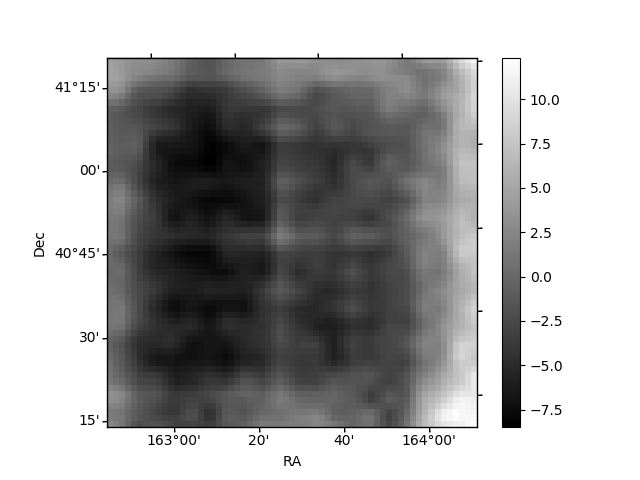
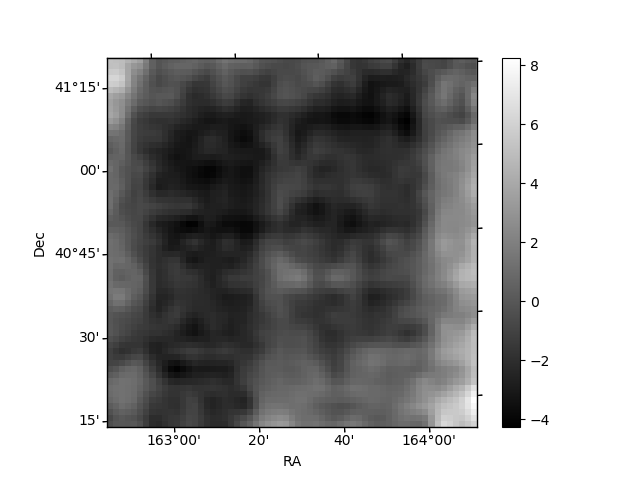
Histogram calculated using DETX and DETY for each event in the final _common_clean file
| Quadrant A | 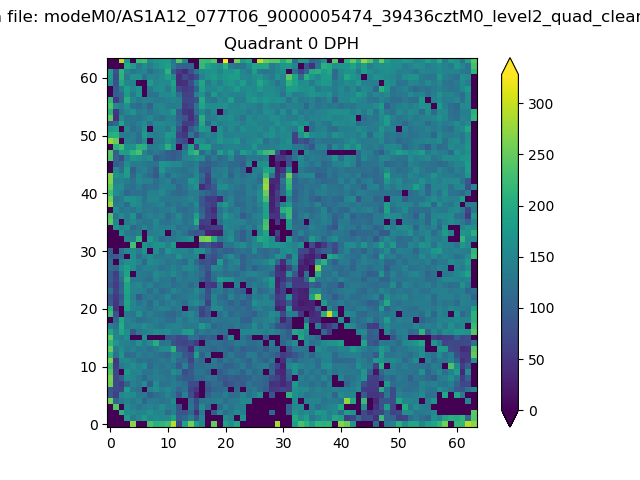 |
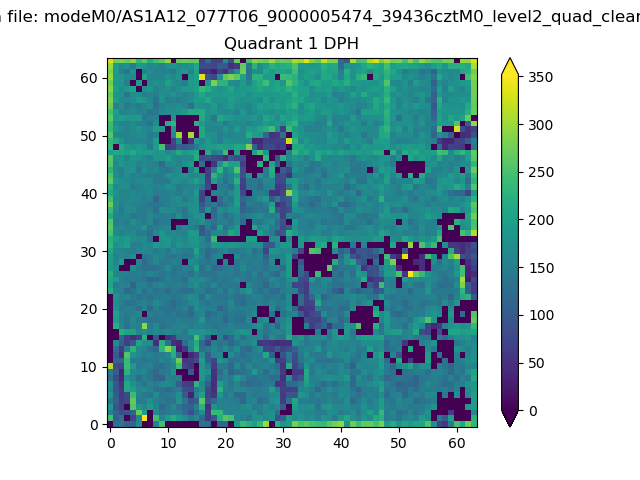 |
Quadrant B |
|---|---|---|---|
| Quadrant D | 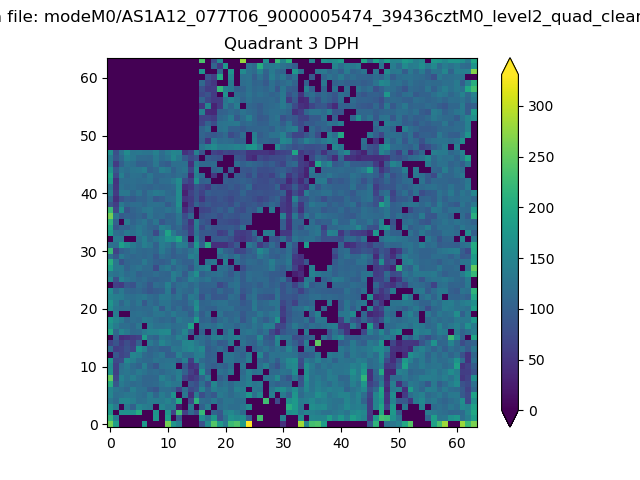 |
 |
Quadrant C |
| Plot type | Count rate plots | Images |
|---|---|---|
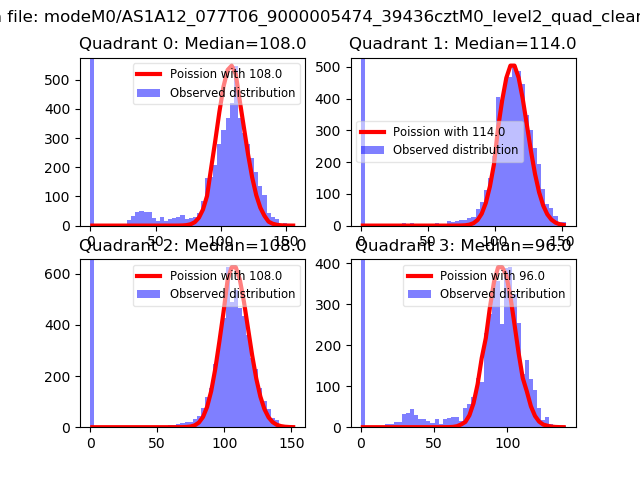
| Comparison with Poisson distribution Blue bars denote a histogram of data divided into 1 sec bins. Red curve is a Poisson curve with rate = median count rate of data. |
 |
 |
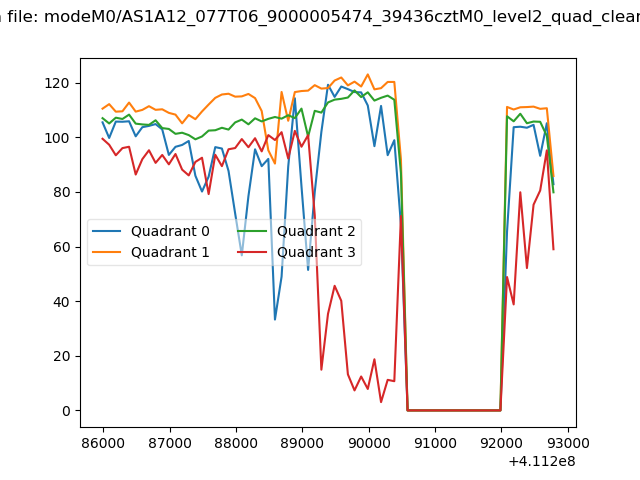
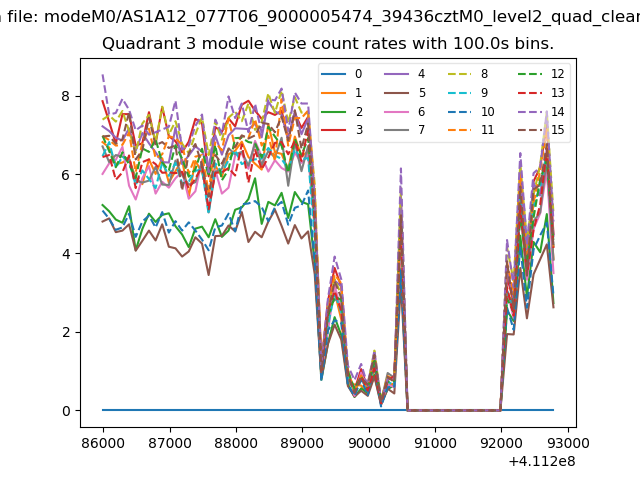
| Quadrant-wise count rates Data is divided into 100 sec bins |
 |
|
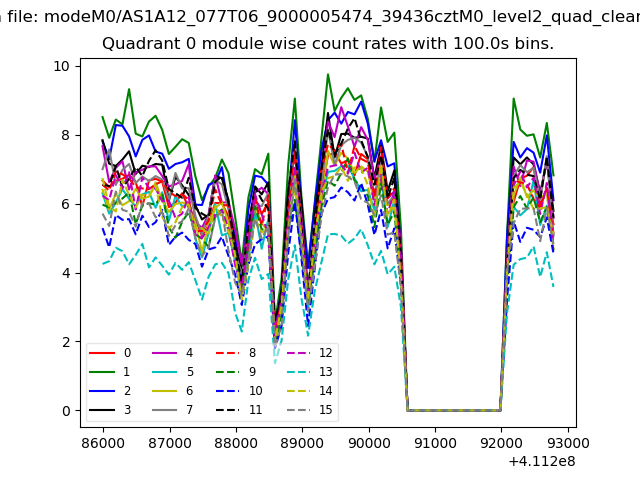
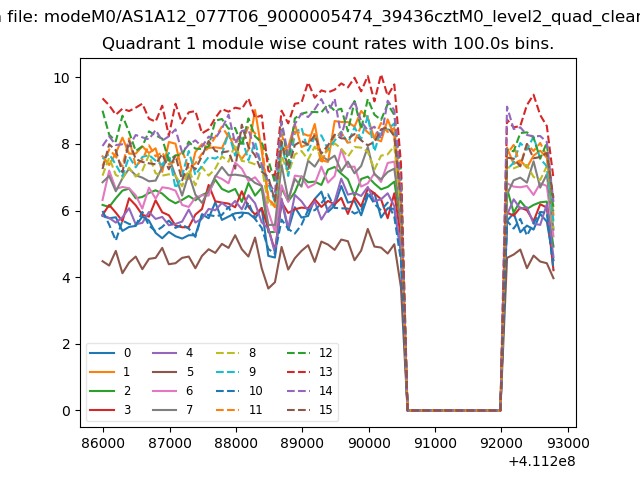
| Module-wise count rates for Quadrant A Data is divided into 100 sec bins |
 |
 |
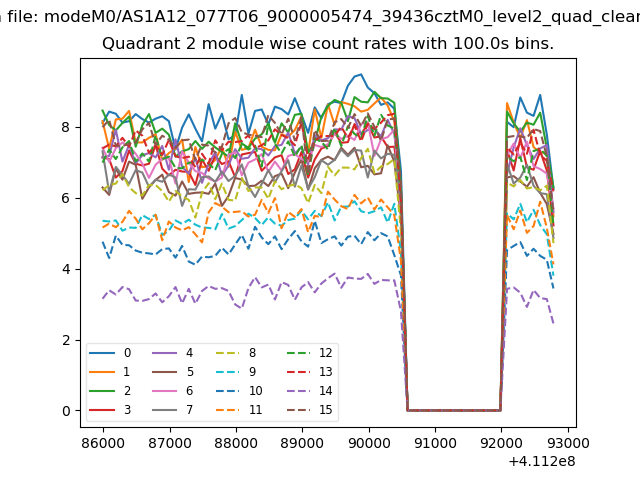
| Module-wise count rates for Quadrant B Data is divided into 100 sec bins |
 |
 |
| Module-wise count rates for Quadrant C Data is divided into 100 sec bins |
 |
 |
| Module-wise count rates for Quadrant D Data is divided into 100 sec bins |
 |
 |
| Parameter | Plot |
|---|---|
| CZT HV Monitor | 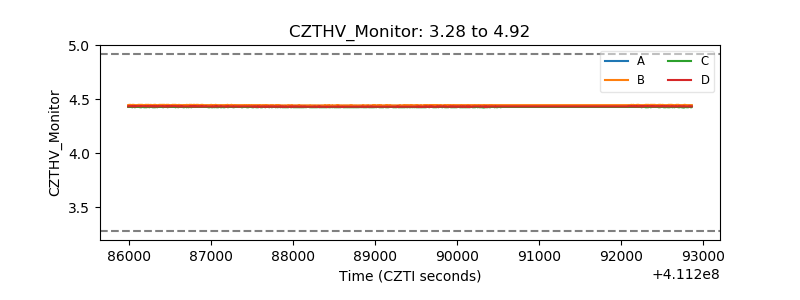 |
| D_VDD | 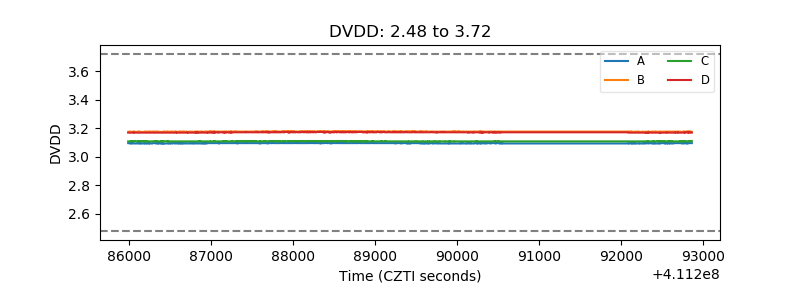 |
| Temperature 1 | 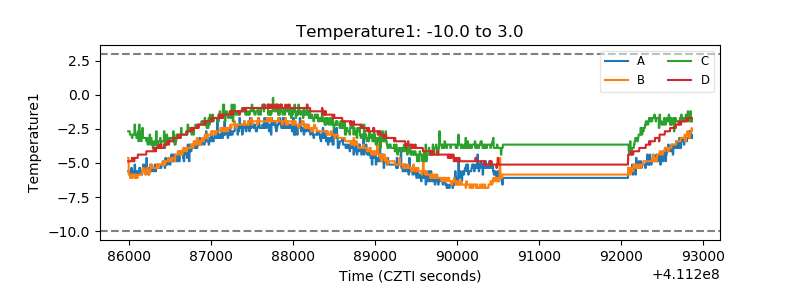 |
| Veto HV Monitor |  |
| Veto LLD | 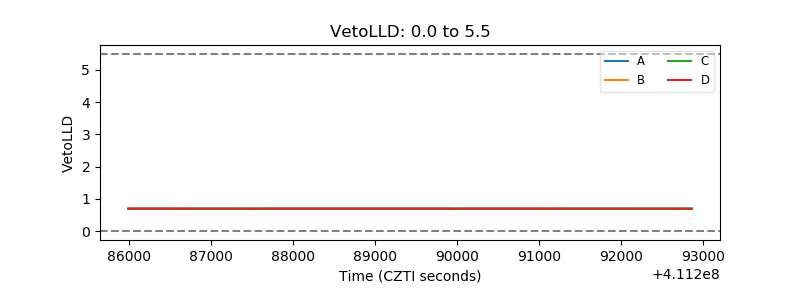 |
| Alpha Counter | 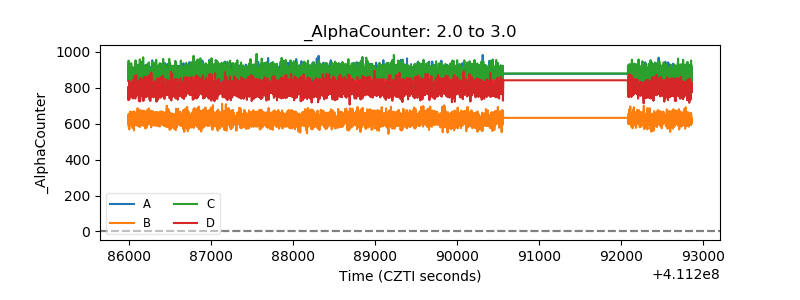 |
| _CPM_Rate | 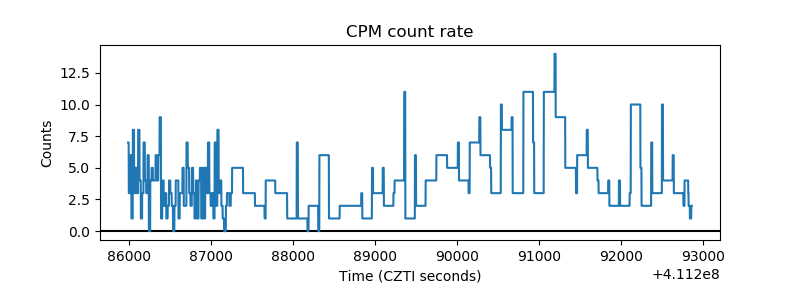 |
| CZT Counter | 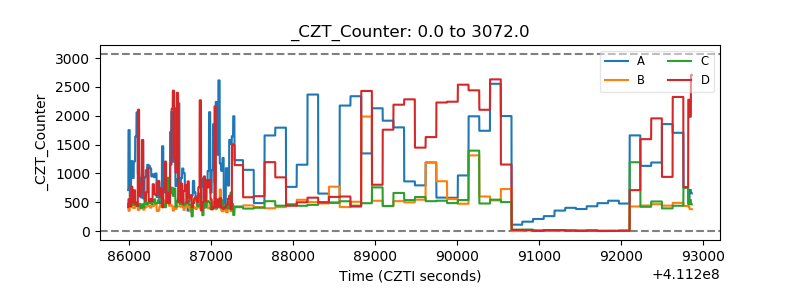 |
| +2.5 Volts monitor | 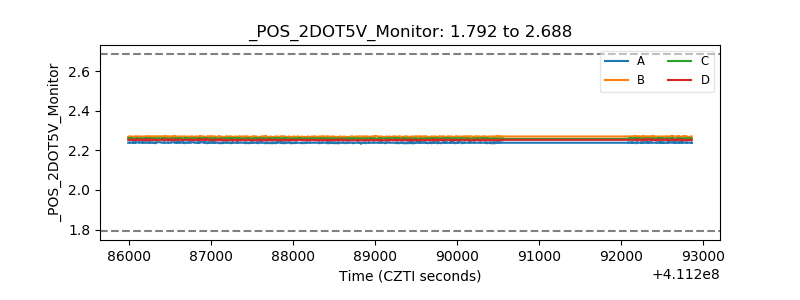 |
| +5 Volts monitor | 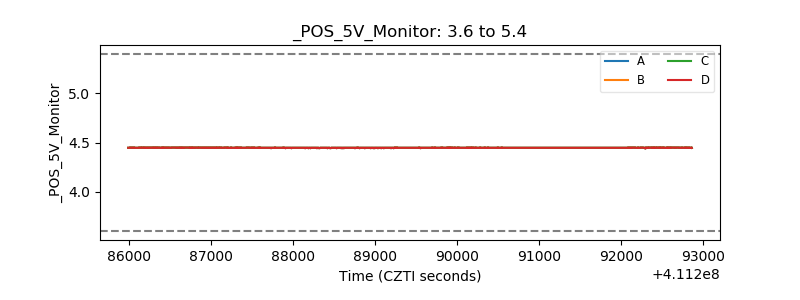 |
| _ROLL_ROT | 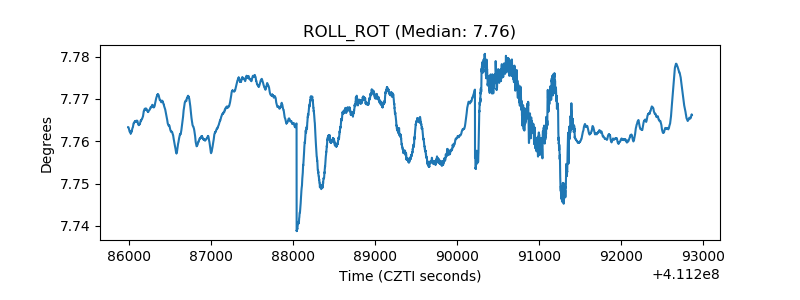 |
| _Roll_DEC | 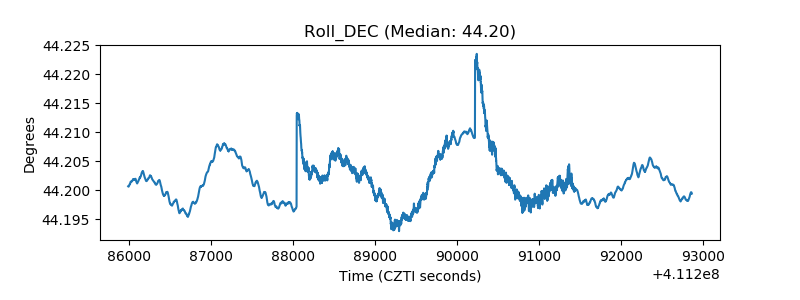 |
| _Roll_RA | 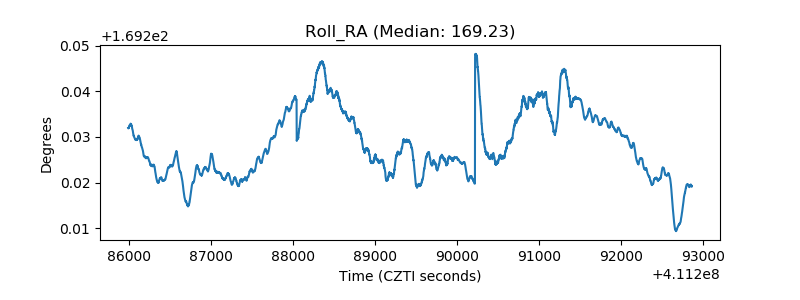 |
| Veto Counter | 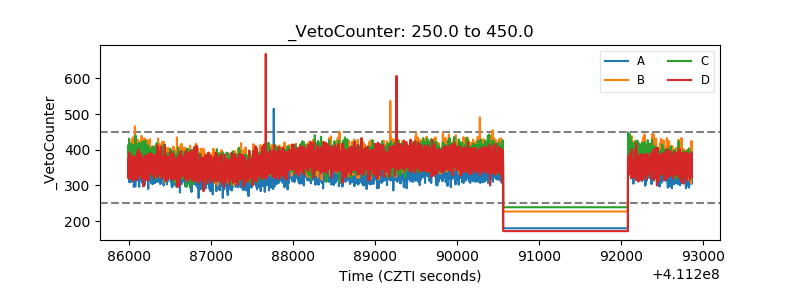 |