| Param | Original file | Final file |
|---|---|---|
| Filename | modeM0/AS1A12_077T06_9000005474_39437cztM0_level2.fits | modeM0/AS1A12_077T06_9000005474_39437cztM0_level2_quad_clean.evt |
| Size (bytes) | 498,029,760 | 89,441,280 |
| Size | 475.0 MB | 85.3 MB |
| Events in quadrant A | 4,512,442 | 625,851 |
| Events in quadrant B | 2,656,306 | 650,587 |
| Events in quadrant C | 3,016,093 | 610,644 |
| Events in quadrant D | 7,801,778 | 417,358 |
| Mode M0 | |||
|---|---|---|---|
| Quadrant | BADHDUFLAG | Total packets | Discarded packets |
| A | 0 | 17084 | 3 |
| B | 0 | 11853 | 2 |
| C | 0 | 12480 | 2 |
| D | 0 | 27154 | 2 |
| Mode SS | |||
|---|---|---|---|
| Quadrant | BADHDUFLAG | Total packets | Discarded packets |
| A | 0 | 116 | 0 |
| B | 0 | 116 | 0 |
| C | 0 | 116 | 0 |
| D | 0 | 116 | 0 |
| Mode M9 | |||
|---|---|---|---|
| Quadrant | BADHDUFLAG | Total packets | Discarded packets |
| A | 0 | 18 | 0 |
| B | 0 | 18 | 0 |
| C | 0 | 18 | 0 |
| D | 0 | 19 | 0 |
| Quadrant | Total seconds | Saturated seconds | Saturation percentage |
|---|---|---|---|
| A | 5776 | 197 | 3.410665% |
| B | 5776 | 15 | 0.259695% |
| C | 5776 | 19 | 0.328947% |
| D | 5776 | 1813 | 31.388504% |
Noise dominated data is calculated using 1-second bins in cleaned event files. If a bin has >2000 counts, and if more than 50% of those come from <1% of pixels, then it is considered to be noise-dominated and hence unusable.
| Quadrant | # 1 sec bins | Bins with >0 counts | Bins with >2000 counts | High rate bins dominated by noise | Noise dominated (total time) | Noise dominated (detector-on time) | Marked lightcurve |
|---|---|---|---|---|---|---|---|
| A | 7119 | 5777 | 159 | 159 | 2.23% | 2.75% | 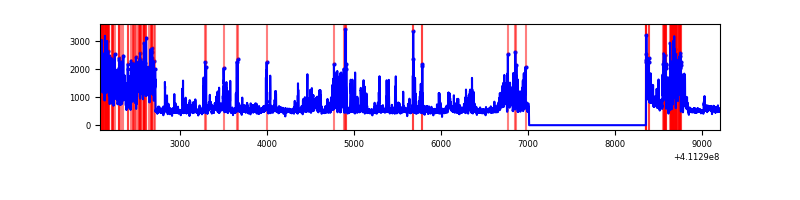 |
| B | 7119 | 5777 | 6 | 6 | 0.08% | 0.10% | 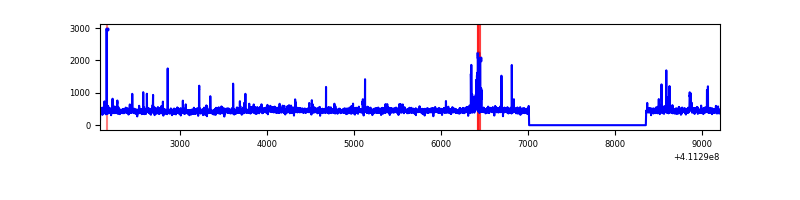 |
| C | 7119 | 5777 | 10 | 10 | 0.14% | 0.17% | 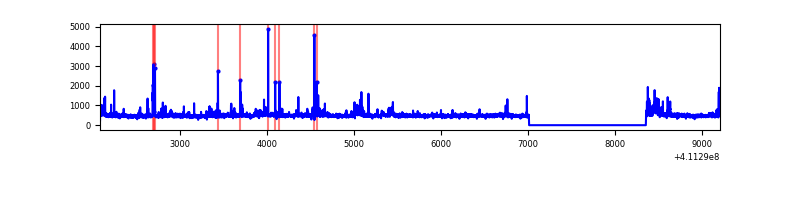 |
| D | 7119 | 5777 | 1576 | 1576 | 22.14% | 27.28% | 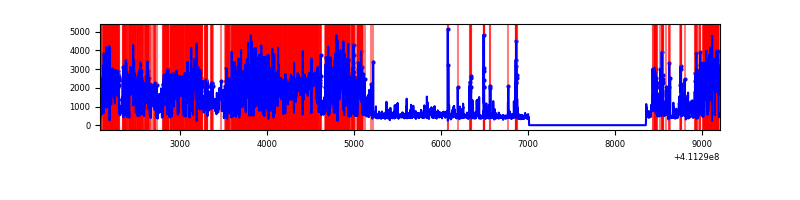 |
Top three noisy pixels from each quadrant. If the there are fewer than three noisy pixels in the level2.evt file, extra rows are filled as -1
| Pixel properties | Quadrant properties | ||||||
|---|---|---|---|---|---|---|---|
| Quadrant | DetID | PixID | Counts | Sigma | Mean | Median | Sigma |
| A | 15 | 222 | 1560030 | 12028.85 | 634 | 620 | 129.6 |
| A | 10 | 83 | 469325 | 3615.46 | 634 | 620 | 129.6 |
| A | 9 | 143 | 15212 | 112.56 | 634 | 620 | 129.6 |
| B | 5 | 172 | 67265 | 537.82 | 637 | 620 | 123.9 |
| B | 8 | 3 | 43559 | 346.51 | 637 | 620 | 123.9 |
| B | 5 | 255 | 23383 | 183.69 | 637 | 620 | 123.9 |
| C | 15 | 214 | 241977 | 1654.73 | 622 | 625 | 145.9 |
| C | 14 | 254 | 134125 | 915.29 | 622 | 625 | 145.9 |
| C | 9 | 187 | 98232 | 669.2 | 622 | 625 | 145.9 |
| D | 12 | 227 | 3046988 | 23627.12 | 521 | 506 | 128.9 |
| D | 12 | 0 | 2151778 | 16684.28 | 521 | 506 | 128.9 |
| D | 2 | 249 | 280746 | 2173.41 | 521 | 506 | 128.9 |
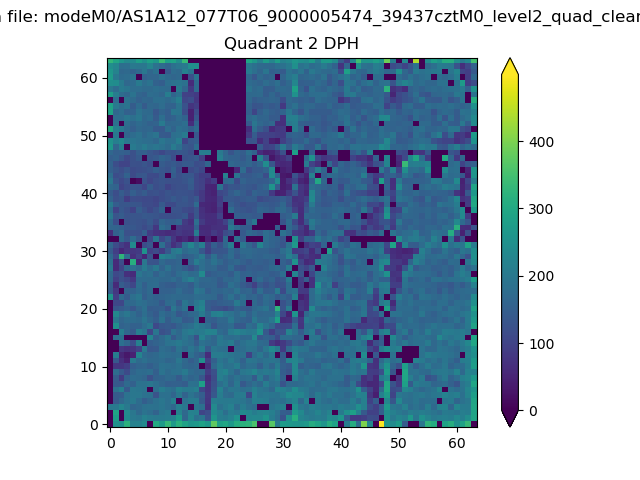
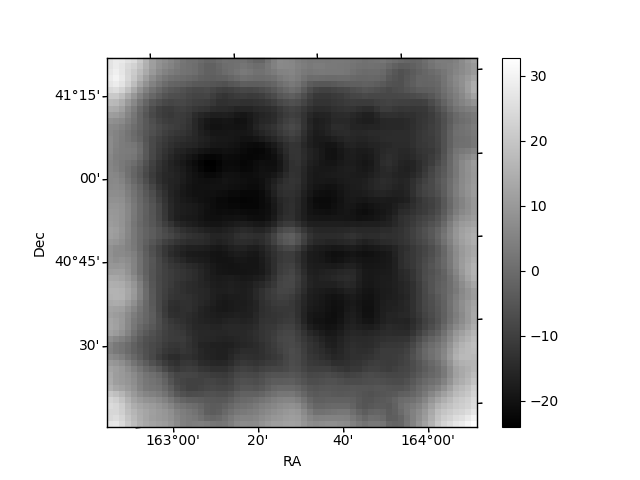
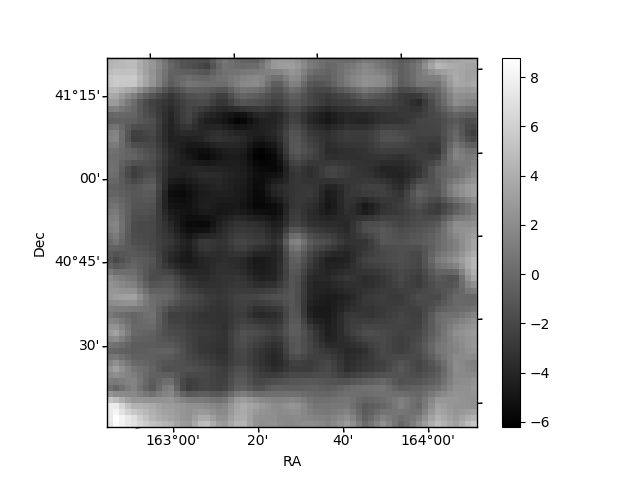
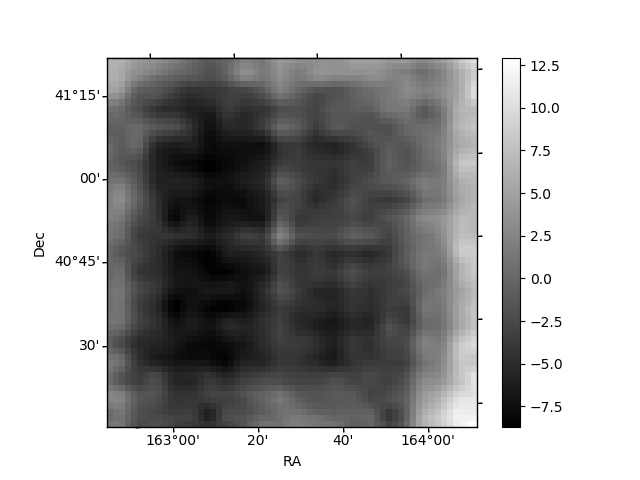
Histogram calculated using DETX and DETY for each event in the final _common_clean file
| Quadrant A | 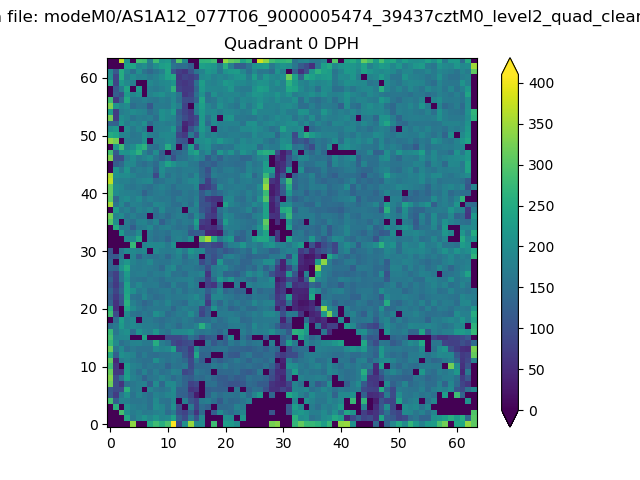 |
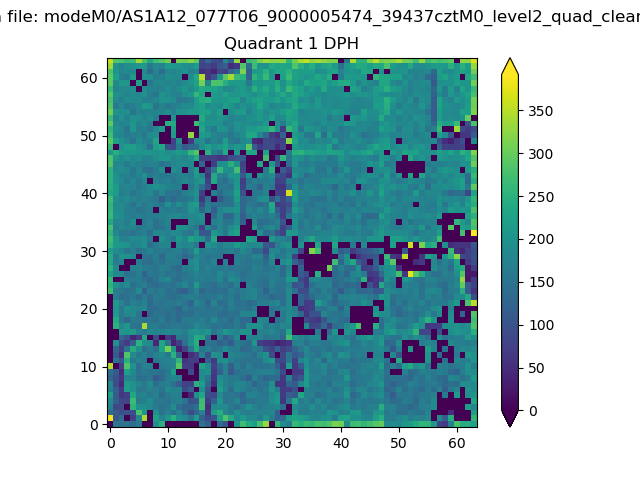 |
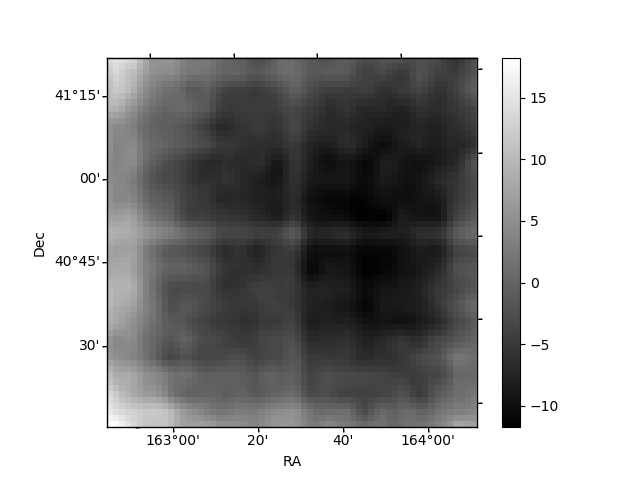
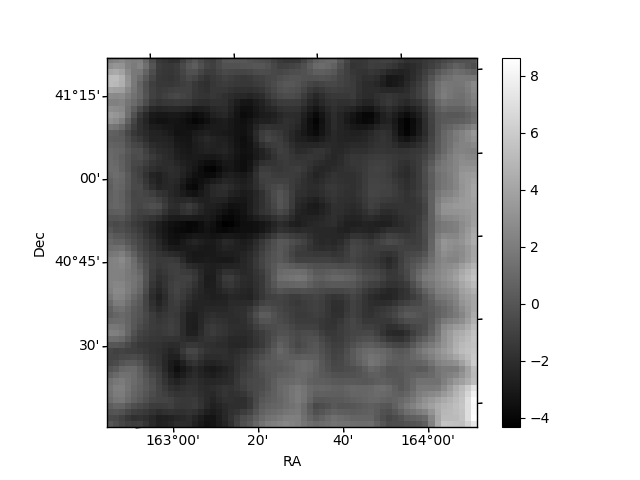
Quadrant B |
|---|---|---|---|
| Quadrant D | 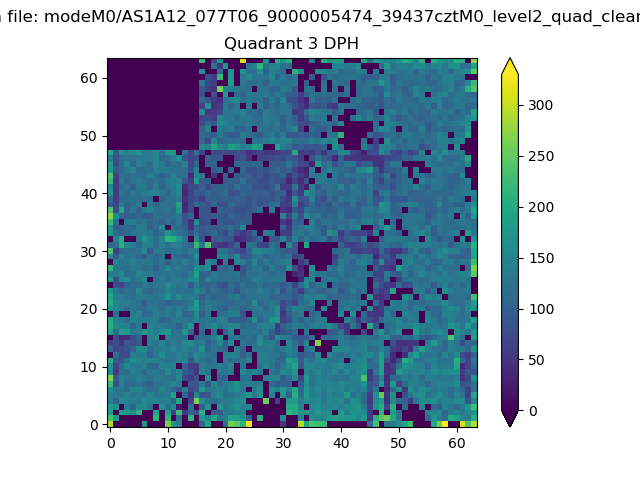 |
 |
Quadrant C |
| Plot type | Count rate plots | Images |
|---|---|---|
| Comparison with Poisson distribution Blue bars denote a histogram of data divided into 1 sec bins. Red curve is a Poisson curve with rate = median count rate of data. |
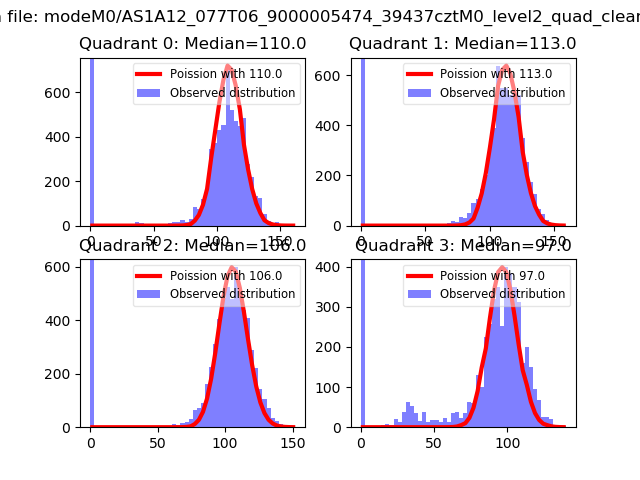 |
 |
| Quadrant-wise count rates Data is divided into 100 sec bins |
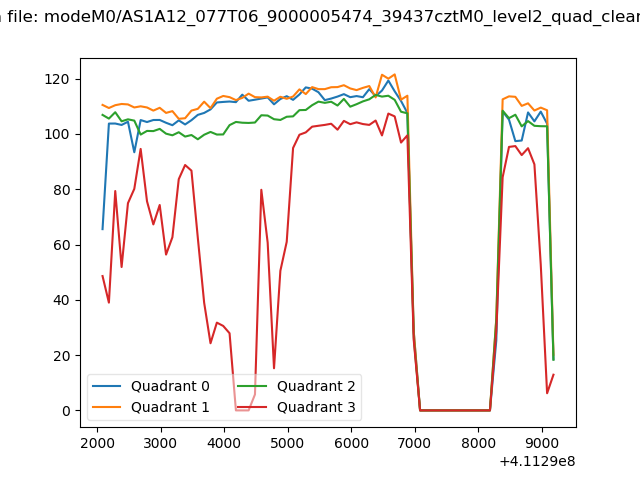 |
|
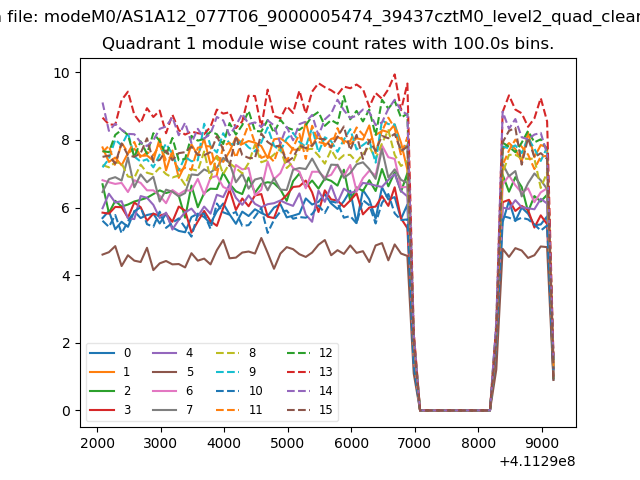
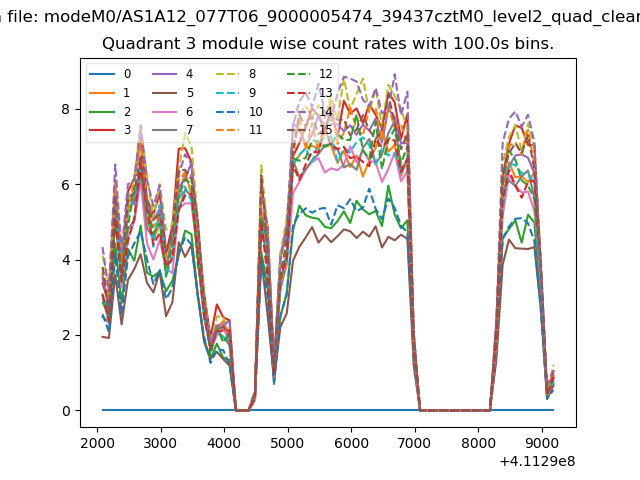
| Module-wise count rates for Quadrant A Data is divided into 100 sec bins |
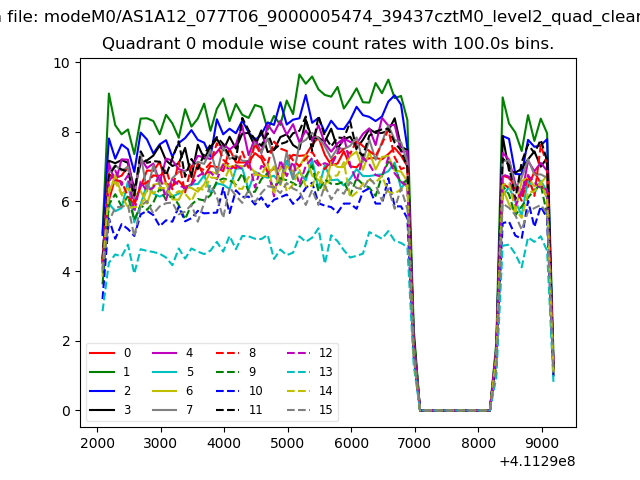 |
 |
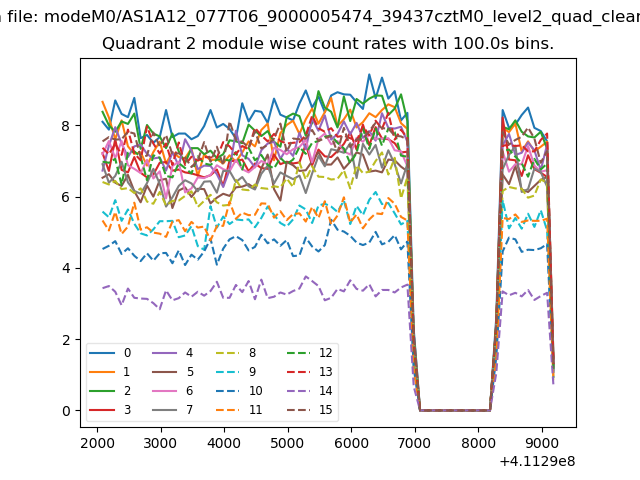
| Module-wise count rates for Quadrant B Data is divided into 100 sec bins |
 |
 |
| Module-wise count rates for Quadrant C Data is divided into 100 sec bins |
 |
 |
| Module-wise count rates for Quadrant D Data is divided into 100 sec bins |
 |
 |
| Parameter | Plot |
|---|---|
| CZT HV Monitor | 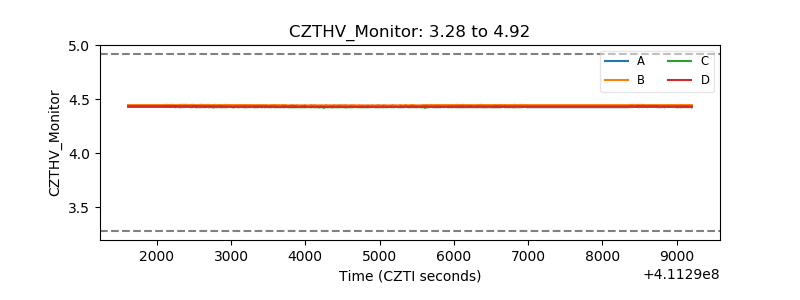 |
| D_VDD | 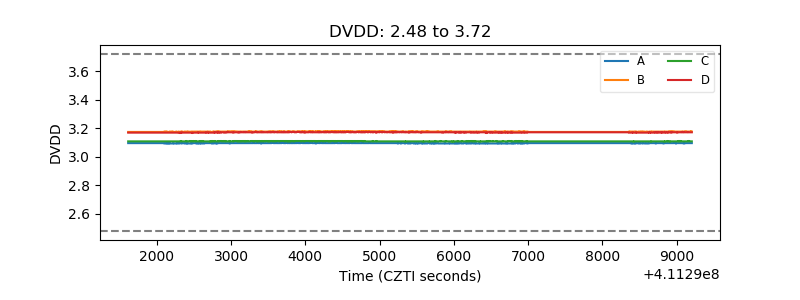 |
| Temperature 1 | 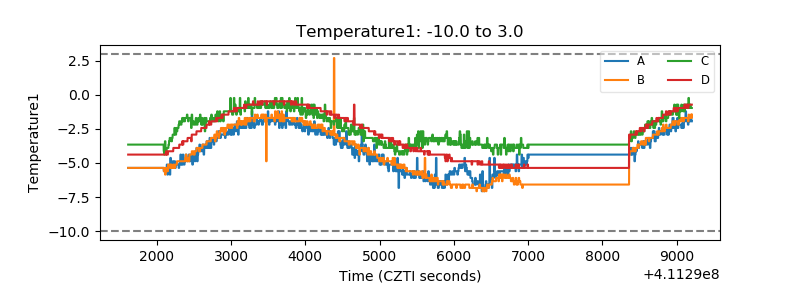 |
| Veto HV Monitor | 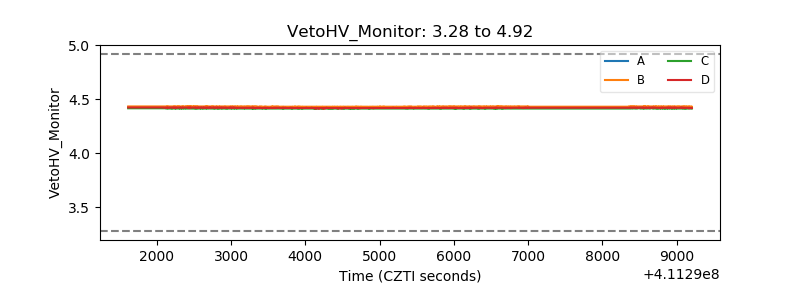 |
| Veto LLD | 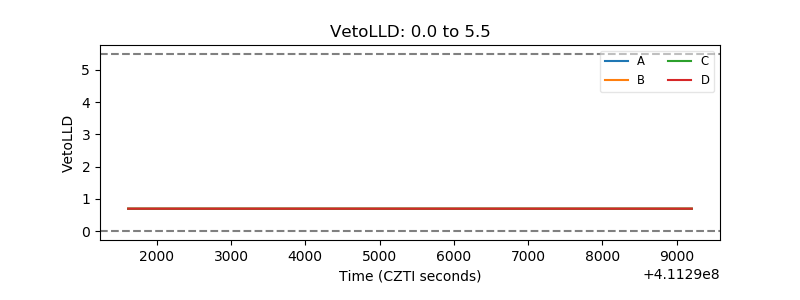 |
| Alpha Counter | 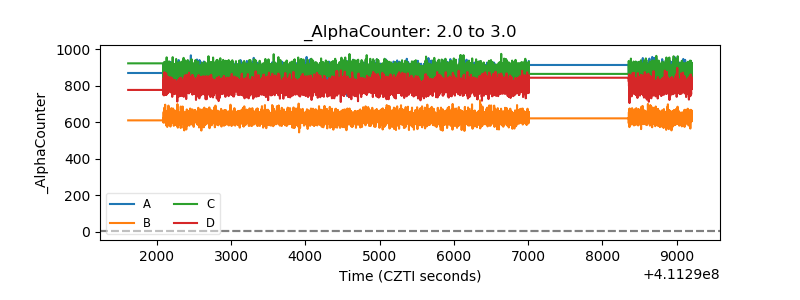 |
| _CPM_Rate | 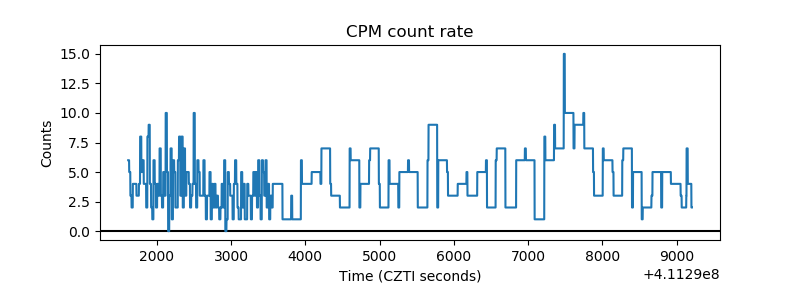 |
| CZT Counter | 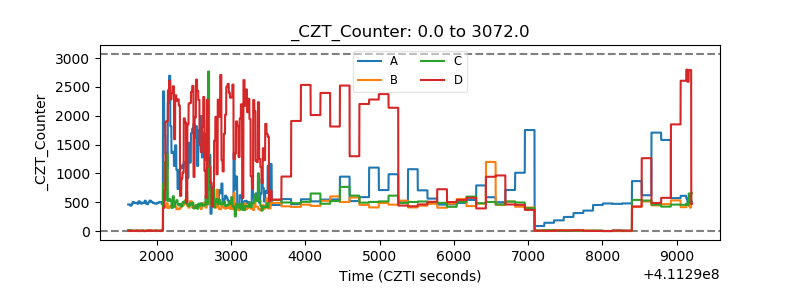 |
| +2.5 Volts monitor | 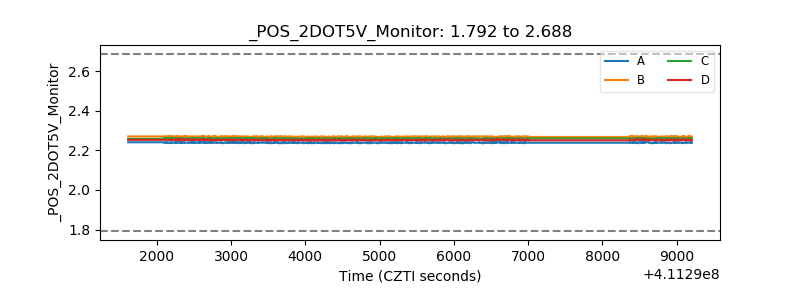 |
| +5 Volts monitor | 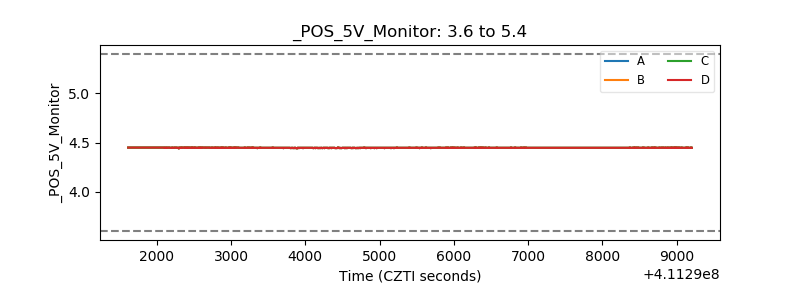 |
| _ROLL_ROT | 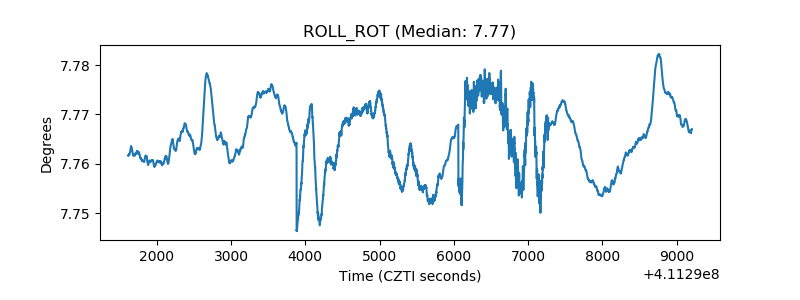 |
| _Roll_DEC | 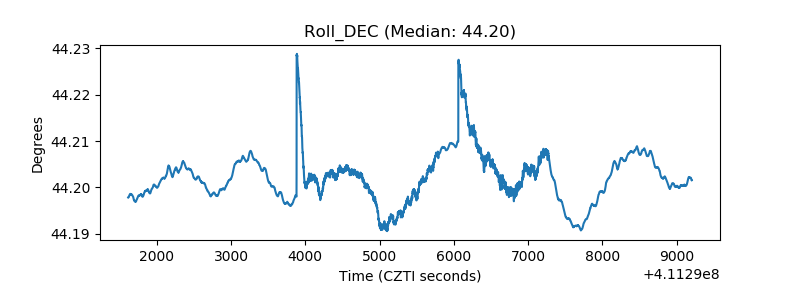 |
| _Roll_RA |  |
| Veto Counter | 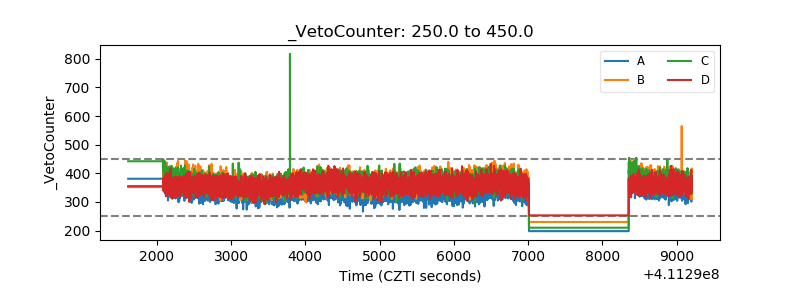 |